Single quasiparticle excitation dynamics on a superconducting island
Abstract
We investigate single quasiparticle excitation dynamics on a small superconducting aluminum island connected to normal metallic leads by tunnel junctions. We find the island to be free of excitations within the measurement resolution allowing us to determine Cooper pair breaking rate to be less than . By tuning the Coulomb energy of the island to have an odd number of electrons, one of them remains unpaired. We detect it by measuring its relaxation rate via tunneling. By injecting electrons with a periodic gate voltage, we probe electron-phonon interaction and relaxation down to a single quasiparticle excitation pair, with a measured recombination rate of . Our experiment yields a strong test of BCS-theory in aluminum as the results are consistent with it without free parameters.
The quasiparticle excitations describing the microscopic degrees of freedom in superconductors freeze out at low temperatures, provided no energy exceeding the superconducting gap is available. Early experiments on these excitations were performed typically close to the critical temperature with large structures so that , the number of quasiparticle excitations, was high clarke1972 ; kaplan1976 ; parker1972 ; wyatt1966 ; dayem1967 ; klapwijk1976 ; chi1979 ; gray1971 ; wilson2001 . Later on, as the fabrication techniques progressed, it became possible to bring close to unity to reveal the parity effect of electrons on a superconducting island lafarge1993 ; eiles1993 ; hergenrother1994 ; averin1990a ; schon1994 . In recent years, the tunneling and relaxation dynamics of quasiparticles, which we address in this letter, have become a topical subject because of their influence on practically all superconducting circuits in the low temperature limit sun2012 ; leander2011 ; knowles2012 ; devisser2011 ; aumentado2004 ; ferguson2006 ; leppakangas2012 ; riste2012 .
We study the quasiparticle excitations in a small aluminum island shown in Fig. 1 (a). The island is connected via a thin insulating aluminum oxide layer to two normal metallic copper leads to form a single-electron transistor (SET) allowing quasiparticle tunneling. We bias the SET by a voltage between the source and drain and polarize the island by an offset charge expressed in units of with a gate voltage . Here is the gate-island capacitance. The current through the SET is governed by sequential tunneling of single quasiparticles and it exhibits Coulomb diamonds which overlap each other because of the superconducting energy gap pekola2008 ; averin2008 , observed for our structure as a region bounded by the red sawtooths in Fig. 1 (b).
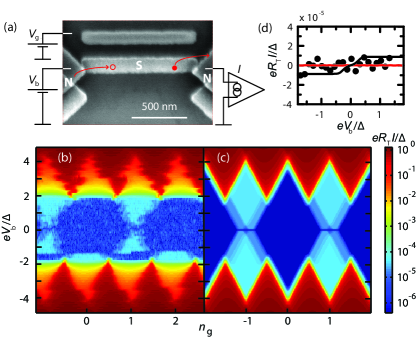
In the sub-gap regime, , of Fig. 1 (b) the current should be suppressed if there are no quasiparticle excitations present. Nonetheless, we observe a finite current which has a period twice as long in as compared to the high bias region, a unique feature of a superconducting island due to Cooper pairing of electrons. Its origin is a single electron unable to pair in the condensate and hence remaining as an excitation. This parity effect has been observed in the past in similar structures lafarge1993 ; eiles1993 ; hergenrother1994 but typically with two-electron Andreev tunneling being the main transport process. We focus on devices where Andreev current is suppressed since a high charging energy, , makes tunneling of two electrons energetically unfavourable compared to that of a single quasiparticle averin2008 ; maisi2011 ; aref2011 . In this case, the transport is dominated by single-electron processes allowing simple and direct probing of the quasiparticle excitations without the interfering multi-electron tunneling.
For a quantitative descripition of the transport characteristics, we performed a numerical simulation of the device operation shown in Fig. 1 (c). To describe simultaneously the charging of the island with electrons and the excitations involved in superconducting state, we assign probability for having excess electrons and quasiparticle excitations on the island. The time evolution of is described by a master equation
| (1) |
where stands for the time derivate of and for the transition rate from state to . These rates are set by electron tunneling between the island and the leads, Cooper pair breaking and recombination of quasiparticles.
Tunneling rates are calculated by the standard first order perturbation theory so that electrons tunneling into the superconducting island to a state with energy will increase the quasiparticle number and electron number by one,
| (2) |
where is the tunneling resistance, is the BCS density of states, the occupation probability of state in superconductor / normal metal and the energy gain from charging and biasing pekola2008 ; averin2008 . If the incoming electron tunnels to the lower branch , it removes an excitation by filling a hole. Similarly, an outgoing electron from the upper branch removes an excitation while if it tunnels out from the lower branch, an excitation is generated.
In the tunneling rates the exact quasiparticle number is accounted for by a nonequilibrium distribution . In general this has a complicated form as a function of energy. However due to the fact that quasiparticles are injected close to the gap, the resulting tunneling and recombination are not sensitive to the functional form of . Our system is also symmetric with respect to the two branches. Therefore we neglect branch imbalance and paramerize the quasiparticle number by an effectively increased temperature and a Fermi distribution in case of . This gives the relation
| (3) |
where is the density of states in the normal state saira2012 and the volume of the island. For the normal metallic leads we use Fermi distribution with , equal to the base temperature of the cryostat. For a detailed description of all transition rates, see the supplementary information suppmat .
For the steady-state represented by Fig. 1 (c), we solve Eq. (1) with and calculate the current as an average of the tunneling rates weighted by the probabilities . The parameter values of sample A: , and tunneling resistances and for the two junctions were used in the simulations. They were determined from measurements in the high bias regime () and hence their values are independent of the sub-gap features.
The simulation of Fig. 1 (c) reproduces the behaviour observed in the experiments. The relaxation rate of a single quasiparticle excitation via tunneling is expected to be , where we have used the measured dimensions for . From the fit in the sub-gap regime we obtain , consistent with the prediction. The value of affects only the value of current on the light blue plateau of Fig. 1 (c), not the actual form or size of the terrace. As our simulation based on sequential tunneling reproduces all the features in the sub-gap regime, we conclude that the two-electron periodicity originates from single-electron tunneling and the operation is essentially free of multi-electron tunneling processes. At odd integer values of , the characteristic feature of Andreev tunneling would be a linear-in- current at low bias voltages and a subsequent drop eiles1993 ; hekking1993 , which is absent in our data. The leakage current in the sub-gap region does not vanish even in the zero temperature limit but remains essentially the same as presented in Fig. 1. Therefore, all quasiparticle excitations cannot be suppressed at finite bias voltages by lowering the temperature, if is close to an odd integer.
At even integer values of we have ideally no current flow as all electrons are paired. If Cooper pair breaking would take place in the island, we would obtain two quasiparticle excitations in the superconductor. One of these excitations can then relax by tunneling to the leads followed by tunneling of a new excitation to neutralize the offset charge, similarly as at the odd case described above. This cycle would continue until the two quasiparticles recombine to a Cooper pair. As the recombination rate, discussed below, is slower than the rates in the cycle, we have several electrons tunneling through the device for each broken pair, hence amplifying the signal. With this model we obtain an upper bound for the pair breaking rate under our experimental conditions based on simulations shown in Fig. 1 (d). This generation rate corresponds to energy absorption at power on the superconducting island.
Under constant biasing conditions, there is at most one quasiparticle present in the subgap regime at low temperatures. The non-tunneling relaxation on the island is then not possible, since recombination would call for two excitations. Therefore the static case can be described by pure tunneling without other relaxation processes. To study recombination of two quasiparticles into a Cooper pair, we injected intentionally more quasiparticles to the island. The injection was done by a periodic drive of the gate voltage. By changing , we change the potential of the superconducting island and either pull quasiparticle excitations into the island when the potential is lowered or create hole type excitations as potential is raised and quasiparticles tunnel out. The number of injected quasiparticles and the number of quasiparticles on the island can then be determined from the resulting current curves with the help of simulations. In the experiment we approach two different limits which we will discuss in the following: When the pumping frequency is high, is large. Such situation can be described by a thermal model, i.e., by an increased time-independent effective temperature of the superconducting island. In the opposite limit of low frequency, is small. Then the thermal model fails and we have to account for the exact time dependent number of quasiparticles.
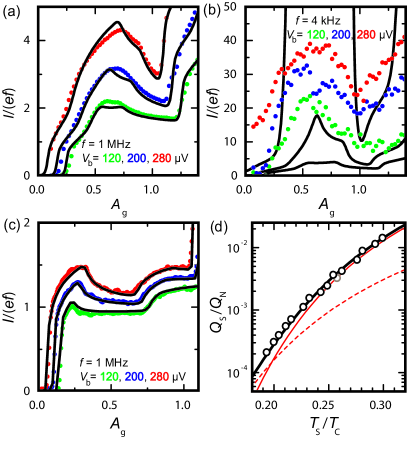
In Fig. 2 (a) we show the measured current for three different values of bias voltage . The gate drive is sinusoidal around with amplitude expressed in units of and frequency corresponding to fast pumping. Without accumulation of quasiparticles to the island, the current would show quantized plateaus with spacing , similar to the SINIS turnstile pekola2008 . However, as the island has a surplus of quasiparticles, i.e. it is heated up, the current is substantially higher. We use now the thermal model where the heat injection to the island by electron tunneling is balanced by electron-phonon interaction. The heat flux into the phonon bath is given by
| (4) |
where is the material constant for electron-phonon coupling, the Riemann zeta function and the Bose-Einstein distribution of the phonons at temperature . See supplementary information for derivation. The same result is obtained by kinetic Boltzmann equation calculations averin1990 ; timofeev2009 . The simulations based on the thermal model are shown as black lines in Fig. 2 (a). The electron-phonon coupling constant , used in simulations, was measured in the normal state, where and is the electron temperature wellstood1994 .
We expect the thermal model to be a good approach if . With the high frequency and large amplitude drive in Fig. 2 (a), we have quasiparticles present for , suggesting that the thermal model is adequate for these data. If the frequency is lowered to , shown in Fig. 2 (b), the thermal model fails as approaches unity. As a further proof of the overheating, we repeated the high frequency measurement using sample B with measured parameter values , , , and . The result is shown in Fig 2 (c). Again, the simulations (black lines) are able to reproduce all non-trivial features of the measured curves. As a summary of the thermal model fits, we repeated the measurement of Fig. 2 (a) at different frequencies and determined by numerical simulations the temperature of the superconducting island and the heat injected into it based on the measured current. The results are shown in Fig. 2 (d) as black circles. The results match well with the expected electron-phonon coupling of the superconductor, Eq. (4), presented as the solid black line.
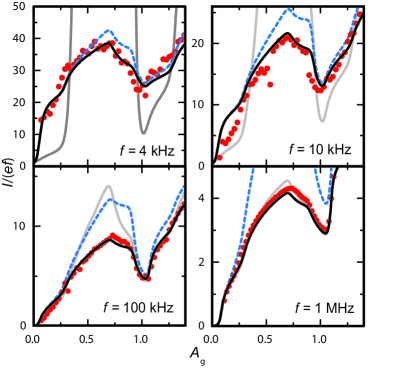
For studying the deviation from the thermal model, we measured the characteristics at four frequencies and at , shown in Fig. 3. The thermal model is presented now as solid gray lines. A more adequate description of the data at low frequencies is obtained by simulations based on Eq. (1), where we keep track on the number of excitations during the operation and take into account the recombination rates. The heat flux of Eq. (4) consists of recombination and scattering which can, respectively, be expressed as
| (5) |
Their contributions are presented in Fig. 2 (d). Whereas the scattering does not change the number of quasiparticles , recombination leads to transitions . We account for this process by including the recombination rate , where the relation between the effective temperature in Eq. (5) and the exact quasiparticle number is given by Eq. (3). The solid black lines of Fig. 3 are calculated with the same value of as obtained in the normal state. Blue dotted lines show similar simulations where electron-phonon relaxation is disregarded.
With the simulations based on instantaneous quasiparticle number we can reproduce the experimental features precisely with no free parameters in the calculation. At the lowest frequency, , we have only one quasiparticle present for most of the time. Hence the curves are not sensitive to the recombination. As frequency is increased, the simulations without electron-phonon relaxation deviate from the experimental data. For we probe the recombination rate of a single qp pair only, . We checked this by artificially changing the recombination rates for , without any significant difference in the curves. At higher frequencies, the recombination for becomes significant as well. The results of the two models approach each other and the thermal model becomes valid.
In summary, a small superconducting island at low temperatures has allowed us to study the dynamics of single electronic excitations and their relaxation. Under quiescent conditions we found a vanishing Cooper pair breaking rate within the measurement resolution: based on the measurement noise we obtained an upper limit of for this rate. On the other hand, by periodically pumping electrons, we controllably increased the number of quasiparticles and were able to measure the recombination rates both in the large quasiparticle number limit and for a single quasiparticle pair: . The recombination rates are in quantitative agreement with the relaxation measured at higher temperatures and in the normal state.
We thank D. V. Averin, G. Schön, F. W. J. Hekking, D. Golubev, T. Heikkilä and A. Zorin for discussions. The work has been supported partially by LTQ (project no. 250280) CoE grant, the European Community’s Seventh Framework Programme under Grant Agreement No. 238345 (GEOMDISS) and the National Doctoral Programme in Nanoscience (NGS-NANO). We acknowledge the provision of facilities and technical support by Aalto University at Micronova Nanofabrication Centre.
References
- (1) A. F. G. Wyatt, V. M. Dmitriev, W. S. Moore and F. W. Sheard, Phys. Rev. Lett. 16, 1166 (1966).
- (2) A. H. Dayem and J. J. Wiegand, Phys. Rev. 155, 419 (1967).
- (3) J. Clarke, Phys. Rev. Lett. 28, 1363-1366 (1972).
- (4) W. H. Parker and W. D. Williams, Phys. Rev. Lett. 29, 924 (1972).
- (5) S. B Kaplan, C. C. Chi, D. N. Langenberg, J. J. Chang, S. Jafarey and D. J. Scalapino, Phys. Rev. B 14, 4854 (1976).
- (6) T. M. Klapwijk and J. E. Mooij, Physica B 81, 132 (1976).
- (7) C. C. Chi and J. Clarke, Phys. Rev. 20, 4465 (1979).
- (8) K. E. Gray, J. Phys. F: Met. Phys. 1, 290 (1971).
- (9) C. M. Wilson, L. Frunzio and D. E. Prober, Phys. Rev. Lett. 87, 067004 (2001).
- (10) P. Lafarge, P. Joyez, D. Esteve, C. Urbina and M. H. Devoret, Phys. Rev. Lett. 70, 994 (1993).
- (11) T. M. Eiles, J. M. Martinis and M. H. Devoret, Phys. Rev. Lett. 70, 1862 (1993).
- (12) J. M. Hergenrother, M. T. Tuominen and M. Tinkham, Phys. Rev. Lett. 72, 1742 (1994).
- (13) D. V. Averin and Yu. V. Nazarov, Phys. Rev. Lett. 69, 1993 (1992).
- (14) G. Schön and A. D. Zaikin Eur. Phys. Lett. 26, 695 (1994).
- (15) L. Sun, L. DiCarlo, M. D. Reed, G. Catelani, Lev S. Bishop, D. I. Schuster, B. R. Johnson, Ge A. Yang, L. Frunzio, L. Glazman, M. H. Devoret and R. J. Schoelkopf, Phys. Rev. Lett. 108, 230509 (2012).
- (16) H. S. Knowles, V. F. Maisi and J. P. Pekola, Appl. Phys. Lett. 100, 262601 (2012).
- (17) P. J. de Visser, J. J. A. Baselmans, P. Diener, S. J. C. Yates, A. Endo and T. M. Klapwijk, Phys. Rev. Lett. 106, 167004 (2011).
- (18) M Lenander et al., Phys. Rev. B 84, 024501 (2011).
- (19) J. Aumentado, M. W. Keller, J. M. Martinis and M. H. Devoret, Phys. Rev. Lett. 92, 066802 (2004).
- (20) A. J. Ferguson, N. A. Court, F. E. Hudson and R. G. Clark, Phys. Rev. Lett. 97, 106603 (2006).
- (21) J. Leppäkangas and M. Marthaler, Phys. Rev. B, 85, 144503 (2012).
- (22) D. Ristè, C. C. Bultink, M. J. Tiggelman, R. N. Schouten, K. W. Lehnert, L. DiCarlo, arXiv:1212.5459 (2012).
- (23) J. P. Pekola, J. J. Vartiainen, M. Möttönen, O.-P. Saira, M. Meschke and D. V. Averin, Nature Phys. 4, 120 (2008).
- (24) D. V. Averin and J. P. Pekola, Phys. Rev. Lett. 101, 066801 (2008).
- (25) V. F. Maisi, O.-P. Saira, Yu. A. Pashkin, J. S. Tsai, D. V. Averin and J. P. Pekola, Phys. Rev. Lett. 106, 217003 (2011).
- (26) T. Aref, V. F. Maisi, M. V. Gustafsson, P. Delsing and J. P. Pekola, Eur. Phys. Lett. 96, 37008 (2011).
- (27) O.-P. Saira, A. Kemppinen, V. F. Maisi and J. P. Pekola, Phys. Rev. B 85, 012504 (2012).
- (28) See supplementary material for details.
- (29) F. W. J. Hekking and Yu. V. Nazarov, Phys. Rev. Lett. 71, 1625 (1993).
- (30) D. V. Averin and A. N. Korotkov, Zh. Eksp. Teor. Fiz. 1661 (1990).
- (31) A. V. Timofeev, M. Helle, M. Meschke, M. Möttönen and J. P. Pekola, Phys. Rev. Lett. 102, 017003 (2009).
- (32) F.C. Wellstood, C. Urbina and J. Clarke, Phys. Rev. B 49, 5942 (1994).