A survey for H i in the distant Universe: the detection of associated 21-cm absorption at
Abstract
We have undertaken a survey for H i 21-cm absorption within the host galaxies of radio sources, in the search of the cool neutral gas currently “missing” at . This deficit is believed to be due to the optical selection of high redshift objects biasing surveys towards sources of sufficient ultra-violet luminosity to ionise all of the gas in the surrounding galaxy. In order to avoid this bias, we have selected objects above blue magnitudes of , indicating ultra-violet luminosities below the critical value of W Hz-1, above which 21-cm has never been detected. As a secondary requirement to the radio flux and faint optical magnitude, we shortlist targets with radio spectra suggestive of compact sources, in order to maximise the coverage of background emission. From this, we obtain one detection out of ten sources searched, which at is the third highest redshift detection of associated 21-cm absorption to date. Accounting for the spectra compromised by radio frequency interference, as well as various other possible pitfalls (reliable optical redshifts and turnover frequencies indicative of compact emission), we estimate a detection rate of %, close to that expected for W Hz-1 sources.
keywords:
galaxies: active – quasars: absorption lines – radio lines: galaxies – ultra violet: galaxies – galaxies: fundamental parameters – galaxies: high redshift1 Introduction
1.1 A paucity of cool neutral gas at high redshift
Despite the detection of large columns of neutral hydrogen in the early Universe, through the known 1500 damped Lyman- absorbers (DLAs, see Curran et al. 2002; Noterdaeme et al. 2009 and references therein)111Where the neutral hydrogen column density exceeds ., at only 80, detections of the 21-cm transition of neutral atomic hydrogen at remain rare.222The low probability of the transition, compounded by the inverse square law, renders 21-cm in undetectable in emission at (see Catinella et al. 2008). In absorption however, the strength of the line only depends upon the column density and the flux of the continuum source, allowing this to be detected to much higher redshift. Detection of this at high redshift is of particular importance since this transition traces the cool component of the neutral gas, the reservoir for star formation, whereas the Lyman- transition traces all of the neutral gas.
The paucity of redshifted 21-cm absorption to date can largely be attributed to the low fraction of background sources with sufficient radio flux ( Jy), the narrow bandwidths free of radio frequency interference (RFI), as well as the limited frequency coverage of current radio telescopes. Of the detections, half are due to absorbers intervening the sight-lines to more distant radio sources (see Gupta et al. 2012 and references therein), with the other half being associated with the gas in the host galaxy of the source itself (see Curran & Whiting 2010 and references therein). Furthermore, both types of absorber are subject to additional selection effects, increasing the difficulty of detection at high redshift:
-
–
For the intervening absorbers, the majority of detections occur at redshifts of (see Curran 2010) and for those known to contain large columns of neutral hydrogen (the DLAs), the detection rate at is only a third that at (60%, cf. 20%). This is believed to be due to the geometry effects introduced by an expanding Universe, where high redshift absorbers are always disadvantaged in how effectively they intercept the background emission (Curran, 2012).
-
–
For the associated absorbers, at lower redshifts () there is a probability of a detection, depending on whether the large-scale gas disk intercepts the line-of-sight to the radio source (Curran & Whiting, 2010). However, at higher redshifts the probability of a detection falls drastically. This is believed to be due to the traditional optical selection of targets, where the availability of a redshift biases towards the most ultra-violet luminous sources (Curran et al., 2008). For most of the radio sources known at these large luminosity distances all of the neutral gas is probably ionised (Curran & Whiting, 2012).
This highlights a major difference between the two types of absorber: While there are equally few detections of 21-cm in intervening systems, all of these are known or suspected333Having a rest-wavelength of Å, the Lyman- transition can only be detected by ground-based telescopes at redshifts of . At , the Mg ii Å equivalent width may be used infer the presence of a DLA (Rao et al., 2006) and perhaps even to estimate the total hydrogen column density (Curran, 2010). to contain large columns of neutral hydrogen and, where searched, 21-cm detection rates are high (Gupta et al., 2012). However, within the high redshift radio sources themselves, the neutral gas may be truly absent (the “UV interpretation”, Curran & Whiting 2012) and until a population of 21-cm absorbing galaxies is found, this material, the reservoir for star formation, may be regarded as “missing”. Finding these missing systems is of utmost importance in quantifying the number of gas-rich galaxies which exist below the detection thresholds of optical spectroscopy. Based upon the UV interpretation, we therefore suggest that high redshift surveys should be directed towards the most optically dim radio sources, where the faint magnitudes indicate that the ultra-violet luminosity of the active galactic nucleus (AGN) is below the critical ionising continuum luminosity of W Hz-1, above which associated 21-cm absorption has never been detected (Curran et al. 2008; Curran & Whiting 2010; Curran et al. 2011a; Grasha & Darling 2011).444Page et al. (2012) also find a critical X-ray luminosity, above which sources are not detected in 250 m continuum emission.
1.2 Source selection
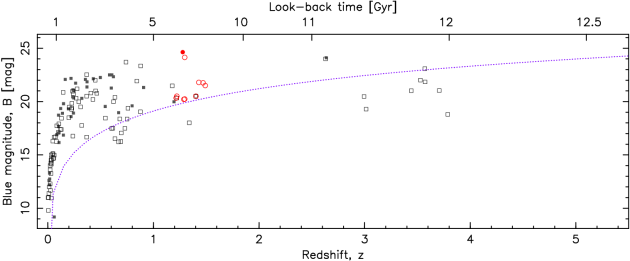
Ideally, we would like to search for associated 21-cm absorption at redshifts of , the regime of the original exclusive non-detections which alerted us to the critical luminosity (Curran et al., 2008) and where there is currently only one detection (at , Uson et al. 1991). However, our usual source catalogues, the Parkes Half-Jansky Flat-spectrum Sample (PHFS, Drinkwater et al. 1997) and Quarter-Jansky Flat-spectrum Sample (PQFS, Jackson et al. 2002), yield only two sources with suitably faint blue magnitudes (, cf. Fig. 1) in the 90-cm band (), both of which have been previously searched (Curran et al. 2008).
Furthermore, the remaining catalogues of radio sources, which have both magnitudes and redshifts available (Curran et al., 2011b), yield only ultra-steep spectrum sources in the 305–360 MHz band (). The steep radio spectra may indicate very extended emission, minimising the covering factor, , of the neutral gas, possibly a cause of the exclusive non-detections of W Hz-1 sources at these redshifts (Curran et al., 2012).
In order to bypass these issues, we are forced to probe lower redshifts (), where 21-cm is redshifted into the 610 MHz band of the Giant Metrewave Radio Telescope (GMRT).555http://gmrt.ncra.tifr.res.in/ In order to avoid steep spectrum sources, we have therefore prioritised the faintest objects mostly from the PHFS and PQFS, where the blue magnitudes of indicate luminosities of W Hz-1 at these redshifts (Fig. 1). These catalogues, by definition, comprise of sources with flat spectra over 2.7–5.0 GHz, although in order to obtain a sample of ten, a few were added from the other radio catalogues (see Table 1), with the priority of and a flux density in excess of 0.1 Jy, meaning that a target with a flat spectrum or a clear turnover frequency could not always be included. From a survey of these ten objects, we report the third highest redshift detection of associated 21-cm absorption to date (at in SDSS J154508.52+475154.6), as well as eight upper limits and one source lost to RFI, which we present and discuss here.
2 Observations
Each of the sources was observed on 22–24 January 2012 with the GMRT full 30 antenna array, using the 610 MHz receiver backed with the FX correlator over a bandwidth of 16 MHz. This was spread over 512 channels in orthogonal circular polarisations, giving a channel spacing of . This is sufficient to spectrally resolve all of the associated 21-cm absorbers currently known (which range from 18 to 475 , Curran et al. 2012), while maintaining a redshift coverage of , in order to cover any uncertainties in the optical redshifts of the targets. Each source was observed for a total of two hours with the aim of reaching a optical depth limit of per channel, or a sensitivity to , which is close to the lower limit for the published 21-cm searches.
For each source, 3C 48, 3C 147 and 3C 286 were used for bandpass calibration and a strong nearby point source for
phase calibration. The data were flagged and reduced using the miriad interferometry reduction package, with
flagging of the edge channels leaving the central 470 channels, giving a span of . After averaging
the two polarisations, a spectrum was extracted from the cube. As per usual when reducing GMRT data with miriad,
it was not possible to flux calibrate the targets via the gpboot task. The flux densities of the (mostly
unresolved) sources were found to be generally lower than those estimated (Table 1),
although the derived optical depths will be accurate. Regarding each source:
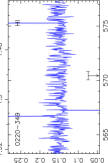
PKS 0220–349 was observed for a total of 2.58 hours. After flagging of non-functioning antennas (22 and 23),
the RR polarisation seemed worst affected be RFI. Further flagging left 145 baseline pairs in this polarisation
and 378 in the LL. The source was partially resolved by the synthesised beam.
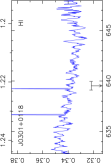
BZQ J0301+0118 was observed for a total of 2.08 hours.
All antennas were functioning, giving a high quality image from the 435 baselines pairs. Upon the extraction
of a spectrum, however, the bandpass was dominated by spikes and flagging of the worst affected
data, leaving 374 baseline pairs, revealed a sinusoidal ripple. Further flagging reduced this somewhat, although it
was still evident. The source was partially resolved by the
synthesised beam.
PKS 0357–264 was observed for a total of 1.53 hours. All antenna were functioning, but severe RFI meant that no reasonable image nor spectrum could be produced. Flagging of
the baselines in which r.m.s. noise level exceeded 1 Jy, left only 12 baseline pairs from which the image and spectrum
fared no better.
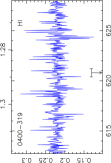
PKS 0400–319 was observed for a total of 2.01 hours. RFI meant that all but the first 30 minutes of the data had to be flagged on all baseline pairs,
before a satisfactory image could be produced, although the extracted spectrum still exhibited spikes. The source
was unresolved by the synthesised beam.
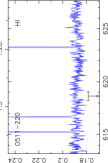
PKS 0511–220 was observed for a total of 2.07 hours. All antennas were functioning, giving
a high quality image from the 435 baselines pairs. The extracted spectrum
was, however, dominated by spikes, due to RFI throughout the observing run. We therefore flagged all baselines pairs for
which the r.m.s. noise level exceeded 1 Jy, leaving 147 pairs. The extracted spectrum, although noisier, was far less
dominated by the spikes which marred the unflagged spectrum. The source was unresolved by the
synthesised beam.
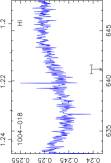
[HB89] 1004–018 was observed for a total of 2.38 hours. All antennas were functioning, although
baselines consisting of antenna 7 and a
number of other baselines pairs, which exhibited a ripple, were flagged. This left 401 baseline pairs
and the source was unresolved by the synthesised beam.
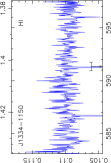
CGRaBS J1334–1150 was observed for a total of 1.89 hours. All antenna were functioning and only the LL
polarisation of antenna 17 had to be removed. Following this, a satisfactory image was produced from which the extracted
spectrum showed evidence of absorption with a peak of , i.e. redshifted by 40 and within of the optical redshift (). However, since this, and other similar features of a single channel
width, appear at various locations in the image, we believe that this is a birdie. The source was unresolved by the
synthesised beam.
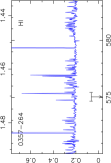
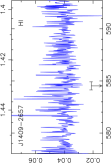
CGRaBS J1409–2657 was observed for a total of 2.04 hours.
Although all antennas were functioning, phase calibration was not possible until the LL polarisation was removed. Upon
this, an image could be produced and further flagging of bad baselines (leaving 349 pairs) revealed a double source
(Fig. 2). Although some other artifacts remain in the image, further cleaning of the data was
detrimental.
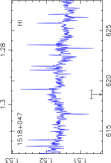
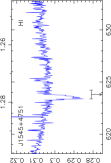
4C +04.51 (PKS 1518+047) was observed for 1.66 hours, although RFI meant that the last 40 minutes has to be removed. All antenna
were functioning and, due to the strength of the source, self calibration produced a high quality image, although some spikes are still
evident in the bandpass. The source was unresolved by the synthesised beam.
SDSS J154508.52+475154.6 was observed for 2.07 hours. Flagging of non-functioning antennas (22, 23 and 30), left
351 baseline pairs, from which an absorption line was clearly apparent in each polarisation of the averaged spectra.
The source was unresolved by the synthesised beam.
| Source | -range | B | Ref | |||||||
|---|---|---|---|---|---|---|---|---|---|---|
| PKS 0220–349 | 1.49 | 0.58 | 0.146 | 17.1 | 1.470–1.503 | 21.50 | D97 | |||
| BZQ J0301+0118 | 1.221 | 0.74 | 0.340 | 15.3 | 1.192–1.245 | 20.5 | J02 | |||
| PKS 0357–264 | 1.47 | 1.26 | — | no limits available due to rfi | 1.434–1.493 | 21.76 | D97 | |||
| PKS 0400–319 | 1.288 | 0.65 | 0.219 | 15.7 | 1.262–1.318 | 20.21 | D97 | |||
| PKS 0511–220 | 1.296 | 0.61 | 0.187 | 15.8 | 1.279–1.302 | 20.24 | D97 | |||
| [HB89] 1004–018 | 1.2154 | 0.60 | 0.248 | 15.2 | 1.192–1.244 | 20.33 | D97 | |||
| CGRaBS J1334–1150 | 1.402 | 0.37 | 0.109 | a | 16.5 | 1.376–1.436 | 20.5 | J02 | ||
| CGRaBS J1409–2657 | 1.43b | 0.10 | 0.039 | 16.7 | 1.396–1.454 | 21.8c | W92,D97,J02 | |||
| 4C +04.51 | 1.296 | 4.94 | 1.515 | 15.8 | d | 1.263–1.317 | 24.14e | W85,S96 | ||
| SDSS J154508.52+475154.6 | 1.277 | 0.76 | 0.304 | f | 15.6 | 0.065 | 1.2780 | 24.63g | T94,M98 | |
References: W85 – Wall & Peacock (1985), W92 – White (1992), T94 – Taylor et al. (1994), S96 – Stickel & Kühr (1996), D97 – Drinkwater et al. (1997) [PHFS], M98 – Machalski (1998), J02 – Jackson et al. (2002) [PQFS].
Notes: aNoise level is valid over region excluding the absorption spike, redshifted by 40 () with respect to the reference redshift. bQuoted value of (Drinkwater et al., 1997) is probably incorrect (Sect. 3.2.5). c magnitude from J02 (D97 quote ). d21-cm also undetected by Gupta et al. (2006) to a weaker limit [ ]. eEstimated from (Wall & Peacock, 1985), using the fits in Curran & Whiting (2010). fThe peak depth of the absorption. The r.m.s. noise is 0.002 Jy. gEstimated from (Machalski, 1998), using the fits in Curran & Whiting (2010).
3 Results and discussion
3.1 Detection of associated H i 21-cm at
The survey has resulted in a clear detection of redshifted H i 21-cm absorption, which we show in Fig. 4.
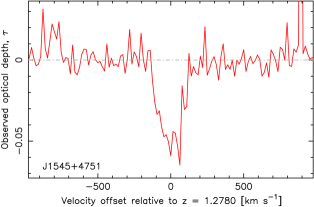
The deepest feature has a redshift of , which is redshifted by 65 from the mean-weighted value of , which itself is redshifted by 134 from the reference optical value of (Vermeulen & Taylor, 1995). The feature spans 280 , with a full-width half maximum of FWHM , giving an integrated optical depth of . This yields a column density of , which for a modest K (cf. the lowest K yet found, Curran et al. 2007), qualifies this as a damped Lyman- absorber. The highest column density of both the SDSS DR5 and DR7 DLAs is (Prochaska et al. 2008; Noterdaeme et al. 2009, respectively), which the new detection attains for K, well below the mean value of K (Curran, 2012).
3.2 Properties of the sample affecting the detection of 21-cm
3.2.1 Sensitivity limits
In Fig. 5 (top panel) we show the line strength of the detection and the limits for the eight non-detections, in context of the previous searches. From this we see that approximately half of our non-detections have been searched to reasonable limits, i.e. K-1 and so these are sensitive to the majority of the 21-cm detections.
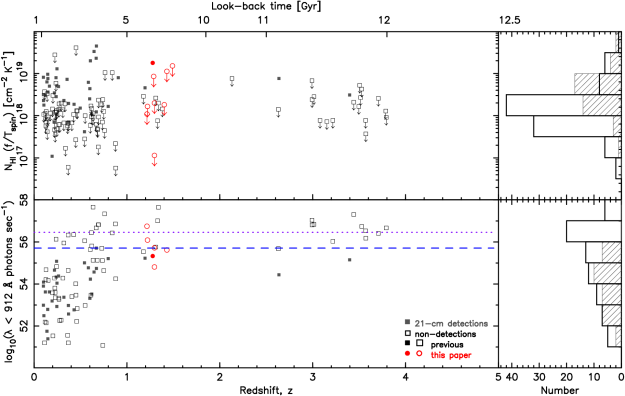
One out of nine targets is a detection rate of only %, although considering that three (0220–349, 0400–319 & J1409–2657) have limits to only , one out of six (a rate of %) could be more appropriate. This is, however, still low in comparison to the % generally found at W Hz-1 (Curran & Whiting, 2010), this rate arising from the likelihood of the large-scale gas disk being orientated so that it intercepts our line-of-sight to the AGN. We discuss the possible reasons for this low detection rate here.
3.2.2 Ionisation of the neutral gas
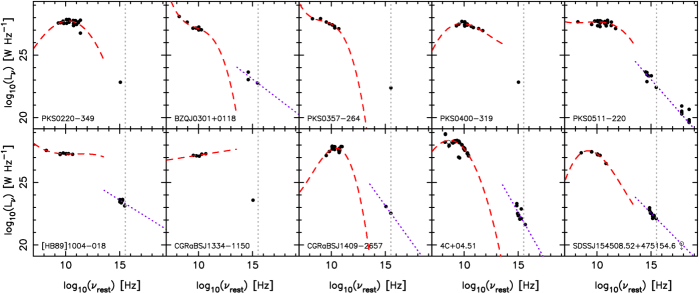
Although there is an apparent critical luminosity of W Hz-1 above which 21-cm has never been detected (Curran et al., 2008; Curran & Whiting, 2012), the gas is ionised by all photons of wavelength Å. We are therefore interested in the total ionising luminosity, , where Hz, which we derive from the SED fits to the photometry (Fig. 6).666See Curran et al. (2012) for a detailed description of the polynomial fits to the SEDs.
Dividing the total ionising luminosity by the Planck constant, i.e. , gives the ionising photon rate (Osterbrock, 1989), which we show in Fig. 5 (bottom panel) and summarise in Table 2. From this, we see that the 21-cm detection (J1545+4751) arises in the second least luminous source (the faintest being 4C +04.51, which also has the strongest limit, Table 1).
Note that these are two of only three sources below s-1, the highest photon rate at which there has been a 21-cm detection (in 3C 216, Vermeulen et al. 2003), the third being J1409–2657 which has been searched to a poor limit [allowing ]. Of the remaining six targets, three are above s-1 and photon rates cannot be determined for the other three (Fig. 6), although all but one of the six for which photon rates could be determined are below the critical value of s-1 (estimated from the critical observed luminosity of W Hz-1 and the composite UV spectral index of the sources above this luminosity, Curran & Whiting 2012). If we exclude J1409–2657 on the basis of its poor limit, applying s-1 as the cut-off gives a % detection rate and s-1 a 25% rate, below the cut-off. Both are close to the expected for W Hz-1 sources. Given that a photon rate could not be determined for J1334–1150, although this has been searched to , our detection rate could be lower (see Sect. 3.2.5 for further discussion).
3.2.3 Coverage of the background flux as traced through radio properties
From the above, it is possible that the detection rate is as high as 50%, if the highest photon rate at which 21-cm has been detected is close to the critical value at : The value of s-1 is sufficient to ionise all of the neutral gas in a large spiral (Curran & Whiting, 2012) and so any evolution in galactic morphology with redshift, where there is a larger fraction of smaller galaxies at large look-back times, could lower this critical value (Curran et al., 2012). That is, since our targets are at look-back times which are at approximately half the age of the Universe (Fig. 5), a lower critical value may be applicable.
Nevertheless, Curran et al. (2012) cannot rule out steep radio spectra, indicating extended sources, as a cause of their exclusive non-detections at . This motivated the preference for SEDs which exhibit a clear turnover for this survey. To verify that our targets fulfil this requirement, as described in Curran et al. (2012), we fit a third order polynomial to the Hz photometry in order to obtain a radio SED (Fig. 6), from which we obtain the turnover frequency and a spectral index (Table 2).
| Source | [GHz] | [W Hz-1] | rate [s-1] | |
| 0220–349 | 17 | 0.51 | — | — |
| J0301+0118 | ||||
| 0357–264 | — | — | ||
| 0400–319 | 5.9 | 0.30 | — | — |
| 0511–220 | 8.5 | 0.06 | ||
| 1004–018 | ||||
| J1334–1150 | — | — | — | |
| J1409–2657 | 28 | 1.13 | ||
| 4C +04.51 | 0.45 | |||
| J1545+4751 | 0.89 |
From this, we see that six of the targets have clear turnover frequencies in the observed bands, of which the detection is one, this also having the second flattest spectral index. For the previous survey (Curran et al., 2012), the mean turnover frequency was GHz (cf. GHz for the 21-cm detections) and the spectral index (cf. for the detections). As required, our targets generally have higher turnovers ( GHz for all and 1.6 GHz for those with limits of ) and flatter spectra ( for all and for those with limits of ). This indicates that these are more compact sources (Fanti et al., 1990) and so should generally cover the background emission at least as effectively as those previously detected in 21-cm.
Lastly, it is interesting to note that, from VLBA observations, the detected source is known to be very compact – 13.3 mas at 5 GHz (Helmboldt et al., 2007). This corresponds to a linear size of just 112 pc at . 5 GHz is 11 GHz in the rest-frame and assuming that the source is an order of magnitude larger at 1 GHz, means that an absorber of diameter kpc would be sufficient to intercept all of the emission. Unfortunately, high resolution radio maps are not available for the other targets, due in part to the selection of a large proportion of southern sources.
3.2.4 Excitation of the gas by radio emission
As well as being below the critical photon rate and having radio SEDs indicative of a compact radio source, we note that the detection has the lowest radio continuum luminosity of the sample ( W Hz-1 at 1.4 GHz, Fig. 6). As well as ionisation of the gas, excitation to the upper hyperfine level by cm photons, raising the spin temperature of the gas (Purcell & Field, 1956), may also cause the gas to be undetectable in 21-cm absorption. Unlike the Å continuum luminosity, Curran et al. (2008) found no correlation between the cm continuum luminosity and the incidence of detection, although, as with the former (Sect. 3.2.2), the monochromatic luminosity does not give the full picture.
Therefore, in Fig. 7 we show the radio power, , where MHz and GHz777Ideally, but we have restricted this to Hz, up to which we believe the radio SED fits to be accurate (Curran et al., 2012). For the sources which do exhibit reasonable polynomial fits to the SEDs, Hz photometries make very little contribution to the power., for all of the sources searched in 21-cm absorption.
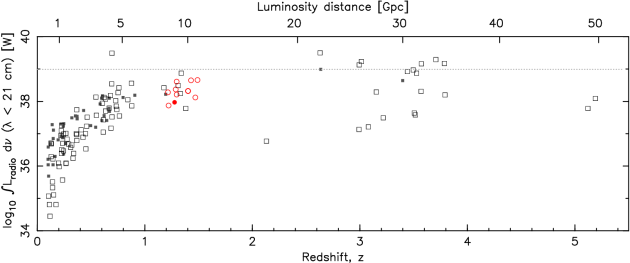
From this, we see that while the radio power for J1545+475 is low compared to the rest of our targets, it is higher than some of the sources. In fact, most of these high redshift non-detections have radio powers below W, the highest value for a 21-cm detection, indicating that excitation to the upper hyperfine level by cm photons cannot account for the non-detections at high redshift. Given the 33% detection rate (40 out of 121) at W, the binomial probability of zero detections out of eight at W is 0.041, which is significant at only , assuming Gaussian statistics. By comparison, the significance is for the ionising photon rate (Curran & Whiting, 2012).
3.2.5 Redshifts
Another possible reason for the non-detection of 21-cm absorption, in at least some of the targets, is inaccurate optical redshifts, since in trawling the 24 000 entries of the suitable radio catalogues (Sect. 1.2), the optical spectra were not checked. As seen from Fig. 3, we achieve a range of which is large compared with any expected statistical error in the optical redshifts. Of greater concern, is incorrectly classified spectral lines or noise in the spectra misidentified as real emission lines resulting in spurious redshifts. A literature search revealed six of the ten sources had published optical spectra and we checked the reliability of the redshifts of these objects. One source, J1409–2657, had an incorrect published redshift of while the spectrum had high signal-to-noise ratio emission lines clearly indicating a redshift of . Two other objects, 0220–349 and 0357–264, were deemed to have redshifts of marginal reliability, given the low signal-to-noise of the emission lines used in the classification. The remaining three sources had a clear set of emission lines confirming the published redshift values.
In order to account for all the possible factors leading to a non-detection, in Table 3 we flag the unreliable redshifts as incorrect (x)888Where the spectrum is not published, we assume the derived redshift to be correct. For instance, Vermeulen & Taylor (1995) quote for J1545+4751.,
| Source | Redshift | Ref. | Rate | Det. | |||
|---|---|---|---|---|---|---|---|
| 0220–349 | 1.49 | D97 | x | x | – | ✓ | N |
| J0301+0118 | 1.221 | J02 | – | ✓ | ✓ | x | N |
| 0357–264 | 1.47 | D97 | x | x | – | x | N |
| 0400–319 | 1.288 | D97 | ✓ | x | – | ✓ | N |
| 0511–220 | 1.296 | S89 | ✓ | ✓ | ✓ | ✓ | Y |
| 1004–018 | 1.2154 | C04 | ✓ | ✓ | x | x | N |
| J1334–1150 | 1.402 | J02 | – | ✓ | – | x | N |
| J1409–2657 | 1.43 | D97 | ✓ | x | ✓ | ✓ | N |
| 4C +04.51 | 1.996 | H91 | – | ✓ | ✓ | ✓ | Y |
| J1545+4751 | 1.277 | V95 | – | ✓ | ✓ | ✓ | Y |
as well as flagging other conditions not favourable for a detection – a poor sensitivity limit (Sect. 3.2.1), an ionising photon rate above the critical value (Sect. 3.2.2) and the absence of a detected turnover in the SED, suggesting a low covering factor (Sect. 3.2.3). That is, a full row of ticks (✓), from ‘’ on, is required for a possible detection (Y), whereas only one cross (x) is required to rule out the possibility (N). Summarising our targets thus, of the ten sources searched, we obtain only three in which the detection of 21-cm is feasible.999Note that each of the sources for which the ionising photon rate is not known falls down by at least one x, thus allowing us to rule out the possibility of a detection even if the ionising flux were below the critical value. One of these is the detection, J1545+4751, which therefore gives a % detection rate. Given the small numbers, this is close to the rate expected at W Hz-1 (Curran & Whiting, 2010).
4 Conclusions
In the third in a series of surveys (following Curran et al. 2011b, 2012) for redshifted H i 21-cm in the hosts of radio galaxies and quasars, we have searched ten, mostly flat spectrum, objects at redshifts of . This corresponds to look-back times of Gyr, which is a range relatively unprobed by previous surveys for associated H i 21-cm. This has resulted in one detection, which at , after 4C +05.19 (, Moore et al. 1999) and B2 0902+34 (, Uson et al. 1991), is the third highest redshift detection of associated 21-cm absorption.
Of the remaining sources searched, one was completely lost to RFI, with another three being severely compromised (giving poor limits). After quantifying other pitfalls, which could prevent a detection, we estimate a detection rate of 30%. Although uncertain, this is consistent with the 40% rate generally found for those below the critical value (or luminosities of W Hz-1). This is in contrast to our previous survey of sources, for which there were no detections. These sources did, however, have much steeper spectra than the current sample, which may suggest that ineffective coverage of the background emission could have contributed to the zero detection rate.
Despite our deliberate selection of optically faint sources, the one detection highlights the difficulties in searching for highly redshifted associated 21-cm absorption, where the selection of the necessarily faint objects introduces a bias towards objects for which the optical redshifts are poorly determined. Furthermore, by probing these look-back times evolution in galactic morphologies may be an issue, where there is a larger fraction of smaller galaxies at high redshift (Baker et al., 2000; Lanfranchi & Friaça, 2003). For these the critical luminosity will be correspondingly lower (Curran & Whiting, 2012), requiring the selection of even fainter optical sources in order to detect associated 21-cm absorption. Thus, through their wide fields-of-view and bandwidths, making them unreliant on optical redshifts, the next generation of radio telescopes (the Square Kilometre Array and its pathfinders) will be ideal in finding the neutral gas currently missing in the hosts of high redshift radio sources.
Acknowledgements
We thank the staff of the GMRT who have made these observations possible. The GMRT is run by the National Centre for Radio Astrophysics of the Tata Institute of Fundamental Research This research has made use of the NASA/IPAC Extragalactic Database (NED) which is operated by the Jet Propulsion Laboratory, California Institute of Technology, under contract with the National Aeronautics and Space Administration. This research has also made use of NASA’s Astrophysics Data System Bibliographic Services. The Centre for All-sky Astrophysics is an Australian Research Council Centre of Excellence, funded by grant CE110001020.
References
- Allison et al. (2012) Allison J. R., et al., 2012, MNRAS, 423, 2601
- Baker et al. (2000) Baker A. C., Mathlin G. P., Churches D. K., Edmunds M. G., 2000, in Favata F., Kaas A., Wilson A., eds, Star Formation from the Small to the Large Scale, Vol.45 of ESA SP ESA Special Publication, The Chemical Evolution of the Universe. Noordwijk, p. 21
- Catinella et al. (2008) Catinella B., Haynes M. P., Giovanelli R., Gardner J. P., Connolly A. J., 2008, ApJ, 685, L13
- Croom et al. (2004) Croom S. M., Smith R. J., Boyle B. J., Shanks T., Miller L., Outram P. J., Loaring N. S., 2004, MNRAS, 349, 1397
- Curran (2010) Curran S. J., 2010, MNRAS, 402, 2657
- Curran (2012) Curran S. J., 2012, ApJ, 748, L18
- Curran et al. (2007) Curran S. J., Tzanavaris P., Murphy M. T., Webb J. K., Pihlström Y. M., 2007, MNRAS, 381, L6
- Curran et al. (2002) Curran S. J., Webb J. K., Murphy M. T., Bandiera R., Corbelli E., Flambaum V. V., 2002, PASA, 19, 455
- Curran & Whiting (2010) Curran S. J., Whiting M. T., 2010, ApJ, 712, 303
- Curran & Whiting (2012) Curran S. J., Whiting M. T., 2012, ApJ, 759, 117
- Curran et al. (2011a) Curran S. J., Whiting M. T., Murphy M. T., Webb J. K., Bignell C., Polatidis A. G., Wiklind T., Francis P., Langston G., 2011a, MNRAS, 413, 1165
- Curran et al. (2012) Curran S. J., Whiting M. T., Sadler E. M., Bignell C., 2012, MNRAS, in press (arXiv:1210.1886)
- Curran et al. (2009) Curran S. J., Whiting M. T., Webb J. K., 2009, Proceedings of Science, 89, Chap. 11
- Curran et al. (2011b) Curran S. J., Whiting M. T., Webb J. K., Athreya A., 2011b, MNRAS, 414, L26
- Curran et al. (2008) Curran S. J., Whiting M. T., Wiklind T., Webb J. K., Murphy M. T., Purcell C. R., 2008, MNRAS, 391, 765
- Drinkwater et al. (1997) Drinkwater M. J., Webster R. L., Francis P. J., Condon J. J., Ellison S. L., Jauncey D. L., Lovell J., Peterson B. A., Savage A., 1997, MNRAS, 284, 85
- Fanti et al. (1990) Fanti R., Fanti C., Schilizzi R. T., Spencer R. E., Nan Rendong Parma P., van Breugel W. J. M., Venturi T., 1990, A&A, 231, 333
- Grasha & Darling (2011) Grasha K., Darling J., 2011, in American Astronomical Society Meeting Abstracts Vol. 43, A Search for Intrinsic HI 21-cm Absorption Toward Compact Radio Sources. p. 345.02
- Gupta et al. (2006) Gupta N., Salter C. J., Saikia D. J., Ghosh T., Jeyakumar S., 2006, MNRAS, 373, 972
- Gupta et al. (2012) Gupta N., Srianand R., Petitjean P., Bergeron J., Noterdaeme P., Muzahid S., 2012, A&A, 544
- Heckman et al. (1994) Heckman T. M., O’Dea C. P., Baum S. A., Laurikainen E., 1994, ApJ, 428, 65
- Helmboldt et al. (2007) Helmboldt J. F., et al., 2007, ApJ, 658, 203
- Jackson et al. (2002) Jackson C. A., Wall J. V., Shaver P. A., Kellermann K. I., Hook I. M., Hawkins M. R. S., 2002, A&A, 386, 97
- Lanfranchi & Friaça (2003) Lanfranchi G. A., Friaça A. C. S., 2003, MNRAS, 343, 481
- Machalski (1998) Machalski J., 1998, A&AS, 128, 153
- Moore et al. (1999) Moore C. B., Carilli C. L., Menten K. M., 1999, ApJ, 510, L87
- Noterdaeme et al. (2009) Noterdaeme P., Petitjean P., Ledoux C., Srianand R., 2009, A&A, 505, 1087
- Osterbrock (1989) Osterbrock D. E., 1989, Astrophysics of Gaseous Nebulae and Active Galactic Nuclei. University Science Books, Mill Valley, California
- Page et al. (2012) Page M. J., et al., 2012, Nature, 485, 213
- Prochaska et al. (2008) Prochaska J. X., Hennawi J. F., Herbert-Fort S., 2008, ApJ, 675, 1002
- Purcell & Field (1956) Purcell E. M., Field G. B., 1956, ApJ, 124, 542
- Rao et al. (2006) Rao S., Turnshek D., Nestor D. B., 2006, ApJ, 636, 610
- Stickel et al. (1989) Stickel M., Fried J. W., Kühr H., 1989, A&AS, 80, 103
- Stickel & Kühr (1996) Stickel M., Kühr H., 1996, A&AS, 115, 11
- Taylor et al. (1994) Taylor G. B., Vermeulen R. C., Pearson T. J., Readhead A. C. S., Henstock D. R., Browne I. W. A., Wilkinson P. N., 1994, ApJS, 95, 345
- Uson et al. (1991) Uson J. M., Bagri D. S., Cornwell T. J., 1991, PhRvL, 67, 3328
- Vermeulen et al. (2003) Vermeulen R. C., et al., 2003, A&A, 404, 861
- Vermeulen & Taylor (1995) Vermeulen R. C., Taylor G. B., 1995, AJ, 109, 1983
- Wall & Peacock (1985) Wall J. V., Peacock J. A., 1985, MNRAS, 216, 173
- White (1992) White G. L., 1992, PASA, 10, 140