Full coherent frequency conversion between two microwave propagating modes
Abstract
We demonstrate full frequency conversion in the microwave domain using a Josephson three-wave mixing device pumped at the difference between the frequencies of its fundamental eigenmodes. By measuring the signal output as a function of the intensity and phase of the three input signal, idler and pump tones, we show that the device functions as a controllable three-wave beam-splitter/combiner for propagating microwave modes, in accordance with theory. Losses at the full conversion point are found to be less than . Potential applications of the device include quantum information transduction and realization of an ultra-sensitive interferometer with controllable feedback.
pacs:
42.65.Ky, 42.25.Hz, 85.25.Cp, 42.79.Fm, 85.25.-jA quantum information transducer capable of converting the frequency of a quantum signal without introducing noise is one of the desirable modules in quantum communication Painter ; OptoToMwLehnert . With such a device, one could teleport quantum superpositions of ground and excited states of qubits from one system to another one with a different transition frequency, without loss of coherence. If a quantum signal can be routed through different frequency channels, optimization of quantum calculation and communication can be advantageously separated.
The simplest scheme for performing frequency conversion is pumping a dispersive medium with nonlinearity at precisely the frequency difference between the input and output frequencies ObservQFC ; VisibleZaske ; Ates ; QuantumRakher ; PolarizationRamelow ; QSJAumentado ; QIJAumentado ; Sipe . Such nonlinear process known as parametric frequency conversion holds the promise of converting the frequency in a unitary, therefore noiseless, manner, namely, without adding loss or dephasing to the processed signal TuckerPEC . In practice however, conversion in the optical domain can be unitary only in the limit of very small converted portion of the input signal. This is due to conversion losses associated with the nonlinear wave mixing process, such as finite interaction lengths and imperfect phase-matching. Similarly, resistive elements used in mixers in the microwave domain, such as Schottky diodes inevitably lead to inacceptable conversion losses. This raises the question as to whether a unitary full conversion of an input signal can be realized practically.
In this work, we show that such noiseless full conversion is possible in the microwave domain by operating a dissipationless three-wave mixing element known as the Josephson parametric converter (JPC) JPCnature ; Jamp ; JRCAreview , in a regime of conversion without photon gain. The JPC performs frequency conversion from to with losses below 0.05 dB at full conversion, as opposed to a typical loss of dB in microwave mixers. We reveal the unitary nature of the JPC conversion by utilizing wave interference between the three incommensurate frequencies intervening the device. The coherence of the conversion process is thus verified without having to face the challenge of calibrating the transmission between different input and output lines of disparate frequencies.
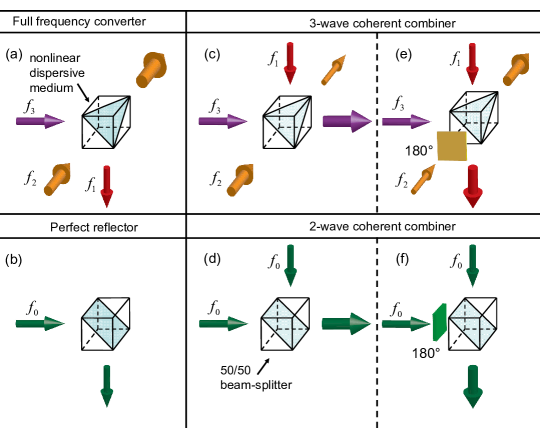
To introduce the requirements obeyed by the properties of unitary frequency conversion, we compare, in Fig. 1, a 3-wave coherent converter and a 2-wave coherent beam-splitter. Panel (a) depicts the desired case of unitary full frequency conversion of an incident propagating beam, i.e. a violet (high frequency) to a red (low frequency) beam, obtained by pumping a dispersive medium with a yellow beam whose frequency is precisely the frequency difference. In panel (b) we depict the 2-wave analogue of such a device, that is the total reflector (mirror) whose input and output beams have the same frequency and magnitude but propagate in different directions. Panels (c) and (e) depict the same 3-wave coherent converter shown in panel (a), now operated at the 50/50 beam-splitting point. At this point, half of the power of input beams (red and violet) is transmitted while the other half undergoes frequency conversion, again using the third yellow beam. As can be seen in panels (c) and (e), either destructive or constructive 3-wave interference can appear at the output ports of the device depending on the relative phases of the two equal coherent incident red and violet beams. More specifically, panel (c) (panel (e)) describes a destructive interference scenario for the output red (violet) beam. Panels (c) and (e) also indicate the notions that, (1) the output beams of such a device depend on the phases of all incident coherent beams, (2) in order for a lossless destructive interference to take place between two frequencies, the power must be entirely converted to a third frequency. For further clarification of the role of the relative phases, we also show in panels (d) and (f) the 2-wave analogues of the destructive interference scenarios shown in panels (c) and (e).
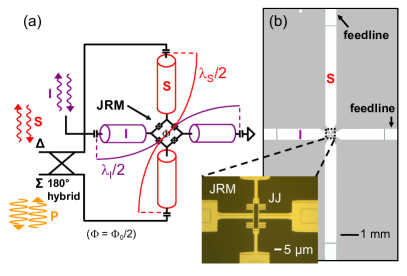
Akin to the conceptual 3-wave converter depicted in Fig. 1, the JPC is a non-degenerate device with spatial and temporal separation between the idler and signal modes. Its input and output fields share however the same spatial port as shown in Fig. 2 (a) and must therefore be separated using a circulator. The idler and signal modes of the JPC are differential modes of the microstrip resonators of the device which intersect at a Josephson ring modulator (JRM) Jamp . An optical micrograph of the JRM, which consists of four Josephson junctions, is shown in Fig. 2 (b). The third mode supported by the device is a non-resonant common-mode drive (pump), whose frequency is set to either the sum of the idler and signal frequencies or their difference. In the case where the pump frequency is equal to the sum , the device serves as a quantum-limited amplifier which can be used to readout the state of a solid state qubit in real time as has been demonstrated recently QuantumJumps ; QubitJPC . In the present case where the pump frequency verifies (), the device operates in the mode of frequency conversion with no photon gain. In this mode, as opposed to amplification JPCnature , the device is not required, according to Caves theorem Caves to add any noise. Note that this working regime has been recently the subject of several works in the areas of telecommunication and quantum information processing in optics VisibleZaske ; Ates ; QuantumRakher ; PhotonicInt ; IntTwoPhoton ; CPC . Also, in the recent work done at NIST QSJAumentado ; QIJAumentado , the authors parametrically converted photons of different frequencies inside a microwave resonator coupled to a dc-SQUID. Phonon-photon parametric frequency conversion is also at play in the active cooling of a micro- or nano- mechanical resonator modes Painter ; Teufel ; kippenberg . In our work, by contrast, it is photons from two different spatial and temporal modes that are interconverted.
When operated in conversion mode and under the stiff pump condition, the JPC can be described as an effective two-port beam-splitter whose scattering parameters can be adjusted by varying the pump tone of the device. In this mode of operation, part of the incoming wave at the idler (signal) port is transmitted to the signal (idler) port after being downconverted (upconverted), via emission (absorption) of pump photons, while the remaining part is reflected off the idler (signal) port.
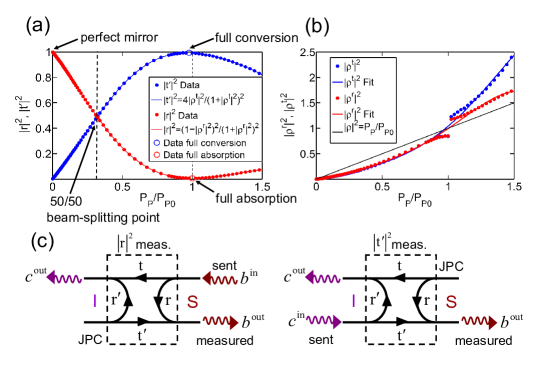
In Fig. 3 (a) we display measurements of the reflection parameter at the signal port (filled red circles) and the idler-to-signal conversion parameter (filled blue circles) as a function of the normalized applied pump power , where is the pump power at which is minimum. The frequency of the pump tone in both measurements is . In the reflection measurement, a coherent tone at is applied to the signal port with input power dBm, while in the conversion measurement a coherent tone at is applied to the idler port (see signal flow graphs of the JPC shown in panel (c)). Both measurements are taken using a spectrum analyzer centered at in zero frequency span mode. The output power measured as a function of is normalized relative to the reflected signal power obtained with no applied pump power. There, the JPC has unity reflection, which can be measured within dB accuracy due to a finite impedance mismatch in the output line.
As can be seen in Fig. 3, the splitting ratio between the converted and reflected portions of the beam is set by the device parameters and the pump amplitude. By varying the intensity of the pump, the splitting ratio of the device can be changed continuously from zero conversion and total reflection, to complete conversion and perfect absorption (full converter). It is important to point out that the input power applied to the idler port in the conversion measurement is set to yield, at the beam-splitting working point, the same signal output power as the one measured in reflection for . It is remarkable that with this single calibration of input powers, which balances the output at the beam-splitting point, the device satisfies quite well the equation of conservation of total photon number () in the range . When the critical power is traversed , we observe a progressive breaking of unitarity . This can be explained by increased nonlinear effects at elevated pump powers, resulting in frequency conversion to higher modes of the system. However, we find that in the vicinity of , the conversion loss, defined as the deviation of from unity, to be less than within accuracy. We also observe a slight shift in power between the peak of the conversion and the minimum of the reflection data (indicated by empty circles). The solid blue and red curves drawn using the equations shown in the legend of Fig. 3 (a), correspond to theory expressions to the conversion and reflection data respectively (see section III in the supplementary material). In panel (b) we plot, using filled red and blue circles, the dimensionless pump power parameters and , which are used to fit the reflection and conversion data as a function of . The solid black line satisfying the relation , corresponds to the expected dependence of on for the ideal JPC model with stiff pump approximation. The solid red and blue curves are fifth order polynomial fits to the and parameters. The fits satisfy three important properties: (1) they pass through the origin ( for ), (2) they have a leading linear term in the limit of small pump powers (), (3) the fits for and coincide for .
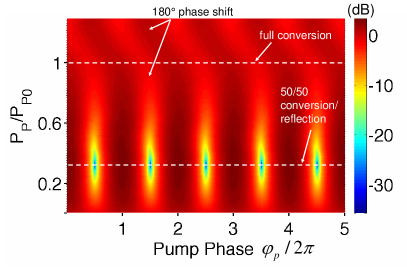
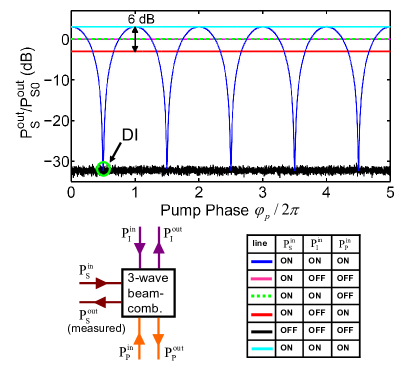
In addition to the device dependence on pump power shown in Fig. 3, the relative pump phase plays an important role as well. The downconverted idler and the upconverted signal acquire a phase shift which depends on the pump phase. We utilize this phase dependence as shown in Fig. 4 in order to sensitively interfere signal and idler beams. In this measurement, we applied two coherent tones to the signal and idler ports, having the same frequencies and powers as in the measurement of Fig. 3. We have also phase-locked the three independent coherent waves to the reference oscillator of a rubidium atomic clock. The color mesh in Fig. 4 depicts the interference fringes of the reflected and converted signals generated at the signal port as a function of and the relative pump phase. As can be seen in the figure, the interference contrast is low for which correspond to almost total reflection. Similarly, the contrast is low for close to unity which correspond to almost total conversion. A maximum interference contrast is obtained on the other hand for close to . We interpret this point as that where our device functions as a / beam-splitter/combiner. This is further shown in Fig. 5, where we display a cross-section of Fig. 4 at the point of maximum interference contrast. The wave interference modulation curve, shown in blue, is plotted as a function of the relative phase of the pump. The other colored lines represent different reference measurements taken under the same experimental conditions. The magenta line corresponds to the reflected signal power obtained without pump or idler tones and forms the reference level for the other measured powers. The dashed green line corresponds to the reflected signal power obtained with no pump but with an equivalent idler tone injected through the idler port. The fact that the dashed green line coincides with the magenta line shows that without pump the idler and signal modes are isolated. The red line represents the reflected signal power at the / beam-splitting working point and it lies dB below the signal reference line (magenta) as expected. The cyan line corresponds to a maximum constructive interference of the reflected signal and the converted idler, obtained for a certain pump phase. As expected in this constructive interference condition, the relative power level is dB (a factor of ) above the red line obtained without idler. The black line corresponds to the noise floor measured without any signal. This noise is dominated by the high electron mobility transistor (HEMT) amplifier noise connected at the stage of our setup. Note that the minimum points of the wave interference curve (blue) correspond to destructive interference (DI) condition and coincide with the HEMT noise floor. By calculating the ratio of the average output power received in a destructive interference experiment to the average power received in a constructive interference experiment, as discussed in section IV in the supplementary material, we get a lower bound (defined for the absolute value) of dB on the amount of destructive interference achieved by the device at the beam-splitting point. This is equivalent to a coherent cancellation of of input signal and idler beams.
Furthermore, in a separate interference measurement in which we varied the input power of the signal and idler beams (see supplementary material), we find that the maximum input power which can be handled by the device is about dBm. Similar to Josephson amplifiers based on the JPC, this figure of merit can be improved by about one order of magnitude, by increasing the critical current of the junctions as discussed in Refs. Jamp ; JRCAreview . We also note that the bandwidth of the present device () is limited by the bandwidths of the resonators. A wider bandwidth, on the order of , could potentially be achieved by substituting the present JRM design with an inductively shunted ring Roch .
In addition to quantum information transduction, the device has several potential useful applications, such as cooling of a readout cavity of a qubit by swapping the “hot” cavity photons, for instance at , by “cold” reservoir photons at , and realization of a Mach-Zehnder interferometer (MZI) scheme for microwaves with real-time feedback. In the latter scheme, the device would function as an interferometric beam-combiner for incoming idler and signal waves. Assuming, for example, the information is carried by the phase of the signal in the MZI setup, while the idler wave serves as a reference, the information can be decoded from the incoming signal by measuring the generated interference at the signal port. Moreover, the setpoint of the device, which yields maximum phase sensitivity, can be maintained in-situ by compensating the shift using the pump phase.
Discussions with R. J. Schoelkopf and P. T. Rakich are gratefully acknowledged. The assistance of Michael Power in the fabrication process is highly appreciated. This research was supported by the NSF under grants DMR-1006060 and DMR-0653377; ECCS-1068642, the NSA through ARO Grant No. W911NF-09-1-0514, IARPA under ARO Contract No. W911NF-09-1-0369, the Keck foundation, and Agence Nationale pour la Recherche under grant ANR07-CEXC-003. M.H.D. acknowledges partial support from College de France.
References
- (1) A. H. Safavi-Naeini and O. Painter, New J. Phys. 13, 013017 (2011).
- (2) C. A. Regal and K. W. Lehnert, J. Phys. Conf. Ser. 264, 012025 (2011).
- (3) J. Huang and P. Kumar, Phys. Rev. Lett. 68, 2153 (1992).
- (4) S. Zaske et al., Phys. Rev. Lett. 109, 147404 (2012).
- (5) S. Ates et al., Phys. Rev. Lett. 109, 147405 (2012).
- (6) M. T. Rakher, L. Ma, O. Slattery, X. Tang, and K. Srinivasan, Nature Photon. 4, 786 (2010).
- (7) S. Ramelow et al., Phys. Rev. A 85, 013845 (2012).
- (8) E. Zakka-Bajjani et al., Nature Phys. 7, 599 (2011).
- (9) F. Nguyen, E. Zakka-Bajjani, R. W. Simmonds, and J. Aumentado, Phys. Rev. Lett. 108, 163602 (2012).
- (10) L. G. Helt, M. Liscidini, and J. E. Sipe, J. Opt. Soc. Am. B 29, 2199 (2012).
- (11) J. Tucker and D. F. Walls, Ann. Phys. 52, 1 (1969).
- (12) N. Bergeal et al., Nature 465, 64 (2010).
- (13) B. Abdo et al., Appl. Phys.Lett. 99, 162506 (2011).
- (14) B. Abdo, A. Kamal, M. H. Devoret, arXiv:1208.3142v1.
- (15) R. Vijay, D. H. Slichter, and I. Siddiqi, Phys. Rev. Lett. 106, 110502 (2011).
- (16) M. Hatridge et al., to appear in Science.
- (17) C. M. Caves, Phys. Rev. D 26, 1817-1839 (1982).
- (18) S. Tanzilli et al., Nature 437, 116 (2005).
- (19) M. G. Raymer, S. J. van Enk, C. J., McKinstrie, and H. J. McGuinness, Opt. Commun. 283, 747 (2010).
- (20) N. K. Langford et al., Nature 478, 360 (2011).
- (21) J. D. Teufel et al., Nature 475, 359 (2011).
- (22) R. Rivière et al., Phy. Rev. A 83, 063835 (2011).
- (23) N. Roch et al., Phys. Rev. Lett. 108, 147701 (2012).