THE GREEN BANK TELESCOPE HII REGION DISCOVERY SURVEY: IV. HELIUM AND CARBON RECOMBINATION LINES
Abstract
The Green Bank Telescope H II Region Discovery Survey (GBT HRDS) found hundreds of previously unknown Galactic regions of massive star formation by detecting hydrogen radio recombination line (RRL) emission from candidate H II region targets. Since the HRDS nebulae lie at large distances from the Sun, they are located in previously unprobed zones of the Galactic disk. Here we derive the properties of helium and carbon RRL emission from HRDS nebulae. Our target sample is the subset of the HRDS that has visible helium or carbon RRLs. This criterion gives a total of 84 velocity components (14% of the HRDS) with helium emission and 52 (9%) with carbon emission. For our highest quality sources, the average abundance ratio by number, , is . This is the same ratio as that measured for the sample of previously known Galactic H II regions. Nebulae without detected helium emission give robust upper limits. There are 5 RRL emission components with less than 0.04 and another 12 with upper limits below this value. These H II regions must have either a very low abundance or contain a significant amount of neutral helium. The HRDS has 20 nebulae with carbon RRL emission but no helium emission at its sensitivity level. There is no correlation between the carbon RRL parameters and the 8 mid-infrared morphology of these nebulae.
1 Introduction
H II regions are among the brightest radio sources in the Milky Way at centimeter wavelengths. Within a molecular cloud, a massive newborn early-type star (O4–B9) or cluster of such stars emits extreme-ultraviolet (EUV: eV) photons that ionize hydrogen and helium in a surrounding zone around the stars. Beyond this fully ionized plasma, the H II region, is the photo-dissociation region (PDR, sometimes also referred to as a “photon dominated region”) where less energetic photons can dissociate most molecules and ionize atoms with ionization potentials below 13.6 eV, such as carbon (11.3 eV), silicon (8.2 eV), and sulfur (10.4 eV). The PDR acts as a boundary between the fully ionized H II region and the neutral molecular cloud surrounding it. Because the stars that create H II regions have lifetimes of 10 million years, they are zero age objects compared to the age of the Milky Way. H II regions thus reveal sites of current or recent massive star formation.
Galactic H II regions and their surrounding PDRs provide useful tools for studying the Milky Way. They trace the current structure of the Galaxy, reveal its chemical evolution history, and show the effect of star formation on the evolution of the interstellar medium (ISM). H II regions have been well studied at optical wavelengths, primarily because of the many bright collisionally excited lines (e.g., O III; Burke et al., 1989; Crawford et al., 2000), and optical recombination lines (ORLs) (e.g., Peimbert & Torres-Peimbert, 1974) that are available. Optical studies are limited by dust extinction, so they only probe a small fraction of the Galactic disk.
Radio recombination lines (RRLs), however, are nearly extinction free tracers of Galactic H II regions. Because the Milky Way ISM is optically thin at centimeter wavelengths, RRL emission can be detected from nebulae located throughout the Galactic disk. RRL spectra of H II regions give the velocity which can be used to derive kinematic distances to the nebulae (e.g., Anderson et al., 2012). With known distances many nebular physical properties can be determined. Distances are needed, for example, to study the H II region luminosity function and to trace Galactic structure (Downes et al., 1980; Anderson & Bania, 2009). Furthermore, when combined with measurements of the thermal free-free continuum emission from the H II region, the nebular electron temperature, , can be derived from the line-to-continuum ratio. The H II region is a proxy for the nebular metallicity and can be used to constrain chemical evolution models for the Milky Way (Wink et al., 1983; Shaver et al., 1983; Quireza et al., 2006b; Balser et al., 2011).
Some H II regions show RRL emission from heavier elements with ionization potentials lower than that of hydrogen, such as carbon. This emission comes from the PDR surrounding the H II region where the gas is denser and cooler (Hollenbach & Tielens, 1999). Carbon RRL measurements can help constrain the physical properties of the PDR. They provide information about the PDR kinematics which, when combined with H II region and molecular cloud velocities, provides insight into the dynamics of regions forming massive stars (Roshi et al., 2005). By combining observations of carbon RRL and 158 µm C II emission, the PDR density and temperature can be derived (Natta et al., 1994). Finally, Roshi (2007) suggested that the non-thermal carbon RRL line width is caused by magnetic turbulence and is a measure of the magnetic field strength of the PDR.
The Green Bank Telescope H II Region Discovery Survey (hereafter GBT HRDS) discovered hundreds of previously unknown Galactic H II regions by detecting RRL emission from these nebulae with the GBT at X-band (9 , 3 ). Some HRDS spectra had emission components at several different LSR velocities. Altogether, the HRDS detected 603 hydrogen RRLs from 448 H II regions. These nebulae are located in the zone . The HRDS census doubled the number of known H II regions in this part of the Galaxy. Bania et al. (2010, hereafter Paper I) described the GBT HRDS survey. Anderson et al. (2011, hereafter Paper II) gave the GBT HRDS methodology and provided the HRDS source catalog. Anderson et al. (2012, hereafter Paper III) derived kinematic distances to a large fraction of the GBT HRDS sample.
Here we derive the helium and carbon RRL properties for a subset of the HRDS nebulae. We choose the sample targets based on a visual inspection of the HRDS spectra (Section 2). We then fit Gaussians to the helium and carbon emission to determine the best fit line parameters in Section 3. We discuss these results in Section 4 where we compare the helium RRL properties of HRDS nebulae with the general population of Galactic H II regions in Section 4.1 and their carbon RRL properties with the population of Galactic PDRs in Section 4.2. We identify 20 nebulae where carbon RRL emission is detected in the absence of helium emission and in Section 4.3 find that no carbon RRL property seems to be related to the nebular PDR morphology seen in 8 images. Using the HRDS helium recombination line parameters, we derive in Section 4.4 the abundance by number, , and find a slight increase in as a function of Galactocentric radius. Finally, in Section 4.5 we use HRDS nebulae without detected helium emission to set upper limits and find that some H II regions have a very low abundance.
2 Sample Selection
Sensitive measurements of hydrogen, helium, and carbon RRL parameters are needed in order to derive accurate helium ionic abundance ratios and to characterize the properties of the carbon emission from the PDRs. Our targets need to be that subset of the HRDS nebulae with the most reliable helium and carbon detections. We make a visual inspection of the entire HRDS catalog and identify all sources with visible helium emission. Altogether, we identify 84 HRDS hydrogen RRL emission components that also have helium emission strong enough to derive accurate line parameters.
To ensure that our target sample is complete, we search the HRDS catalog automatically, seeking those nebulae that ought to show detectable helium emission based on the strength of the hydrogen RRL. For their sample of Galactic H II regions, Quireza et al. (2006a, hereafter QEAa) found the average ratio of He/H RRL intensities at 3 wavelength to be . Using this ratio together with the observed hydrogen RRL intensity, we can predict which HRDS nebulae should show helium RRL emission at the 2 intensity level if they are “typical” QEAa H II regions. Here, the 1 level is individually set by the rms spectral noise of each HRDS source. This 2 intensity criterion, combined with the constraint that the helium emission be found at the same velocity as that of the hydrogen RRL, identifies all targets in the HRDS that can possibly have helium RRL emission. These helium detection criteria identify a total of 163 sources. They find the same targets as the visual inspection does, together with an additional 79 nebulae that might show helium RRL emission at the 2 level. We find in Section 3 that none of these new targets has helium RRL emission that can be measured accurately. We use this sample of helium non-detections in Section 4.5 to derive upper limits on for these nebulae.
Our sample is thus comprised of 84 hydrogen RRL components that have helium RRL emission. This is 14% of the RRL velocity components listed in the HRDS catalog. Finally, we re-examine the HRDS catalog to identify any sources with visible carbon RRL emission that might be missed because our selection process is focused on the helium emission. Carbon RRL emission is seen in 52 targets (9% of HRDS) and there are 20 sources (3% of HRDS) with carbon emission but no detected helium line.
3 Radio Recombination Line Properties
To get the best possible hydrogen, helium, and carbon RRL parameters, we reanalyze the spectra from Paper II. The analysis in Paper II focused solely on getting accurate hydrogen RRL velocities. Those baseline models are not optimized for an accurate analysis of helium and carbon RRL parameters. Here we reanalyze all 163 targets we find using the automatic search. The first step is to fit a new baseline model for the spectra. We then fit a Gaussian function to the hydrogen line. If there are multiple or blended hydrogen lines, we iterate to get the best possible fit.
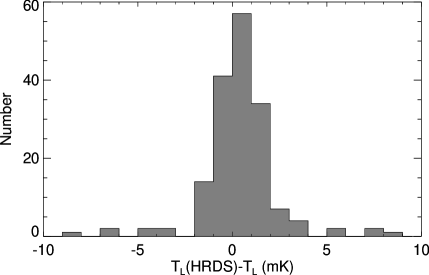
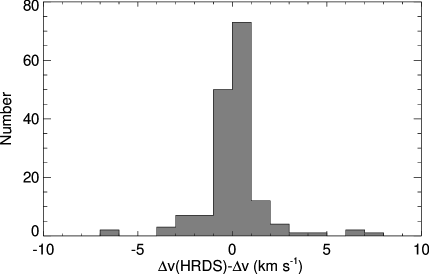
Overall, the new baseline models and fits to the hydrogen lines reproduce the original hydrogen RRL parameters in the HRDS catalog. Figure 1 shows histograms comparing this reanalysis with that of the HRDS for the sample of 163 targets. It makes this comparison for the hydrogen RRL LSR velocity (top), line intensity (middle), and FWHM line width (bottom). From these data we find the mean difference in the hydrogen line LSR velocity to be 0.1 with a dispersion 0.4 . The mean difference in line intensities is 0.4 with a dispersion of 2 . The FWHM line width difference is also small with a mean 0.1 and a dispersion 1.0 . These mean differences for the latter two quantities are both of their average values for HRDS nebulae (Paper II). Figure 1 is scaled for clarity. We thus omit a few outlier data points in these comparison plots: one each from the line velocity and intensity comparisons and seven from the FWHM line width comparison. Each outlier is a source with multiple hydrogen lines and had a poor fit in the original HRDS catalog.
Next, we attempt to fit for helium emission. We deem the helium fit to be a detection if the fitted intensity, , is greater than twice the spectral rms noise, , and the helium velocity matches that of the hydrogen RRL component. If there are multiple hydrogen lines then we also fit for multiple helium lines. We find 84 such helium RRL emission components in our sample of 163 candidates. These are, in fact, the components we identify from a visual inspection of the HRDS spectra. Figure 2 gives examples of typical RRL spectra and the Gaussian fits.
We give the hydrogen and helium line parameters for these 84 RRL components in Tables THE GREEN BANK TELESCOPE HII REGION DISCOVERY SURVEY: IV. HELIUM AND CARBON RECOMBINATION LINES and 2 Helium Radio Recombination Line Parameters, respectively. Source names with an appended letter, e.g. “G000.382+0.017a”, stem from the Paper II catalog and refer to a specific emission component in a nebular spectrum that has hydrogen RRLs at several different LSR velocities. Each table lists the intensity, , the full width at half-maximum (FWHM) line width, , the LSR velocity, , the fit uncertainties, e.g., , and the rms spectral noise in the baseline regions. The tables also contain a quality factor, QF, assigned by eye to each fit. The QF is a qualitative judgment of the goodness of the fit based on the accuracy of the baseline model, the rms spectral noise, and the presence of multiple or blended lines which are often difficult to fit. This is the same procedure as that used by QEAa and QEAb (see these papers for more details). Of the 84 hydrogen velocity components in our sample, we assign 82% as QF A, 12% as QF B, and 6% as QF C. For the helium fits, we rank 27% as QF A, 32% as QF B, and 40% as QF C. Once again, Figure 2 gives examples of typical spectra for each QF. Our highest quality QF A and B sources are the RRL components that should be used in any quantitative analysis.
Since carbon RRL emission comes from the PDR and not the H II region, we do not expect the carbon velocity to match that of the hydrogen and helium RRLs. This can lead to blending of the carbon and helium RRL emission. Therefore, before we fit a Gaussian function to the carbon emission, we subtract the helium emission from the spectrum using the best fit Gaussian parameters from Table 2 Helium Radio Recombination Line Parameters. As was shown by QEAa, this gives more accurate carbon line parameters. Table THE GREEN BANK TELESCOPE HII REGION DISCOVERY SURVEY: IV. HELIUM AND CARBON RECOMBINATION LINES lists the carbon fit parameters for the 52 emission components where a carbon line can be fit at the 2 level. It contains the same information as Tables THE GREEN BANK TELESCOPE HII REGION DISCOVERY SURVEY: IV. HELIUM AND CARBON RECOMBINATION LINES and 2 Helium Radio Recombination Line Parameters. Of the 52 carbon RRLs in our sample, we rank 42% as QF A, 40% as QF B, and 17% as QF C. Altogether, there are 20 nebulae that show carbon emission but no measurable helium emission and 19 are QF A or B. Figure 3 shows a subset of these sources which are discussed in Sections 4.2 and 4.3. Table THE GREEN BANK TELESCOPE HII REGION DISCOVERY SURVEY: IV. HELIUM AND CARBON RECOMBINATION LINES gives the hydrogen line parameters for these nebulae. We do not consider carbon upper limits in this analysis.
4 Discussion
4.1 HRDS Nebulae and the Population of Galactic H II Regions
Compared to the sample of previously known H II regions, the HRDS nebulae are, on average, farther from the Sun and, at 3 wavelength, are both smaller in angular size and have weaker RRL and continuum emission (Papers I, II, and III). Here we examine whether the RRL emission properties of HRDS nebulae are consistent with them being part of the general population of Galactic H II regions. We confirm, as one might expect, that the HRDS nebulae are typical Galactic H II regions.
Because the HRDS is the only RRL survey yet made with the GBT, some care must be taken when comparing the HRDS with other recombination line surveys. These used other telescopes that typically have larger beam sizes, lower gains (expressed as Kelvins of antenna temperature per Jansky [K ]), and, usually, poorer survey sensitivity (i.e. spectral rms). The most robust comparisons come from the observed ratios of RRL parameters and the line-to-continuum intensities because ratios minimize systematic effects caused by different telescopes and spectrometer systems. The most important such effect is that, because of their different X-band beam sizes, telescopes measure RRLs from varying volumes of ionized gas. Here we use ratios of RRL intensity and FWHM line width to compare the HRDS with previously known H II regions. Analyses of the HRDS nebular line-to-continuum ratios and the electron temperatures that can be derived from these data will be the subject of a future paper in this series (Balser, et al. 2013, in preparation).
Interpreting the ratios measured by different telescopes does require, however, that one assume co-spatial ionized zones and uniform properties throughout these volumes for all ionic species considered. Osterbrock (1989) showed that, for a abundance of 0.10, the helium and hydrogen Strömgren zones are co-spatial for all single stars with effective temperatures greater than 39,000 . These are stars of spectral type O8 V or earlier (Sternberg et al., 2003). The carbon RRL emission comes from the PDR and is clearly not co-spatial with the helium and hydrogen Strömgren zone. So, although carbon RRL parameter ratios may give some empirical insight when comparing different RRL surveys, they have no obvious astrophysical interpretation. That the RRL properties of all species are uniform throughout the nebular plasma is problematic as is the requirement that the plasma fills the beams of all the telescopes involved. Nonetheless, ratios of observed RRL parameters are the best available means of comparison.
We use the QEAa survey as a proxy for the properties of RRL emission from the general Galactic H II region population. This X-band survey was made with the NRAO 140 Foot telescope by members of the HRDS team. It is comprised of RRL spectra toward 119 directions for a sample of 106 H II regions. Together, the QEAa nebulae are the brightest H II regions in the Northern sky. With a typical rms spectral noise ranging between 2.5 and 8.75 , the QEAa survey had at the time the most sensitive RRL spectra ever made. With an X-band gain of 2 , however, the GBT is five times more sensitive than the 140 Foot (0.4 ) for point sources. The typical spectral rms for HRDS nebulae is 1 (Paper II). Furthermore, the 140 Foot’s X-band FWHM beam for the QEAa RRL spectra is ″, whereas for the GBT’s HRDS spectra it is ″. The QEAa RRL parameters are therefore derived from an area on the sky times larger than that sampled by the HRDS.
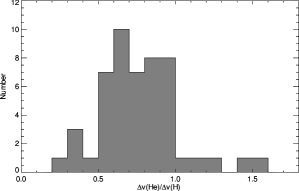
The RRL parameters of the helium and carbon emission detected in the HRDS are summarized in Tables 2 Helium Radio Recombination Line Parameters and THE GREEN BANK TELESCOPE HII REGION DISCOVERY SURVEY: IV. HELIUM AND CARBON RECOMBINATION LINES. Hereafter, we restrict our analyses to the highest quality emission components, QFs A and B, a sample that includes 54 helium and 43 carbon emission lines. We compare here these parameters to the best RRL measurements of QEAa (QFs A, B, and C in that paper). Figure 4 summarizes the helium RRL properties for this restricted sample. It plots the ratios of the helium and hydrogen RRL parameters: the relative line intensity, , as a function of relative FWHM line width, . Based on previous RRL studies of Galactic H II regions (QEAa is just one example), we would not expect a correlation between the RRL intensities and FWHM line widths. (The Lockman 1989 and Lockman et al. 1996 RRL surveys do show a weak correlation between very low intensities and wide line widths, but these line parameters are suspect due to spectral noise. They would be QF C sources, or upper limits, in the HRDS.) As expected, Figure 4 shows no correlation between the He/H ratios of RRL intensities and line widths.
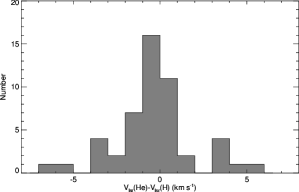
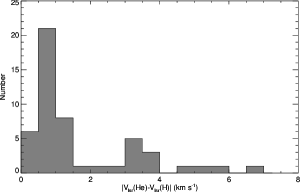
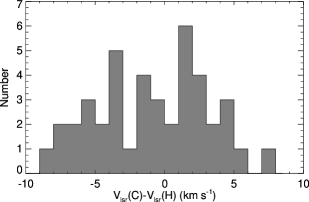
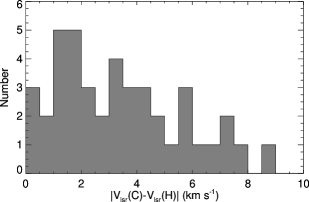
We summarize the average properties of the HRDS helium and carbon RRLs in Table 4 Summary of HRDS Radio Recombination Line Properties which shows the mean and standard deviation for the line intensity ratio, , the FWHM line width ratio, , the LSR velocity difference, , and the absolute value of the velocity difference, . Here, X is the subset of our sample being analyzed, i.e., the helium or carbon RRLs. We plot the distribution of these same quantities in Figure 5 for the helium RRLs and in Figure 6 for carbon.
The mean properties of the helium RRL emission from HRDS nebulae are identical to those found by QEAa for their H II region sample. Comparing HRDS with QEAa shows that the line intensity and line width ratios differ by less than . As did QEAa, we find that both ratio distributions have substantial intrinsic width, and neither is well described by a Gaussian. The standard deviations of the ratio distributions are also virtually identical. Moreover, the magnitude of these common standard deviations exceeds the difference between the average ratios for the two nebular samples by a factor of ten.
We find that there is a real paucity of nebulae with . QEAa had high enough sensitivity to detect such sources but also found very few. The HRDS, with even higher sensitivity, has only two more. Nebulae such as these must be relatively uncommon. As did QEAa, we find that the line width distribution drops off sharply for values 0.5 and 1. H II region RRL line widths arise from thermal broadening and turbulence. In the absence of any turbulence, the He/H line width ratio should be 0.5 due to the mass effect alone, so the H II regions where this ratio exceeds unity either must be very highly turbulent or their helium and hydrogen Strömgren zones are not cospatial.
We compare the helium and hydrogen RRL velocities in two ways by considering the LSR velocity difference, , and the absolute value of the velocity difference, . The distribution of absolute value differences is a better measure of systematic flows between the hydrogen and helium plasmas. We do not expect to see such flows, however, because the HRDS H II regions should have, on average, cospatial Strömgren zones that share the same kinematics. As did QEAa, we find no significant difference in the helium and hydrogen RRL kinematics. This is noteworthy given the disparate sizes of the telescope beams. The average of both the HRDS and QEAa H II region samples gives a velocity difference and an absolute value of the velocity difference is . For HRDS nebulae, the mean velocity difference is 0.2 smaller than that found by QEAa and the mean absolute value of the velocity difference is 1.0 larger. The absolute value of the velocity difference distribution, however, is not Gaussian. There are four sources where this quantity is , suggesting systematic flows between the helium and hydrogen gas. Again, for these few nebulae, the two Strömgren zones may not be cospatial.
In sum, from these helium RRL comparisons of HRDS and QEAa nebulae, we conclude that these objects all stem from a common population of Galactic H II regions. This is further explored in Section 4.4.
4.2 HRDS Nebulae and Galactic Photon Dominated Regions
Carbon RRLs provide important, complementary information about the physical properties and kinematics of the PDRs surrounding H II regions. Since the cosmic C/H abundance ratio by number is (Lodders, 2003; Caffau et al., 2010), carbon RRL emission from PDRs should be weak given the expected carbon column densities. Naively, one might also expect to see carbon emission from PDRs in front of, and behind, the H II region. Roshi et al. (2005), however, used multi-frequency data to constrain non-LTE models for PDRs. They concluded that the carbon RRL emission at X-band is dominated by stimulated emission. Their models showed that, because of stimulated emission, the carbon RRL emission from the foreground PDR material is five times brighter than the background PDR emission. The HRDS carbon RRL spectra thus preferentially measure emission from PDR material that is both outside, and also in front of, the H II region plasma emitting thermal free-free continuum photons. The properties of H II region carbon RRL emission from PDRs are therefore not expected to match those of RRLs from the hydrogen and helium Strömgren zones.
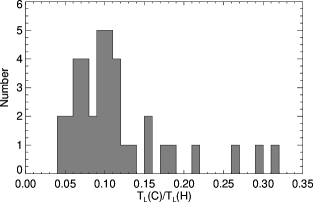
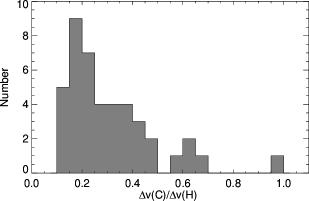
The average carbon RRL properties for HRDS H II regions are summarized in Table 4 Summary of HRDS Radio Recombination Line Properties and histograms of the distribution of C/H ratios for these properties are shown in Figure 6. As was also the case for QEAa carbon RRL emission, the histograms show that these distributions are not well-described by Gaussians. This is probably because not only is the PDR material inhomogeneous, but also the PDR/H II line of sight geometry must be favorable for stimulated emission to occur. Except for the mean C/H line intensity ratio, all other HRDS carbon RRL parameters are consistent with those found by QEAa for their H II region sample. The HRDS nebular means for the C/H line width ratio, together with the carbon and hydrogen RRL LSR velocity difference, and absolute velocity difference, are all within of the QEAa values.
The mean HRDS C/H line intensity ratio is 4 times greater, and the dispersion of this quantity is 7 times greater, than what QEAa found. This result stems from the many HRDS nebulae that have strong carbon RRL emission, often in the absence of any helium RRL emission. We find 19 QF A or B nebulae that have carbon, but no helium, emission. QEAa found only one such object and it had a poor QF. We show some of these H II regions in Figure 3. These nebulae are interesting because their C/H line intensity ratios are large, with the mean (the “C with no He” entry in Table 4 Summary of HRDS Radio Recombination Line Properties).
If we eliminate these 19 nebulae and recompute the mean carbon RRL parameters, we get the “C with He” values in Table 4 Summary of HRDS Radio Recombination Line Properties. Even this mean C/H line intensity ratio is 2 times greater than what QEAa found. We speculate that the much smaller GBT beam must, on average, be more completely filled with PDR material than is the 140 Foot beam. We discuss the six HRDS nebulae with the largest C/H intensity ratios in Section 4.3.
Carbon RRL line widths also result from a combination of thermal and turbulent broadening. Because the PDR material is denser and colder than the H II region plasma, however, the carbon RRL line widths should be narrower than the hydrogen and helium RRLs. The mass effect alone would yield a carbon line width a factor of 3.5 times narrower than the corresponding hydrogen line, giving . The PDR gas is also much colder, K in the zone, than the K H II region plasma. This gives a further narrowing of the carbon RRLs by a factor of , so might be . The average C/H line width ratio for HRDS and QEAa nebulae together is and both samples show a significant number of nebulae with ratios greater than 0.4. This confirms that the carbon RRL line widths from PDRs are non-thermal. Turbulence thus plays a major role in PDRs. Roshi (2007) suggested that the non-thermal carbon RRL line width is caused by magnetic turbulence and is a measure of the magnetic field strength of the PDR.
We do not expect the PDR and H II region kinematics to be identical. The carbon RRL and helium/hydrogen RRL velocity difference thus directly probes the relative motion between the PDR and H II region gas. We compare in Figure 6 the carbon and hydrogen RRL velocities in two ways by considering the LSR velocity difference, , and the absolute value of the velocity difference, . Both the HRDS and QEAa find that the velocity difference distributions are times wider than the same comparison for helium and hydrogen RRLs from H II regions. Although the mean difference for both H II region samples is 0 , the dispersions, 5 , are much larger than this and they estimate the magnitude of systematic flows between PDRs and H II regions. An even better measure of such flows is the mean absolute value of the PDR/H II region velocity difference. The HRDS and QEAa samples find this to be . Furthermore, using the Arecibo telescope at X-band to measure RRL emission, Roshi et al. (2005) also found that the relative motion between H II region ionized gas and the associated PDR material had an rms velocity difference of 3.3 km/s. From all these data alone we have no way of distinguishing between PDR gas flowing toward, and gas flowing away from, the H II regions.
We are, however, clearly detecting carbon emission from PDR gas that lies between us and the H II region. Moreover, the carbon line intensity is enhanced due to stimulated emission (e.g., Roshi et al. 2005; QEAa). For their H II region sample, QEAa found a strong correlation between the carbon RRL and the continuum intensities (see their Fig. 11). Here, in Figure 7 we plot instead the carbon RRL intensity as a function of the hydrogen RRL intensity. The hydrogen intensity is a proxy for the thermal free-free continuum emission because the average line-to-continuum ratio at 3 wavelength for Galactic H II regions is 0.1 (QEAa). As did QEAa, we see a rough correlation between the carbon RRL and continuum intensity which is what one expects if the carbon intensity is being enhanced by stimulated emission.
For the HRDS nebulae, however, there are more H II region outliers in the top left hand corner (high carbon and low continuum intensity) of Figure 7 than are present in the QEAa H II region sample. Most of these sources have Galactic longitudes within 15 of the Galactic Center. Because of velocity crowding in this region, we cannot determine accurate kinematic distances for these nebulae (Paper III). Nonetheless, they are located in the direction of the innermost Galaxy which is known to have a substantial non-thermal component to the total 3 continuum emission. We speculate that, compared to PDRs that are excited by only thermal emission from the H II region plasma, the stimulated emission boost for these outliers is further enhanced by an additional contribution of non-thermal emission to the continuum.
In the HRDS we see more sources with bright carbon, but no helium, RRL emission than in other H II region samples (e.g, QEAa). Interestingly, all of the outliers in Figure 7 have no helium RRL emission. Is this significant? We may not detect helium emission because: (i) the nebular abundance is low; (ii) the plasma is excited by later type stars and so helium is under-ionized relative hydrogen; or (iii) the HRDS does not have sufficient sensitivity to detect the helium emission. Based on previous He/H RRL line intensity ratios (e.g., QEAa, Eq. 2), we do not expect to detect helium in about a third of these sources (the 7 open rectangles in Fig. 7). These are nebulae that lie the farthest from the general trend that has the carbon RRL intensity track the continuum intensity. We see no helium RRL emission in these nebulae because the HRDS lacks the sensitivity to do so.
4.3 Carbon RRL Emission and H II Region MIR Morphology
The best images of PDRs surrounding Galactic H II regions come from Spitzer GLIMPSE 8.0 MIR data. The 8.0 GLIMPSE images trace PDRs because they include emission from polycyclic aromatic hydrocarbon (PAH) molecules that fluoresce in ultraviolet radiation fields. A structure commonly seen in these PAH images is a “bubble” morphology; Churchwell et al. (2006, 2007) have cataloged 420 of these objects. In Paper II we found that 211 HRDS nebulae are also Spitzer GLIMPSE 8.0 bubble sources. We suggested that this large number of HRDS bubble nebulae meant that these objects are three-dimensional structures. We also speculated that all GLIMPSE bubbles are caused by H II regions and that 50% of all Galactic H II regions have a bubble morphology at 8.0. This motivated us to classify the 8.0 morphology of all HRDS nebulae in an attempt to categorize the PDR/H II region geometry. The qualitative, visual classifications we used were “B” for bubble, “BB” for bipolar bubble, “PB” for partial bubble, “IB” for irregular bubble, “C” for compact, “PS” for point source, and “ND” for not detected (see Paper II for more details).
There are six HRDS nebulae with C/H line intensity ratios, , greater than 0.35. The C/H line intensity ratio histogram in Figure 6 does not plot these six largest ratios. We do not see any obvious patterns of MIR morphological peculiarities for these H II regions, except for G056.2520.160 and G344.9910.266. Both have . They are each QF A nebulae and neither has any helium RRL emission. Their MIR morphologies are “BB” and “C”, respectively. In MIR three color Spitzer images, these nebulae seem to be interacting with another PDR and in each case both sources are in the GBT beam (see go.nrao.edu/hrds). The strong carbon RRL emission may thus stem from PDR material in the GBT beam that has higher density and lower temperature than is typically the case. Both H II regions have very low hydrogen RRL line widths, , indicating that these nebulae have very cool plasmas and less turbulence than the general Galactic H II region population. In fact, the average C/H line width ratio for these nebulae is , which is precisely what one expects from the mass effect alone.
The strong carbon RRL emission that we see in some HRDS nebulae might be due to a number of reasons. The PDR material for HRDS nebulae is more inhomogeneous than H II region plasma. Perhaps these strong carbon lines stem from H II regions where a larger volume of the PDR than usual is measured by the GBT beam. It is certainly true that for stimulated emission to occur there must be sufficient carbon column density and the PDR/H II line of sight geometry must be favorable. Whatever the case, perhaps the MIR PDR morphology of carbon emission nebulae can provide some insight.
We test this hypothesis by analyzing the nebular carbon RRL properties as a function of the MIR morphological classifications assigned in Paper II. We compare the mean C/H ratios of various RRL properties for different MIR morphological classifications in Table THE GREEN BANK TELESCOPE HII REGION DISCOVERY SURVEY: IV. HELIUM AND CARBON RECOMBINATION LINES. The table lists the nebular morphology, and the number of carbon RRL emission components with that classification, N, as well as the mean and standard deviation for the line intensity ratio, , the FWHM line width ratio, , the LSR velocity difference, , and the absolute value of the velocity difference, . We only give the morphological classification properties for QF A and B nebulae in Table THE GREEN BANK TELESCOPE HII REGION DISCOVERY SURVEY: IV. HELIUM AND CARBON RECOMBINATION LINES.
Because the sample size for each morphological classification is small, the standard deviations are quite large. This makes it difficult to determine if there is a correlation between any of the line parameters and the nebular MIR morphology. One possibility is that the nebulae with PDRs within the GBT beam should have the strongest carbon emission. The compact, “C” morphology, H II regions are only marginally resolved by the GLIMPSE survey, which has a resolution of . These nebulae are entirely within the GBT beam. We might then expect compact morphology sources to have, on average, the strongest carbon lines. In fact, the means and dispersions we find for all the RRL parameters suggest that the RRL properties and kinematics for nebulae of all morphological types are indistinguishable. This implies that individual source geometries may be more important than 8.0 morphologies or that the Paper II classification criteria are not relevant for predicting the strengths of carbon RRLs from PDRs.
4.4 Helium Abundances
Measurements of the spatial distribution of elemental abundances provide key constraints for our understanding of Galactic chemical evolution. The H II region abundance relative to hydrogen by number, , is difficult to determine because one must know the neutral and ionic abundance ratios, , where , = , and = . (Recall that hydrogen in H II regions is fully ionized so the abundance is the H abundance.) Both RRLs and ORLs can be used to study and , but they cannot measure since there is no spectral transition for neutral helium. Because the high principal quantum number states of hydrogen and helium should respond to radiative and collisional effects in the same way, their line intensity ratio is equal to the abundance ratio. The interpretation of RRLs is therefore much simpler than for ORLs. RRLs can be used to measure and directly, providing information about the H II region excitation (e.g., Balser, 2006).
We derive the abundance ratio by number from the helium and hydrogen RRL properties:
| (1) |
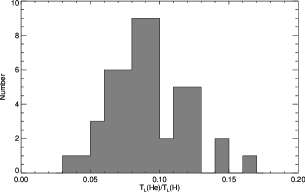
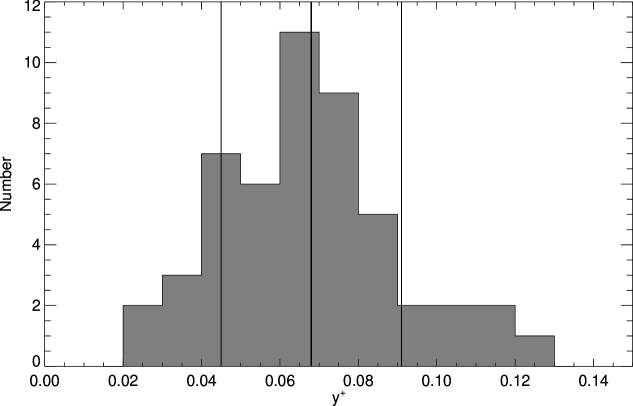
where is the line intensity and is the FWHM line width. Here we are using the area of the RRL emission set by a Gaussian fit as a measure of the equivalent width. Thus measures the abundance ratio directly if the source is optically thin. The distribution of values that we derive for HRDS nebulae is shown in Figure 8. We find that the mean abundance ratio by number is , where the uncertainty is the 1 standard deviation of the Figure 8 distribution. This result is the same as the abundance ratio found by QEAa, .
We find five sources with . Enhanced values have been measured in other H II regions, such as W3A (Roelfsema et al., 1992; Adler et al., 1996), W49A/M (de Pree et al., 1997), G0.150.05 (Lang et al., 1997), NGC 6888 (Esteban & Vilchez, 1992), and NGC 6334A and K3-50A (Balser et al., 2001). There are some possible explanations for these high measurements (e.g., Balser et al., 2001). We may be seeing an enhancement of from helium rich material ejected by massive stars. Too, because of a hard radiation field (or other radiative transfer effects), the helium Strömgren zone may be larger than that of the hydrogen. We may also have some observational or RRL fitting errors due to blended carbon and helium RRLs. Blended helium and carbon emission would increase the fitted width of the helium line and thus increase the measurement of .
Because HRDS H II regions are located, on average, at the far kinematic distance or beyond the Solar orbit (Paper III), they probe a new zone of the Galactic disk compared to the sample of previously known H II regions. We see a slight increase in with Galactocentric radius, , for the HRDS nebulae. Figure 9 shows plotted as a function of for QF A and B sources. Here, there are no H II regions inside 4 because we were unable to derive accurate values for 18 nebulae in the direction of the Galactic Center. An unweighted linear least-squares fit, which gives a slope of , is shown in Figure 9.
Previous studies found that decreases or remains constant with Galactocentric radius. Since our study has only 5 nebulae beyond an of 8 , a better analysis of Figure 9 requires more sophisticated numerical tools. We use the program SLOPES111See http://www.astro.psu.edu/users/edf/research/stat.html to make an ordinary least-squares regression using asymptotic error formulae (Isobe et al., 1990; Feigelson & Babu, 1992). These uncertainties for this type of fit are valid for a large, 50, data sample but underestimate the true error for a smaller sample. Because of this, we use the jackknife resampling procedure in SLOPES to derive more accurate uncertainties. This analysis gives exactly the same slope as before, , which says that there is a positive gradient in where its value increases with . This is a weak result, however, since the Pearson correlation coefficient for the Figure 9 data is only 0.35 and the fit errors are relatively large.
In any case, it is difficult to interpret the distribution of across the Galactic disk because we do not know either or for most H II regions. Ordinary O-type Population I stars do not radiate any appreciable number of photons with . Galactic H II regions are therefore not expected to have any zone so should be zero. Then, if there also were no neutral helium, would also be zero and the value, , would measure , the total helium abundance ratio by number, . But we do not know this to be the case. Again, since there is no spectral transition for neutral helium, we cannot directly determine . For some nebulae the ionization structure can be inferred using optical transitions but there are only a few H II regions (e.g., M17, S206) where one expects there to be little or no neutral helium (Carigi & Peimbert, 2008; Balser et al., 2011). Care must therefore be taken when interpreting, for example, the gradient in the Galaxy. Since is produced in stars, we expect a negative gradient in the abundance as one moves radially outward in the galactic disk. The abundances should be higher for smaller values of . For , however, the opposite may be the case. Since the ISM metallicity is also expected to have a negative radial gradient across the Galaxy, stars in the outer Galaxy should have fewer metals and metals preferentially absorb higher energy photons. Low metallicity stars thus produce harder radiation fields than high metallicity stars. H II regions in the outer Galaxy might therefore have higher values of , resulting in a positive gradient.
4.5 Helium Abundance Upper Limits
Upper limits for the ionic helium abundances of H II regions can in principal be used to constrain the ionization state of these nebulae. Galactic H II regions with a low upper limit on the abundance, , must have either a real lack of helium or an insufficient number of 13.6 photons to ionize their helium. The latter nebulae must have a high neutral helium abundance. We define the limit for an H II region with no visible helium emission to be:
| (2) |
This limit stems from Eq. 1 where here it is set by assuming that the helium RRL line intensity is at most 2 , where is the rms spectral noise of the spectrum, and is the intensity of the hydrogen RRL. For the limit, we estimate the He/H line width ratio to be the 0.813 average FWHM ratio, , measured by QEAa for their H II region sample.
The distribution of the upper limit abundances we derive for HRDS nebulae with no visible helium emission is shown in Figure 10. The black hatched histogram is the distribution for the 79 nebulae with the most astrophysically meaningful limits. Unless their is anomalously low, these H II regions ought to have helium RRL emission at the 2 intensity level if they are “typical” Galactic H II regions (see Section 2). For this sample we find an average upper limit of which is two times larger than the average we find for the HRDS nebulae that show helium emission. The gray histogram shows the distribution for the remaining emission components. (Here we exclude the 7 emission components that have unphysical limits, 1.) For this sample we find an average upper limit of . A plot of the nebular as a function of spectral rms noise shows no trend, except for the expected increase in the size of the errors as the spectral noise increases.
We show as a function of Galactocentric radius in Figure 11. We plot only those nebulae where we could determine an accurate from the Brand rotation curve. This eliminates 141 sources that lie in the direction of the galactic center. Black squares show the nebulae with the most astrophysically meaningful limits and the open circles are the remaining limits for HRDS nebulae. The solid line marks the fit to our determinations (Sec. 4.4 and Fig. 9). This fit shows that the actual measurements define a lower envelope for the upper limits. There are 5 HRDS H II regions that have abundance ratios below 0.04 and another 12 with below 0.04. These nebulae must have either a very low abundance or a significant amount of neutral helium. The spectral noise of these low upper limit nebulae spans the full range of HRDS sensitivity so they should be robust. All of these H II regions are located in the inner Galaxy at 6 .
5 Summary
H II regions and PDRs provide information about the structure, dynamics, and evolution of the Galaxy. We measure the line parameters for 82 helium and 54 carbon RRL emission components in the HRDS catalog. For our highest quality H II regions, we derive the average properties of ratios of the helium and carbon emission line parameters relative to that of hydrogen. The HRDS H II region sample includes 20 nebulae that show carbon, but no helium, RRL emission. Some of these nebulae show extremely strong carbon emission. Since the carbon RRLs stem from stimulated emission in the foreground PDR material, nebulae with carbon emission should have line of sight geometries where the foreground PDR material covers a significant fraction of the continuum emission from the H II region plasma. There does not seem to be any correlation, however, with the carbon RRL line parameters and the H II region PDR morphology as seen in Spitzer GLIMPSE 8 images.
We derive the ionic abundance ratio by number, , for HRDS H II regions using the measured line parameters. The mean abundance ratio, , is the same as that found by Quireza et al. (2006a) for a sample of typical Galactic H II regions. In contrast to all previous studies, however, the distribution of HRDS H II region abundance ratios shows a slight increase in with Galactocentric radius. It is difficult to interpret this result because we do not know either or for these nebulae. Finally, we derive upper limits for the abundance from nebulae without helium emission. There are 5 RRL emission components with less than 0.04 and another 12 with upper limits that are also below this value. These H II regions have either a very low abundance or contain a significant amount of neutral helium. All these nebulae are located in the inner Galaxy at Galactocentric radii less than 6 .
Because HRDS H II regions are located, on average, at the far kinematic distance or beyond the Solar orbit, they probe a new zone of the Galactic disk compared with the sample of previously known H II regions. We find, however, that the average properties of helium and carbon RRL emission from HRDS nebulae are consistent with those found for the general population of Galactic H II regions by previous studies. That the average RRL properties match, however, does not mean that there are not patterns to be found in their distribution across the Galactic disk. In a future paper in this series, we shall combine measurements of the thermal free-free continuum and recombination line emission to derive the nebular electron temperature, , from the line-to-continuum ratio. Because the H II region is a proxy for the nebular metallicity it can be used to constrain chemical evolution models for the Milky Way (e.g., Balser et al. 2011). The HRDS nebulae will allow us to search for radial and azimuthal metallicity structure in a new zone of the Galactic disk.
Appendix A The HRDS Web Site
All the helium and carbon RRL data are now incorporated in our HRDS Web site, http://go.nrao.edu/hrds. This site allows one to view Spitzer three-color images and the recombination line spectra. One can also download all the RRL data. As we continue to extend the HRDS all future data will also be available on this site.
References
- Adler et al. (1996) Adler, D. S., Wood, D. O. S., & Goss, W. M. 1996, ApJ, 471, 871
- Anderson & Bania (2009) Anderson, L. D., & Bania, T. M. 2009, ApJ, 690, 706
- Anderson et al. (2011) Anderson, L. D., Bania, T. M., Balser, D. S., & Rood, R. T. 2011, ApJS, 194, 32
- Anderson et al. (2012) —. 2012, ApJ
- Balser (2006) Balser, D. S. 2006, AJ, 132, 2326
- Balser et al. (2001) Balser, D. S., Goss, W. M., & De Pree, C. G. 2001, AJ, 121, 371
- Balser et al. (2011) Balser, D. S., Rood, R. T., Bania, T. M., & Anderson, L. D. 2011, ApJ, 738, 27
- Bania et al. (2010) Bania, T. M., Anderson, L. D., Balser, D. S., & Rood, R. T. 2010, ApJ, 718, L106
- Burke et al. (1989) Burke, V. M., Lennon, D. J., & Seaton, M. J. 1989, MNRAS, 236, 353
- Caffau et al. (2010) Caffau, E., Ludwig, H.-G., Bonifacio, P., et al. 2010, A&A, 514, A92
- Carigi & Peimbert (2008) Carigi, L., & Peimbert, M. 2008, Rev. Mexicana Astron. Astrofis., 44, 341
- Churchwell et al. (2006) Churchwell, E., Povich, M. S., Allen, D., et al. 2006, ApJ, 649, 759
- Churchwell et al. (2007) Churchwell, E., Watson, D. F., Povich, M. S., et al. 2007, ApJ, 670, 428
- Crawford et al. (2000) Crawford, F. L., Keenan, F. P., Aggarwal, K. M., et al. 2000, A&A, 362, 730
- de Pree et al. (1997) de Pree, C. G., Mehringer, D. M., & Goss, W. M. 1997, ApJ, 482, 307
- Downes et al. (1980) Downes, D., Wilson, T. L., Bieging, J., & Wink, J. 1980, A&AS, 40, 379
- Esteban & Vilchez (1992) Esteban, C., & Vilchez, J. M. 1992, ApJ, 390, 536
- Feigelson & Babu (1992) Feigelson, E. D., & Babu, G. J. 1992, ApJ, 397, 55
- Hollenbach & Tielens (1999) Hollenbach, D. J., & Tielens, A. G. G. M. 1999, Reviews of Modern Physics, 71, 173
- Isobe et al. (1990) Isobe, T., Feigelson, E. D., Akritas, M. G., & Babu, G. J. 1990, ApJ, 364, 104
- Lang et al. (1997) Lang, C. C., Goss, W. M., & Wood, D. O. S. 1997, ApJ, 474, 275
- Lockman (1989) Lockman, F. J. 1989, ApJS, 71, 469
- Lockman et al. (1996) Lockman, F. J., Pisano, D. J., & Howard, G. J. 1996, ApJ, 472, 173
- Lodders (2003) Lodders, K. 2003, ApJ, 591, 1220
- Natta et al. (1994) Natta, A., Walmsley, C. M., & Tielens, A. G. G. M. 1994, ApJ, 428, 209
- Osterbrock (1989) Osterbrock, D. E. 1989, Astrophysics of Gaseous Nebulae and Active Galactic Nuclei (Mill Valley, CA: University Science Books)
- Peimbert & Torres-Peimbert (1974) Peimbert, M., & Torres-Peimbert, S. 1974, ApJ, 193, 327
- Quireza et al. (2006a) Quireza, C., Rood, R. T., Balser, D. S., & Bania, T. M. 2006a, ApJS, 165, 338
- Quireza et al. (2006b) Quireza, C., Rood, R. T., Bania, T. M., Balser, D. S., & Maciel, W. J. 2006b, ApJ, 653, 1226
- Roelfsema et al. (1992) Roelfsema, P. R., Goss, W. M., & Mallik, D. C. V. 1992, ApJ, 394, 188
- Roshi (2007) Roshi, D. A. 2007, ApJ, 658, L41
- Roshi et al. (2005) Roshi, D. A., Balser, D. S., Bania, T. M., Goss, W. M., & De Pree, C. G. 2005, ApJ, 625, 181
- Shaver et al. (1983) Shaver, P. A., McGee, R. X., Newton, L. M., Danks, A. C., & Pottasch, S. R. 1983, MNRAS, 204, 53
- Sternberg et al. (2003) Sternberg, A., Hoffmann, T. L., & Pauldrach, A. W. A. 2003, ApJ, 599, 1333
- Wink et al. (1983) Wink, J. E., Wilson, T. L., & Bieging, J. H. 1983, A&A, 127, 211
| Source | rms | QF | ||||||
|---|---|---|---|---|---|---|---|---|
| G000.382+0.017a† | 136.49 | 17.95 | 22.94 | 0.66 | 25.37 | 0.40 | 2.06 | C |
| G000.382+0.017b | 102.67 | 10.40 | 31.67 | 1.73 | 41.03 | 1.98 | 2.06 | C |
| G000.7290.103a | 142.71 | 2.40 | 22.47 | 0.20 | 104.45 | 0.15 | 2.28 | C |
| G000.7290.103b | 107.02 | 1.15 | 30.20 | 0.47 | 82.44 | 0.34 | 2.28 | C |
| G000.838+0.189 | 125.72 | 0.85 | 25.51 | 0.20 | 5.24 | 0.08 | 2.52 | A |
| G001.324+0.104 | 104.77 | 0.60 | 27.00 | 0.18 | 13.03 | 0.08 | 2.34 | A |
| G001.330+0.088 | 99.01 | 0.61 | 27.24 | 0.19 | 13.41 | 0.08 | 2.66 | A |
| G002.404+0.068 | 55.97 | 0.45 | 23.50 | 0.22 | 7.45 | 0.09 | 2.30 | A |
| G004.346+0.115 | 119.48 | 0.58 | 17.86 | 0.10 | 6.77 | 0.04 | 2.53 | A |
| G004.5270.136 | 61.57 | 0.56 | 23.20 | 0.24 | 10.17 | 0.10 | 2.37 | A |
| G007.2540.073a | 84.23 | 0.48 | 18.03 | 0.13 | 47.07 | 0.05 | 2.24 | B |
| G010.2320.301 | 279.80 | 0.96 | 18.69 | 0.07 | 11.70 | 0.03 | 2.13 | A |
| G010.473+0.028 | 87.05 | 0.53 | 21.65 | 0.15 | 68.26 | 0.07 | 2.18 | A |
| G014.4780.006 | 81.05 | 0.43 | 26.61 | 0.16 | 24.48 | 0.07 | 2.60 | A |
| G014.489+0.020 | 88.96 | 0.90 | 28.39 | 0.33 | 28.42 | 0.14 | 3.23 | A |
| G015.1250.529 | 243.53 | 1.16 | 25.66 | 0.14 | 18.74 | 0.06 | 2.73 | A |
| G016.3610.209 | 53.83 | 0.46 | 18.44 | 0.18 | 46.56 | 0.08 | 2.44 | A |
| G016.9430.074 | 106.25 | 0.59 | 30.66 | 0.20 | 4.72 | 0.08 | 2.40 | A |
| G018.077+0.071 | 55.39 | 0.54 | 18.86 | 0.21 | 58.30 | 0.09 | 2.21 | A |
| G018.6770.236a | 65.26 | 0.60 | 29.66 | 0.14 | 45.24 | 0.14 | 2.31 | B |
| G018.8320.300 | 45.21 | 0.33 | 29.28 | 0.25 | 46.31 | 0.11 | 1.78 | A |
| G018.9370.434a | 221.85 | 0.91 | 23.83 | 0.05 | 67.94 | 0.05 | 2.20 | A |
| G020.450+0.025 | 71.13 | 1.07 | 12.74 | 0.27 | 73.93 | 0.27 | 2.19 | A |
| G020.5330.187 | 40.17 | 0.56 | 16.38 | 0.27 | 48.57 | 0.11 | 1.83 | A |
| G022.7550.246a | 73.85 | 0.54 | 19.12 | 0.17 | 106.81 | 0.07 | 2.04 | B |
| G022.7550.246b | 54.84 | 0.50 | 22.35 | 0.25 | 69.89 | 0.10 | 2.04 | B |
| G023.0290.405 | 137.32 | 1.05 | 14.71 | 0.15 | 76.60 | 0.15 | 2.26 | A |
| G023.2650.301a | 126.85 | 0.62 | 17.45 | 0.14 | 73.36 | 0.06 | 2.09 | B |
| G023.585+0.029 | 103.41 | 0.55 | 24.23 | 0.15 | 92.39 | 0.06 | 1.84 | A |
| G024.500+0.487a | 148.70 | 0.67 | 16.73 | 0.09 | 99.11 | 0.04 | 2.40 | A |
| G024.735+0.159a | 83.21 | 0.50 | 18.87 | 0.17 | 109.54 | 0.07 | 2.14 | B |
| G024.739+0.083 | 187.01 | 0.88 | 17.30 | 0.09 | 111.41 | 0.04 | 2.11 | A |
| G025.150+0.092a | 57.60 | 0.52 | 20.97 | 0.22 | 46.51 | 0.09 | 1.80 | A |
| G025.220+0.289 | 35.82 | 0.29 | 23.14 | 0.22 | 42.41 | 0.09 | 1.53 | A |
| G027.334+0.176a | 42.71 | 0.59 | 16.44 | 0.32 | 79.99 | 0.18 | 1.79 | B |
| G028.3040.390 | 170.36 | 0.48 | 21.59 | 0.07 | 77.33 | 0.03 | 2.47 | A |
| G028.696+0.048a | 189.68 | 1.04 | 19.85 | 0.07 | 100.84 | 0.07 | 2.33 | B |
| G028.696+0.048b | 64.54 | 1.01 | 11.87 | 0.09 | 116.88 | 0.09 | 2.33 | C |
| G030.2340.139a | 86.59 | 0.90 | 18.48 | 0.09 | 98.73 | 0.09 | 1.93 | B |
| G030.374+0.026a | 65.60 | 0.27 | 20.81 | 0.10 | 44.56 | 0.04 | 1.51 | A |
| G030.644+0.053a | 53.66 | 0.41 | 27.70 | 0.24 | 99.68 | 0.10 | 2.23 | A |
| G030.797+0.165a | 69.90 | 0.36 | 21.25 | 0.13 | 40.33 | 0.05 | 2.08 | A |
| G030.838+0.114a | 71.61 | 0.43 | 25.29 | 0.18 | 35.70 | 0.07 | 1.86 | A |
| G030.852+0.149a | 184.25 | 0.48 | 22.34 | 0.07 | 39.80 | 0.03 | 2.24 | A |
| G030.883+0.071a | 96.00 | 0.36 | 22.69 | 0.10 | 96.42 | 0.04 | 1.59 | A |
| G030.956+0.599a | 71.12 | 0.22 | 22.46 | 0.08 | 23.32 | 0.03 | 1.10 | A |
| G031.1570.148a | 78.23 | 0.54 | 20.41 | 0.17 | 43.53 | 0.07 | 1.99 | B |
| G031.4700.344 | 83.97 | 0.35 | 22.14 | 0.11 | 88.97 | 0.04 | 1.47 | A |
| G032.058+0.077 | 61.66 | 0.65 | 16.85 | 0.21 | 96.37 | 0.09 | 2.12 | A |
| G032.2720.226 | 65.07 | 0.29 | 25.88 | 0.13 | 21.45 | 0.06 | 1.60 | A |
| G032.928+0.607 | 50.97 | 0.18 | 27.68 | 0.12 | 38.20 | 0.05 | 0.96 | A |
| G034.0310.059a | 93.93 | 0.46 | 12.18 | 0.04 | 56.54 | 0.04 | 1.37 | A |
| G034.133+0.471 | 117.06 | 0.39 | 25.73 | 0.10 | 34.53 | 0.04 | 2.15 | A |
| G034.172+0.175 | 49.77 | 0.42 | 16.70 | 0.16 | 57.33 | 0.07 | 1.84 | A |
| G034.686+0.068 | 43.67 | 0.27 | 26.65 | 0.19 | 52.09 | 0.08 | 1.34 | A |
| G035.541+0.005 | 83.83 | 0.28 | 21.09 | 0.08 | 57.58 | 0.03 | 1.25 | A |
| G037.8160.379 | 57.30 | 0.28 | 21.18 | 0.12 | 64.13 | 0.05 | 1.77 | A |
| G037.8680.601 | 49.60 | 0.27 | 30.85 | 0.20 | 47.73 | 0.08 | 1.67 | A |
| G038.875+0.308 | 55.67 | 0.26 | 30.73 | 0.16 | 15.19 | 0.07 | 1.47 | A |
| G039.7280.396 | 51.37 | 0.30 | 25.08 | 0.17 | 58.26 | 0.07 | 2.07 | A |
| G039.8730.177 | 42.40 | 0.29 | 23.47 | 0.19 | 59.69 | 0.08 | 1.77 | A |
| G039.8830.346 | 62.67 | 0.26 | 32.61 | 0.16 | 58.96 | 0.07 | 1.86 | A |
| G041.5150.139 | 92.61 | 0.26 | 29.54 | 0.10 | 57.82 | 0.04 | 1.48 | A |
| G042.2090.587 | 44.37 | 0.29 | 21.61 | 0.16 | 72.01 | 0.07 | 1.67 | A |
| G043.818+0.393 | 30.04 | 0.16 | 28.19 | 0.18 | 10.59 | 0.07 | 0.94 | A |
| G044.501+0.335 | 48.38 | 0.26 | 22.27 | 0.14 | 43.22 | 0.06 | 2.11 | A |
| G048.5510.001 | 101.38 | 0.31 | 24.12 | 0.08 | 19.27 | 0.04 | 1.29 | A |
| G049.1630.066 | 36.11 | 0.28 | 19.97 | 0.18 | 60.23 | 0.07 | 1.58 | A |
| G049.3990.489 | 134.94 | 0.47 | 21.71 | 0.09 | 59.13 | 0.04 | 1.85 | A |
| G049.828+0.366 | 46.05 | 0.38 | 21.53 | 0.21 | 4.32 | 0.09 | 1.75 | A |
| G052.098+1.042 | 75.71 | 0.31 | 28.97 | 0.14 | 36.19 | 0.06 | 1.97 | A |
| G346.0560.021a | 87.78 | 0.49 | 21.20 | 0.14 | 76.76 | 0.06 | 2.55 | A |
| G347.870+0.015 | 103.81 | 0.71 | 23.54 | 0.19 | 32.21 | 0.08 | 3.35 | A |
| G348.5330.972 | 133.62 | 0.70 | 23.82 | 0.14 | 12.06 | 0.06 | 2.43 | A |
| G348.5570.985 | 108.50 | 0.61 | 20.73 | 0.14 | 10.57 | 0.06 | 2.54 | A |
| G350.004+0.438 | 65.82 | 0.52 | 30.41 | 0.15 | 34.33 | 0.15 | 2.20 | A |
| G350.177+0.017 | 119.82 | 0.52 | 22.81 | 0.11 | 69.00 | 0.05 | 2.47 | A |
| G350.330+0.157 | 93.67 | 0.55 | 16.76 | 0.11 | 62.66 | 0.05 | 2.39 | A |
| G352.3130.440 | 69.08 | 0.61 | 21.97 | 0.22 | 13.75 | 0.09 | 1.96 | A |
| G354.610+0.484 | 149.98 | 0.50 | 26.45 | 0.10 | 23.55 | 0.04 | 2.29 | A |
| G354.717+0.293 | 120.91 | 0.75 | 23.46 | 0.17 | 95.44 | 0.07 | 2.30 | A |
| G355.344+0.145 | 93.72 | 0.43 | 33.09 | 0.18 | 16.38 | 0.07 | 3.03 | A |
| G358.633+0.062 | 83.29 | 0.50 | 26.35 | 0.18 | 13.87 | 0.08 | 2.43 | A |
| G359.929+0.045a | 144.20 | 0.68 | 30.73 | 0.17 | 50.27 | 0.07 | 2.67 | A |
| G001.330+0.150 | 30.80 | 0.36 | 22.22 | 0.31 | 19.98 | 0.13 | 2.43 | A |
| G008.3730.352 | 74.20 | 0.45 | 23.07 | 0.16 | 34.88 | 0.07 | 2.25 | A |
| G008.4320.276 | 49.79 | 0.46 | 18.72 | 0.20 | 34.83 | 0.08 | 2.61 | A |
| G009.8750.749 | 79.13 | 0.40 | 24.24 | 0.14 | 30.90 | 0.06 | 1.94 | A |
| G010.6380.434 | 72.21 | 0.54 | 18.23 | 0.16 | 0.38 | 0.07 | 1.97 | A |
| G022.7390.303a | 34.23 | 0.30 | 23.48 | 0.24 | 69.02 | 0.10 | 1.43 | B |
| G028.696+0.048c | 8.76 | 0.49 | 17.03 | 0.47 | 38.92 | 0.47 | 2.33 | B |
| G030.0220.044 | 105.13 | 0.49 | 21.73 | 0.12 | 94.91 | 0.05 | 1.35 | A |
| G030.249+0.243a | 34.09 | 0.30 | 20.99 | 0.21 | 8.70 | 0.09 | 1.60 | A |
| G034.041+0.053 | 38.04 | 0.34 | 22.49 | 0.23 | 36.41 | 0.10 | 1.53 | A |
| G038.9300.386 | 11.61 | 0.28 | 20.89 | 0.58 | 41.84 | 0.24 | 1.66 | B |
| G045.5420.006 | 41.90 | 0.27 | 25.89 | 0.19 | 54.94 | 0.08 | 1.67 | A |
| G056.2520.160 | 7.86 | 0.26 | 17.34 | 0.67 | 35.37 | 0.28 | 1.48 | B |
| G343.8560.106 | 37.56 | 0.64 | 20.62 | 0.42 | 17.77 | 0.17 | 2.94 | B |
| G344.9910.266 | 11.14 | 0.44 | 15.14 | 0.70 | 29.40 | 0.29 | 1.56 | B |
| G351.265+1.019 | 51.43 | 0.36 | 26.95 | 0.22 | 3.72 | 0.09 | 1.86 | A |
| G351.691+0.669 | 72.62 | 0.40 | 20.13 | 0.13 | 2.99 | 0.05 | 2.45 | A |
| G356.4700.001 | 20.14 | 0.42 | 23.61 | 0.59 | 4.46 | 0.24 | 2.63 | B |
| G358.6160.076 | 62.81 | 0.47 | 21.66 | 0.19 | 212.91 | 0.08 | 1.73 | A |
| G358.720+0.011 | 38.68 | 0.37 | 23.74 | 0.27 | 206.54 | 0.11 | 1.80 | A |