Temporal and Spatial Analyses of Spectral Indices of Nonthermal Emissions Derived from Hard X-Rays and Microwaves
Abstract
We studied electron spectral indices of nonthermal emissions seen in hard X-rays (HXRs) and in microwaves. We analyzed 12 flares observed by the Hard X-ray Telescope aboard Yohkoh, Nobeyama Radio Polarimeters (NoRP), and the Nobeyama Radioheliograph (NoRH), and compared the spectral indices derived from total fluxes of hard X-rays and microwaves. Except for four events, which have very soft HXR spectra suffering from the thermal component, these flares show a gap between the electron spectral indices derived from hard X-rays and those from microwaves () of about 1.6. Furthermore, from the start to the peak times of the HXR bursts, the time profiles of the HXR spectral index evolve synchronously with those of the microwave spectral index , keeping the constant gap. We also examined the spatially resolved distribution of the microwave spectral index by using NoRH data. The microwave spectral index tends to be larger, which means a softer spectrum, at HXR footpoint sources with stronger magnetic field than that at the loop tops. These results suggest that the electron spectra are bent at around several hundreds of keV, and become harder at the higher energy range that contributes the microwave gyrosynchrotron emission.
1 Introduction
During the impulsive phase of solar flares, electrons are accelerated up to the energy of MeV, and are responsible for nonthermal emissions with power-law spectra observed in hard X-rays (HXRs) and in microwaves. In HXRs the bremsstrahlung emission from electrons with the energy of more than tens of keV is dominant (Brown, 1971), while the gyrosynchrotron emission from more than several hundreds of keV electrons is dominant in microwaves (White & Kundu, 1992; Bastian et al., 1998; Bastian, 1999). HXR and microwave nonthermal emissions are very similar in the light curves (e.g., Kundu 1961; Kai 1986), and therefore, it has been generally accepted that they are produced by a common population of accelerated electrons.
The electron spectra derived from HXR emissions are, on the other hand, often different from those derived from microwave emissions. The electron spectral indices of the power-law distribution derived from HXRs are, in many cases, larger than those derived from microwaves , that is (Kundu, 1965; Silva et al., 1997, 2000). According to the study by Silva et al. (1997), the average gap between and , () is 0.5 – 2.0. This means that microwave spectra are harder than the HXR ones, and that acceleration and/or traveling mechanisms could be different for these wavelengths. For example, Melrose & Brown (1976) suggested the so-called trap-plus-precipitation model, in which the magnetic trap works more effectively for such higher energy electrons that emit microwaves than HXR emitting electrons with lower energy. Minoshima et al. (2008), on the other hand, showed in their numerical calculation that the gap is naturally generated even from the electron distribution with a single power-law spectrum, since microwave and HXR emissions are from different electrons (trapped and precipitating ones, respectively.) In the early phase of a flare, however, the magnetic trap is probably not so effective, and we can examine the features of the nonthermal electrons without having to deal with the trapping effect. Moreover, it is crucially important to analyze imaging data both in HXRs and in microwaves, since we can resolve spatially the precipitating (at footpoints) and trapped (at loop tops) components with them.
In this paper, we report the results of the analyses on the electron spectral indices derived from HXRs and microwaves, and also discuss the temporal and spatial characteristics. We used the HXR data obtained with the Hard X-ray Telescope (HXT; Kosugi et al. 1991) aboard the Yohkoh satellite (Ogawara et al., 1991). The microwave data were taken with the Nobeyama Radio Polarimeters (NoRP; Torii et al. 1979; Shibasaki et al. 1979; Nakajima et al. 1985a), and the Nobeyama Radioheliograph (NoRH; Nakajima et al. 1994) at Nobeyama Solar Radio Observatory, National Astronomical Observatory of Japan. These data enable us to examine the nonthermal features of the accelerated electrons spatially, temporally, and spectroscopically both in HXRs and in microwaves. In §2 and §3 we summarize the observations and the method of the analyses, respectively, and we show the results of the statistical analyses in §4. In §5 we present discussions and our conclusions.
2 Observations
We used HXR data obtained with Yohkoh/HXT.
By using the HXT data, we can synthesize the HXR images in four energy
bands, namely the L band (14 – 23 keV), M1 band (23 – 33 keV), M2 band
(33 – 53 keV), and H band (53 – 93 keV).
The spatial and temporal resolutions of the HXT images are
5′′ and 0.5 s, respectively.
To obtain the HXR photon spectral index (, where is the HXR intensity, and
is energy of the photon), we used the data in the two highest
energy bands, i.e., the HXT M2 and H bands, because HXR emissions with
energy less than 30 keV sometimes suffer from the contribution of the
thermal emissions.
Therefore, the HXR photon spectral index is roughly written as
, where and
are the effective energies for the M2 and H bands.
Though, as we will discuss later, some events showed the effects of the
super-hot thermal components even in the M2 band.
In this work we calculated the HXR photon spectral indices by using the
programs hxt_powerlaw in the Solar SoftWare (SSW) package on IDL.
We accumulated the HXT data for two seconds in the spectral analyses to
reduce the photon noise.
We also used the HXR spectra derived from the Wide Band Spectrometer (WBS; Yoshimori et al. 1991). The Hard X-ray Spectrometer (HXS), one of the sensors installed on the WBS, is dedicated to taking HXR spectra over a wide energy range. WBS/HXS can obtain HXR spectra with higher spectral resolution than HXT, although it cannot obtain the spatial information. Therefore, the data of WBS/HXS and HXT are complementary for the imaging spectroscopy in HXRs. Sato et al. (2006) summarized all the events observed by WBS, and we used their database of the HXR spectra.
In microwaves the gyrosynchrotron emission is dominant during the impulsive phase of a flare. The spectrum in microwave range is approximately fitted with the two power-law indices and by the function as follows:
| (1) |
The optically thin part, therefore, follows the power law distribution with a negative spectral index () as , where is the flux density at frequency (e.g. Ramaty (1969); Dulk (1985)).
In this study we used the microwave data taken with NoRP, which measures the total fluxes at 1, 2, 3.75, 9.4, 17, 35, and 80 GHz, with a temporal resolution of 0.1 s. By fitting a NoRP spectrum with the equation (1), we can obtain the spectral index for the optically thin gyrosynchrotron. We did not use the NoRP 80 GHz data in this work due to the poor statistics. For some events, the NoRP 1 GHz data were also ruled out, because they clearly did not follow the gyrosynchrotron, but instead, the plasma emission. We accumulated the NoRP data for 5 s to reduce the noise level. The microwave fluxes of the NoRP data are determined with the error of less than 10 % of the signal for 1, 2, 4, 9.4 GHz, and 15 % for 17 and 35 GHz, which is mainly due to the observation conditions such as the calibration and the weather. The error to determine is also affected by the accuracy of fitting, and is finally estimated to be about 0.5.
NoRH also observes the sun at 17 and 34 GHz. The microwave 2-dimensional images are synthesized from the NoRH data, and the spatial resolutions (FWHMs of the synthesized beam) of about 14′′ for 17 GHz and 7′′ for 34 GHz. The time cadence of the data we used in this work is one second. We can derive the two-dimensional distribution (map) of the microwave spectral indices using the NoRH data (), by calculating for each position of images. If we assume that the turnover frequency is less than 17 GHz, the derive is for the optically thin gyrosynchrotron emission.
Here, we have to note the calibration of the NoRH 17 and 34 GHz data. NoRH calibrates phase and gain by using the sun itself (i.e. the solar disk) as a calibrator, thanks to the redundant antenna configuration. However, the fundamental (smallest) spacing of the antennas ( m) corresponds to the maximum wavelength in the space of 20′ () at 34 GHz, which means that the whole solar disk is not resolved. The solar disk at 34 GHz is partially overlapped with other fake solar disk images, and therefore, the background (quiet) solar disk is possibly not well determined. To correct this, we adjusted the flux of the flare region taken by NoRH 34 GHz, which is subtracted by the preflare data, to the fitting results derived from NoRP. NoRP calibrates those fluxes by using sky and absorber levels. In our cases the NoRH 34 GHz fluxes are usually smaller than the NoRP 35 GHz ones, and the ratio (NoRH 34 GHz)/(NoRP 35 GHz) is from 0.4 to 1.2. This calibration possibly reduces the derived spectral index about 1.0 at a maximum. We also corrected the NoRH 17 GHz flux of the flare region, by using the fitting result from NoRP. Although the correction ratio (NoRH 17 GHz)/(NoRP 17 GHz) ranges from 0.6 to 1.2, it is roughly comparable to 1 in most cases. This calibration causes the error on , mainly due to the measurement error of the radio flux by NoRP, and is about 0.4. The relative displacement between the images in 17 GHz and those in the 34 GHz due to the NoRH image syntheses also causes the error to estimate the spectral index . The NoRH image syntheses hold an uncertainty on the positioning of about , and in this case, the error on is about 0.2 for bright emission sources.
3 Data Analyses
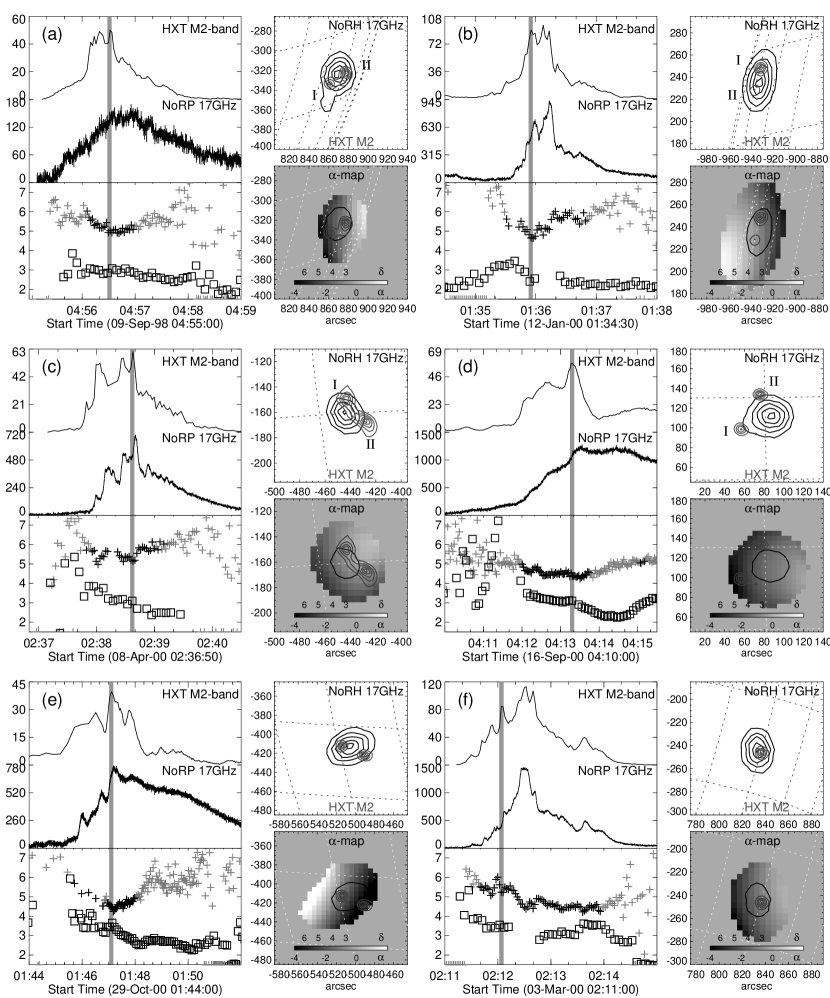
Strong (i.e., intense) and large events are preferable for our imaging spectroscopic analyses. Therefore, we sought solar flares observed by HXT, NoRH, and NoRP for the period from the start of the dual-frequency observation with NoRH (November 1995) to the end of the observation of Yohkoh (December 2001), and selected 12 flare events that meet the following criteria; (1) The flare is larger than M1.0 on the GOES scale. (2) The flare is an event listed in The Yohkoh HXT/SXT Flare Catalogue (Sato et al., 2003), and the maximum HXR intensity is so strong that the counts per second per subcollimator in the HXT M2 band are larger than 30. (3) The spatial size of the microwave emission source observed with NoRH at 17 GHz is large enough, and it is more than 4 times of the beam size. (4) The microwave images can be successfully synthesized from the NoRH data, in other words, the microwave emissions are not extremely strong111The normal tool for synthesizing NoRH images often fails in the case of very strong microwave emission.. (5) The optically thin parts of the gyrosynchrotron emission are well defined from the NoRP data, which means that the turn-over frequencies determined from the fitting do not reach 17 GHz or more. (6) The peak time of the event is between 00:00 UT to 06:00 UT, which corresponds to 09:00 and 15:00 JST (i.e. Japanese daytime), and the NoRH beam pattern is not so distorted. Table 1 lists all the 12 flares. Figure 1 also shows temporal and spatial features of each event. The selected events are widely distributed longitudinally and in the flare size.
3.1 HXR Spectral Indices
In the selected events we confirmed that the dominant HXR emissions are from footpoints of flare loops, and no loop top HXR sources are included, such as those reported by Masuda et al. (1994). This means that they are produced by bremsstrahlung caused by the interactions between the precipitating energetic electrons and the dense chromospheric plasma. Therefore, it is reasonable that we adopt the thick-target model (Brown, 1971; Hudson et al., 1978; Sakao, 1994) for the HXR emission sources. In this paper we determined the spectral indices from the total HXR intensities, assuming that the HXR emissions from the footpoint sources are so strong that we can approximately equate the total intensities to the emissions from the footpoint source.
The thick-target model suggests the relation between and the spectral index of the number flux of the injected energetic electrons (), as . To estimate the spectral index of the accelerated electron , we further have to consider the traveling time of the electrons (), since energy-dependent moderates the spectral index and . In this paper we adopted the typical timescale over which the precipitating electrons travel the effective length in the flare loops with the velocity , that is, . The traveling time is proportional to , that is, . Then, the electron spectral index derived from the HXR emissions follows the relation, .
The seventh column of Table 1 shows the derived spectral index at a time when the HXR emission records the maximum in the HXT M2 band for each event as shown in the second column. The derived ranges from 3.8 to 6.6. The error to estimate the spectral index is about 0.5, and the same is true for , under the assumption of single power-law HXR spectra. The photon noise is the main factor of the error, and therefore, it is even reduced during strong HXR emissions (to about 0.2).
As shown in Figure 1, in most cases, the temporal variations of the spectral index, which are plotted with the cross mark (), show the soft-hard-soft (SHS) behavior at the peak times of the HXR emissions. Therefore, recorded in Table 1 is roughly the minimum value during the burst. As we describe below, for the 2000 January 12 (event b) and the 2000 March 3 (event f) flares, we chose other sub-peaks instead of the maximal intensities, because we could not well fit the microwave spectra.
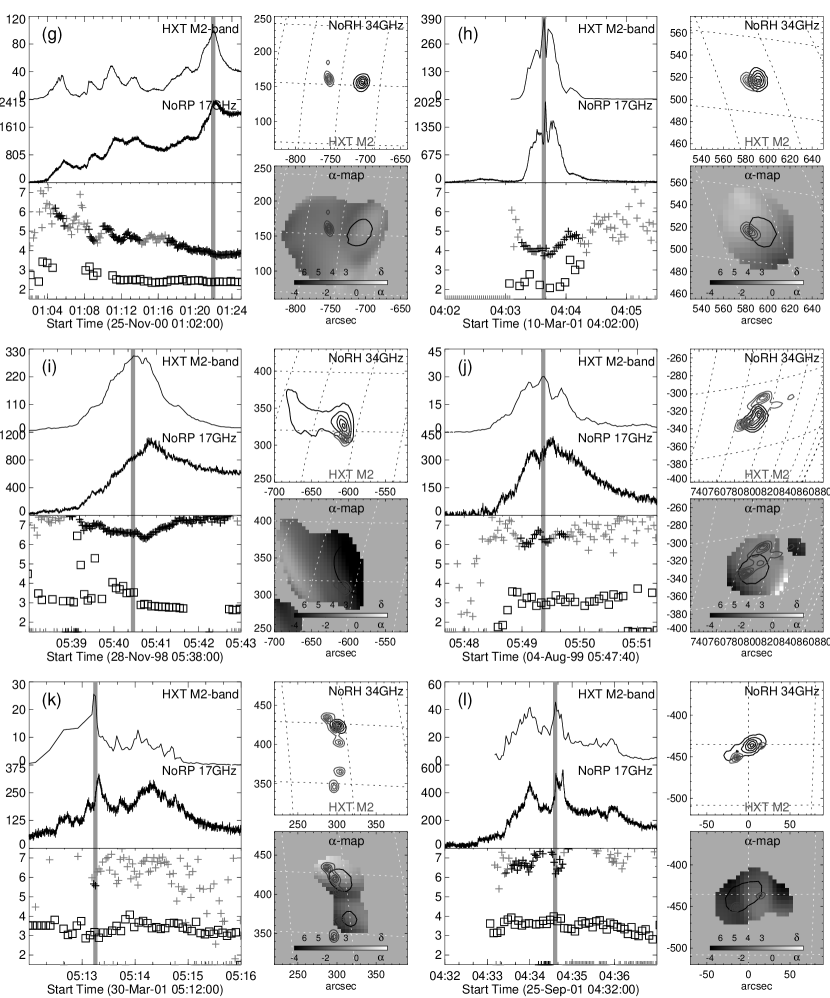
In Figure 2 we show the HXR spectra derived from WBS/HXS. These are from the database of Sato et al. (2006). The times on the top are the integration time in UT, and they almost cover the HXR maxima. The solid lines are the power-law distribution of the HXR spectra derived from HXT, while the absolute values are arbitrary. For the 2000 March 3 (event f) and the 2001 March 30 (event k) flare, the integration times of WBS/HXS are out of the HXT peak times we took. We can confirm that the HXR spectral indices derived from HXT fit the HXR spectra of WBS/HXS within the margin of errors as small as 0.2 (Sato et al., 2006).
3.2 Microwave Spectral Indices
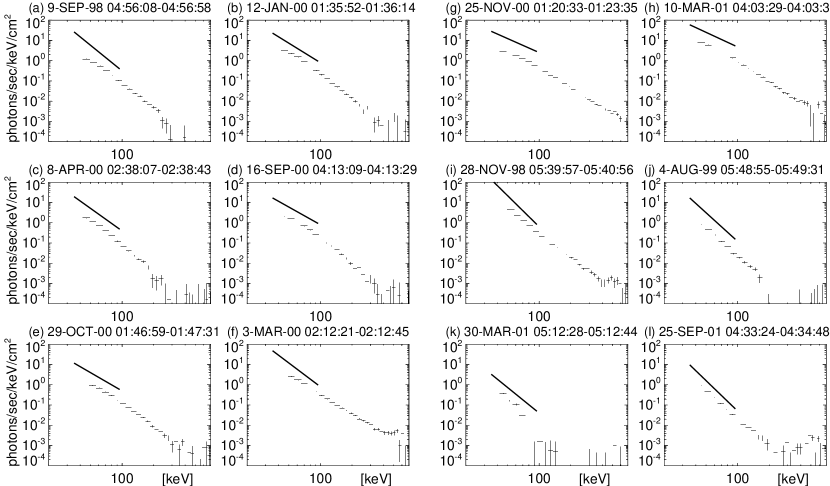
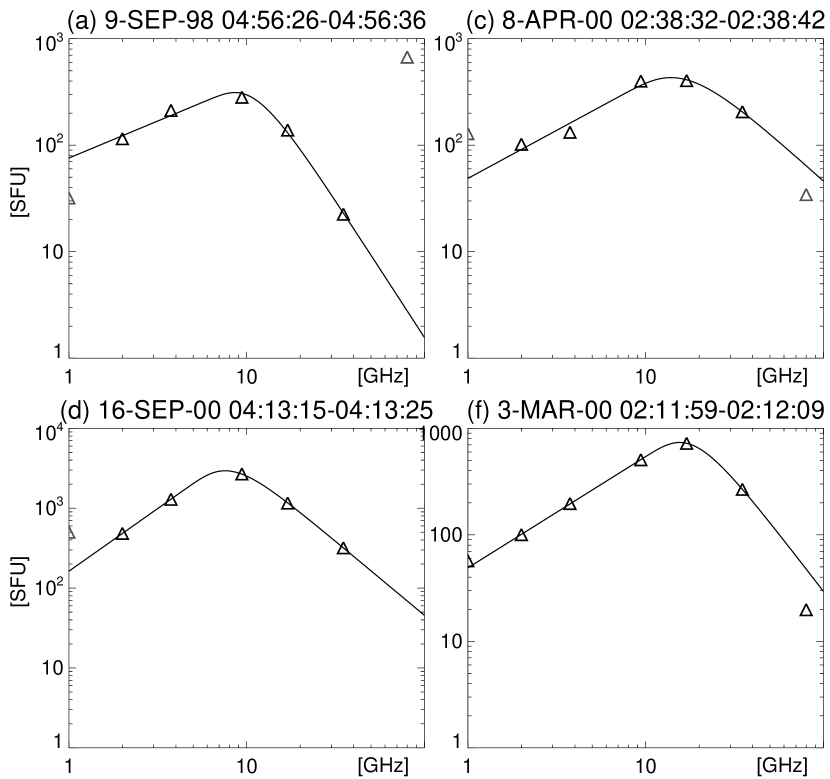
Next, we derived the spectral indices of the accelerated electrons from the microwave emissions taken with NoRP. For the optically thin gyrosynchrotron emission, is related to the spectral index of the accelerated electrons . There have been several studies to derive the relation between and , and we adopt the approximation derived by Dulk (1985) here, and . In this paper, we distinguish the spectral index derived from NoRP from that from NoRH with the subscripts P and H. Figure 3 shows some examples of the NoRP spectra and the fitting result at the time of HXR maximal intensity (column 2). The eighth column of Table 1 also shows the spectral index derived from NoRP at the time of the HXR maxim. As we mentioned above (§2), the error to determine is about 0.5, and therefore, that for is about 0.6. We confirmed that the contribution from the free-free emission at the 35 GHz is negligible. The temporal variations of the follow the gradual-hardening (GH) or soft-hard-harder (SHH) behaviors as shown in Figure 1. We added the gap between the spectral index derived from HXRs and that from microwaves in the ninth column. We will discuss in more detail later.
For the 2000 January 12 and 2000 March 3 flares (events b and f, respectively), the turnover frequencies are higher than 20 GHz at the HXT maxima, and we could not well fit the spectral indices for the optically thin part of the gyrosynchrotron emission. Therefore, we chose other sub-peaks of the HXR light curves of these events for the spectral analysis. These peak times are shown with gray vertical lines in Figure 1.
From the NoRH data, we can derive the spatially resolved spectral indices (and therefore, ). We can compare, for example, at the footpoint sources with that of the loop-top ones. As we just mentioned, we confirmed that the turnover frequencies derived from NoRP are lower enough than 17 GHz except for the peak times of the events (b) and (f). For the two events, we again selected preceding sub-peaks for further spectral analyses. Therefore, the indices derived from only two frequencies (17 and 34 GHz) are mainly for the optically thin gyrosynchrotron, while we cannot rule out the possibility that they are locally enhanced to be close to or larger than 17 GHz. Figure 1 shows such two-dimensional distribution of the index-, which we call “-map” in the bottom right sub-figure.
4 Results
Table 1 lists the selected 12 events, with the peak time of the HXT M2 band (column 2), the delay of the peak times of microwave (NoRP 17 GHz) compared to those of HXR (HXT M2 band) in second (column 3), the spectral index derived from HXT (column 7), that derived from NoRP (column 8), and the gap () (column 9). In Figure 1 we present the time profiles of the HXR flux of HXT M2 band and the microwave flux at 17 GHz taken with NoRP (top left). The time profiles of the spectral indices and are also shown with the cross () and square () signs, respectively, in the bottom left sub-figure. We also present the contour images in the microwave taken with NoRH at 17 GHz (top right) of the selected events. The contour levels of the microwave images are 20 %, 40 %, 60 %, 80 %, and 95% of the peak intensity. The microwave images are overlaid with the HXR contour images taken with HXT M2 band with the contour levels of 20 %, 40 %, 60 %, 80 %, and 95% of the peak intensities.
4.1 Peak Delay of Microwave Emissions
As the top left sub-figures of Figure 1 show, the microwave peaks almost always delay from the HXR peaks. The delay times for the events are listed in the third column of Table 1. These delays of microwave peaks to HXR ones have been often observed, and reported by various authors (e.g., Güdel et al. 1991). In the current case the delays are from 0 to 21 seconds, and the average is 7.3 seconds. These are comparable with the result by Nakajima et al. (1985b). Delays of microwave peaks to HXT ones are thought to be caused by magnetically trapping for microwave-emitting electrons, while HXR emissions are from the directly precipitated electrons to the chromosphere.
4.2 Gap of Spectral Indices
According to the results summarized in Figure 1 and Table 1, especially concerning the gap , we first categorize these events into two groups. As we mentioned above, the temporal variations of clearly show the SHS behavior at the peaks, while those of show hardening features (GH or SHH) as flares progress. In most cases, therefore, the listed gap is the smallest value near the HXR peaks. For all events, the gap is always positive, which means that the electron spectra derived from microwaves of this group are always harder than that from HXRs.
The first is the group with smaller gap ( 2.2). This group shows the electron spectral index derived from HXRs of about 4.6 0.8, while that derived from microwaves is about 3.0 0.8. The gap of about 1.6 is well consistent with the result by Silva et al. (2000). The eight events (from a to h) belong to this group. The other 4 events (from i to l), which belong to the second group, have much larger gaps of greater than 2.7. In particular, the electron spectral index derived from HXRs is much larger than those of the first group, and is about 6.2 0.5. We checked the HXT data for those events, and concluded that the HXR emissions suffered from the thermal components even in the M2 band. The HXR spectra derived from WBS/HXS (Fig. 2) are also very soft. Huang et al. (2006) studied one of them (the 1998 November 28 flare; event i), in more detail, and concluded that there is a vast super-hot thermal component in this flare, which softens the HXR spectrum. Henceforth, we discuss only the first group.
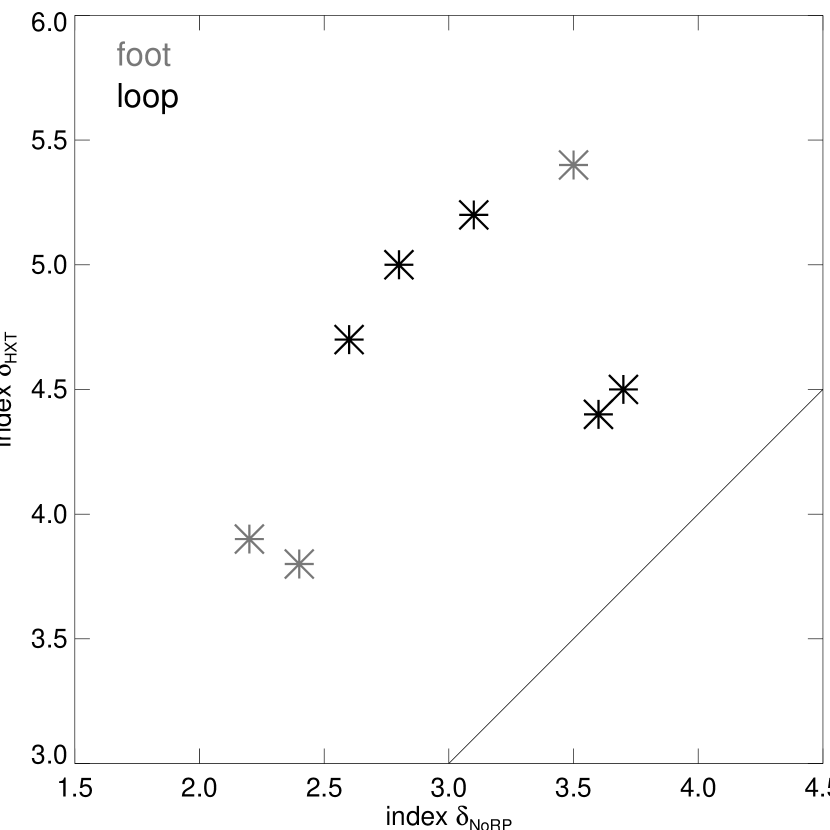
Even after we eliminate the second group, there remains the gap . Figure 4 shows the scatter plot with the horizontal axis of and the vertical axis of . The events are marked with the asterisks (). The solid line shows the points where is equal to . This also suggests that there is a certain gap between the spectral indices .
4.3 Microwave Emission Sources
As shown in Figure 1, the sites of the dominant microwave emissions are different for each event. According to the spatial displacement between the brightest position of the microwave emission sources and those of the HXR sources, and/or by using imaging observations in soft X-rays and in extreme ultraviolets, we categorized the microwave emission sources into two cases; footpoint source (group F; displacement is less than 5′′) and loop source (group L; displacement is larger than 5′′) as noted in the sixth column of Table 1. Here, we note that the brightest microwave emission source seen in the 2000 November 25 flare (event g) is confirmed to be a footpoint source (Takasaki et al., 2007), although it is displaced from the HXR source of about 40′′. Therefore, we categorized this case as a footpoint event.
We confirmed that the dominant microwave emission sources appear at the tops or legs of flare loops for many cases (5 of 8 events). This is consistent with the result of Huang & Nakajima (2009) or Melnikov et al. (2002). We will discuss the difference between the temporal evolution of the spectral indices for group L and that for group F in the next subsection.
4.4 Temporal Evolution of Spectral Indices
We examine the temporal evolution of the spectral indices. The HXR spectral index mostly shows the SHS behaviors at each short peak, while two of them (events f and g) show even GH features. The temporal evolution of the microwave spectral index , on the other hand, seems different, according to the position of microwave emission sources (i.e. group L/F).
For group L (events a, b, c, d, and e), the time profiles of the spectral indices ( and ) show similar evolution from start to peak of the bursts, while the gap increases with time after the peaks. In other words, the electron spectral index derived from HXRs increases after the peaks, showing the SHS features, while the electron spectral index from microwaves becomes further smaller showing SHH or GH features. For group F (events f, g, and h), on the other hand, both the spectral indices ( and ) show similar evolution through the impulsive phase while maintaining a gap of about 1.6. However, event (h) is different from the other two events of group F. This event shows the SHS features both in the microwave index and in the HXR index , while the others show GH features.
From the point of the temporal evolution, we can, therefore, re-classify the eight events into the three groups: (L) microwave emission sources are located at loop tops/legs, and and show SHS and GH features, respectively (events a, b, c, d, and e), (F) microwave emission sources are from footpoints, and both and show GH features (events f and g), (F∗) microwave emission source is again from footpoints, but both and show SHS features (event h).
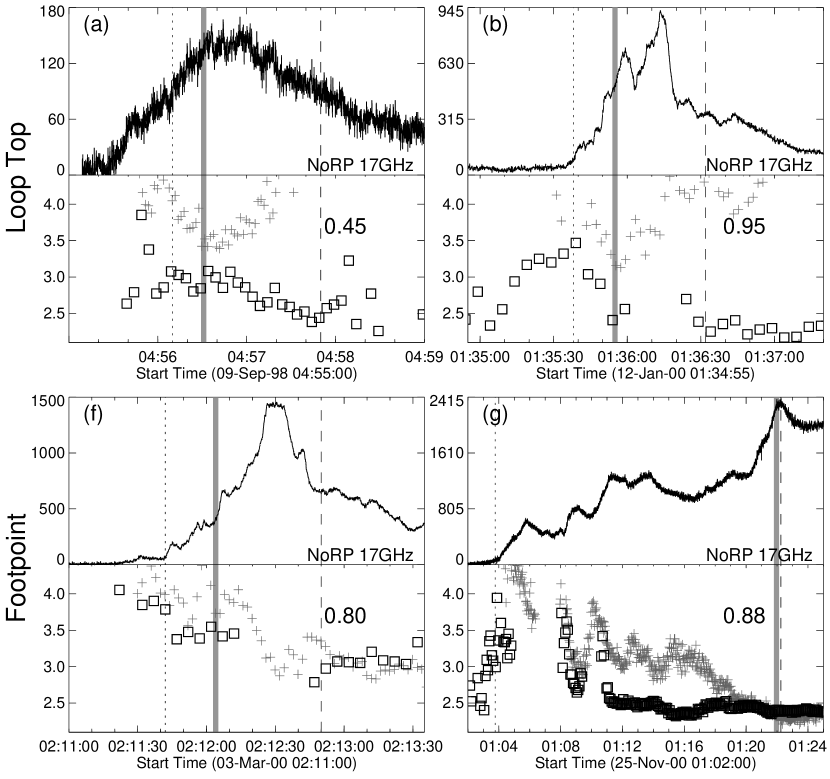
Figure 5 is roughly a realignment of Figure 1, but much more focuses on the temporal evolution of the microwave spectral index during the bursts for the groups (L; top) and (F; bottom). The vertical dotted lines correspond to the times when the microwave 17 GHz fluxes taken by NoRP exceeds 100 SFU (Solar Flux Unit). We determine this time as the start of the bursts. The vertical dashed lines correspond to the times when the 17 GHz fluxes become half of the peak values. We define this time as the end of the bursts. Although even after the end times the microwave indices become smaller, the fluxes probably suffer from the thermal component in the microwave emissions, which should be avoided from the analysis. For the 2000 November 25 flare (event g), we defined the end time just after the peak HXR time, since the hardening seems saturated after 01:12 UT, and no further hardening is seen. The bottom panels again show the time profiles of the spectral index with the square () marks. The overlaid time profiles are the spectral index (cross ). We subtracted 1.5 from the original value of the index to clearly show the temporal variation. The numbers noted in the figure show how much the microwave spectral indices decrease during the two vertical dotted lines. We also summarized the hardening degree in the tenth column of Table 1. As a result, the nonthermal spectra harden with the indices of 1.0 on the average. The hardening with the microwave spectral index of about 1 seems to be consistent with the discussion of the trapping time of relativistic electrons (Bai and Ramaty, 1979; Petrosian, 1985).
From the start to the peak of the HXR bursts, which corresponds to the time range from the dotted line to the thick gray line in Figure 5, both the time profiles of the microwave spectral index and that of the HXR spectral index decrease simultaneously, keeping a certain gap of about 1.5. The 2000 November 25 flare (event g) is a special case due to the very long duration and the smooth variation of the HXR and microwave emissions (Takasaki et al., 2007). This flare shows GH features even in the HXR spectral evolution, and is a typical “type-C flare” (e.g. Hoyng et al. 1976), which have been discussed from the Hinotori era (Cliver et al., 1986; Kai, 1986; Dennis, 1985; Kosugi et al., 1988). These imply that the magnetic trap effectively works both on the microwave-emitting electrons and even on the HXR-emitting electrons. The HXR-emitting electrons are trapped in the magnetic loop at least once before they precipitate into the chromosphere. The dominant microwave emission source is located at the footpoint conjugated with the HXR source, which means that these microwave-emitting electrons escape from the magnetic trap. As Takasaki et al. (2007) reported, on the other hand, the microwave footpoint emission source disappears and the dominant emission source is from the loop top during the valley times. Therefore, the gaps increase during the valley times.
4.5 Spatial Features of Spectral Index
The difference between the microwave emission sources and the HXR emission sources implies that the microwave emissions mainly come from electrons trapped magnetically within the flare loop that connects the HXR footpoint sources. Spatially resolved analyses on the spectral indices are, therefore, required for these events, to explain the reason for the certain gap of about 1.6 confirmed in current study. By using the NoRH data, we examine the spatial distribution of the spectral indices derived from microwaves, and compare the value at the footpoint ((X)) with that at the loop top ().
First, we derived the electron spectral index from NoRH microwave emission at the brightest emission positions. The brightest regions are determined to be regions where the intensities at 17 GHz are larger than 80 % of the maximum intensities, and the derived spectral index is noted as . For many cases in our results, the dominant microwave emissions are from loop tops (or legs), and show the values there. The twelfth column of Table 1 presents the list of . These items roughly correspond to those derived from the total intensity (column 8) with the displacement of about 0.5. The displacement is probably due to the spatial distribution of the spectral index. For the 2000 October 29 flare (event e), we failed to correctly derive the -map, because of a large displacement between the position of the NoRH 17 GHz emission source and that at NoRH 34 GHz. The displacement is as large as 10′′. Although the reason is unknown, it may be caused by other energy release processes that occurred in the preflare phase. We omitted this event from the further discussions.
Second, we determined the spectral index at the HXR footpoints, that is, (X) from the NoRH -map. If there are two HXR footpoint sources, we calculated them separately. For events (f) and (h), we could not, however, correctly derive the spectral index. This is because the HXR footpoint positions are too close to the loop top/leg microwave emission sources, and they are not spatially resolved. For events (a) and (b), one of the two footpoints is too close to the microwave emission source. We showed the spectral indices (X) for these footpoint sources in parentheses in the eleventh column of Table 1. The number I/II is the same as that marked for the HXR footpoints in the Figure 1. Here we have to note that the error of (X). The microwave emission from footpoints is weaker than that from loop tops/legs for most cases, and therefore, the error to estimate the spectral index (X) could be larger than that for loop top one (). We roughly expect the error to be about 0.7. Except for the 2000 April 8 flare (event c), we found the relation that the spectral indices for footpoint sources are larger, which corresponds to the softer spectra, than those at the loop tops/legs, that is, . Especially, in events (d) and (g), is quite close to the . We will discuss the spatial features of the spectral index and the relation with the magnetic field in the next section.
5 Discussion and Conclusions
We examined the electron spectral indices of nonthermal emissions seen in HXRs () and in microwaves () for 12 flares observed by Yohkoh/HXT NoRP, and NoRH. Eight flares of the selected 12 events show gaps between the spectral indices, i.e. of about 1.6. The gaps are consistent with the result of Silva et al. (2000). The other four events show larger gaps 2.7, since they suffer from softening of the HXR spectra (i.e. enlarging the HXR spectral index ) due to the super-hot thermal component even in the HXT M2 band. In spite of the fact that we examined the spectral features for the impulsive phase to avoid the effect of magnetic trapping, there still remains a certain gap. On the other hand, from the start to the peak of the HXR bursts (that corresponds from the first vertical dotted line to the thick gray line in Figure 5), both the time profile of the microwave spectral index and that of the HXR spectral index decrease simultaneously, keeping a certain gap of about 1.6.
We also investigated the positions of the emission sources by using the HXT and NoRH data. For five of the eight events, the brightest microwave emission sources are located on the loop tops (or legs; group L). On the other hand, for the other three events, they are different from the HXR emission sources, which are mainly from footpoints (group F/F∗)). This implies that the microwave emissions mainly come from electrons trapped magnetically within the flare loop that connects the HXR footpoint sources. The difference in the site of the emission sources possibly causes the gap of the spectral indices . The spatial distribution of the microwave spectral index derived from NoRH should therefore be examined. Except for one event (event c), we confirmed that the microwave spectra for footpoint sources are softer than those at the loop tops/legs, that is, . However, the spatial distribution of the microwave spectral index again cannot resolve the gap even at the sites of the HXR emission sources.
From these results, we concluded that the spectra of the accelerated electrons have a bent, and become harder above several hundreds of keV. This is also consistent with results of previous studies (Yoshimori et al., 1985; Dennis, 1988; Matsumoto et al., 2005). Minoshima et al. (2008) numerically calculated the spectral indices of microwave and HXR emissions from the trapped and precipitating electrons, and showed that a softer HXR spectrum and a hard microwave spectrum can be generated. The difference of the spectral indices 1.5, is consistent with our result. However, we showed that the spatially resolved distribution of the microwave spectral index in our study cannot resolve the gap even at the footpoint sources. This means that there still remains a certain gap .
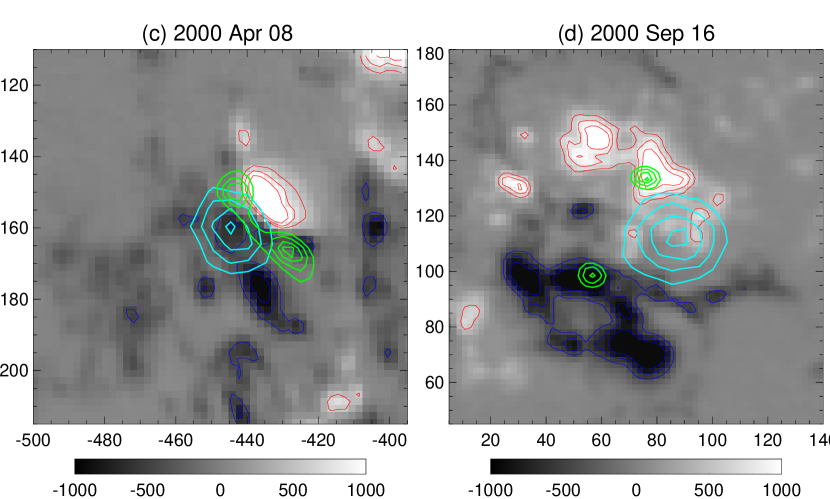
Here, we examine events (c) and (d) in more detail. Figure 6 shows the photospheric magnetograms for these events obtained by the Michelson Doppler Imager (MDI; Scherrer et al. 1995) aboard the Solar and Heliospheric Observatory (SOHO; Domingo et al. 1995). The levels of the contours are 400, 600, and 800 gauss with the red and blue lines for positive and negative magnetic polarities, respectively. We overlaid the microwave contour image of NoRH 17 GHz on each panel with light blue lines. The HXR contour image observed with HXT in the M2 band is also overlaid with green lines. The levels of these contours for both contour images are 40, 60, 80, and 95 % of the maximum intensities. From Figure 6, we clearly see weak magnetic field strength at HXR footpoints in event (c) of about 250 – 300 gauss, while there is quite a strong magnetic field in event (d) of about 900 – 1000 gauss. In event (d), therefore, we expect strong magnetic field for microwave footpoint position, and it could be several 100 gauss. The microwave gyrosynchrotron emission is strongly related to the magnetic field strength, and only high-energy electrons can contribute under the condition of weak magnetic field strength. On the other hand, with strong magnetic field, weaker energy electrons can contribute the emission. As Bastian (1999) calculated, electrons with the energy of about 500 keV contribute at 500 gauss, while the energy must be higher than 1 MeV at 200 gauss to generate 17 GHz emission. This means that low energy electrons with the energy of about several 100 keV emit the gyrosynchrotron at the footpoints. The energy of several 100 keV is as low as that for electrons emitting HXR bremsstrahlung, which causes a very soft spectrum that has the same spectral index (X) as . The magnetic field strength at the loop top must be much smaller, and the microwave-emitting electrons have high enough energy of about several MeV, at which the harder spectral component appears. On the other hand, in event (c), the magnetic field strength is weak even at the HXR footpoint sources. This means that high-energy electrons are responsible for the microwave emission even at the footpoint, which corresponds to the observed harder spectral component. From these results, we concluded that the bent of the electron spectra seems to be at about several 100 keV, which is consistent with the previous suggestions (Yoshimori et al., 1985; Dennis, 1988). In Figure 3, we cannot see the clear bent of the HXR spectra derived from WBS/HXS, and therefore, the bent of HXR spectra in the current case occurs at the energy higher than 300 keV.
References
- Bai and Ramaty (1979) Bai, T. & Ramaty, R. 1979, ApJ, 227, 1072
- Bastian et al. (1998) Bastian, T. S., Benz, A. O., Gary, D. E. 1998, ARA&A, 36, 131
- Bastian (1999) Bastian, T. S. 1999, in Proc. of the Nobeyama Symp. NRO No. 479, Ed. by T. Bastian, N. Gopalswamy, and K. Shibasaki (Nobeyama Radio Obs., Nagano, 1998), 211
- Brown (1971) Brown, J. C. 1971, Sol. Phys., 18, 489
- Cliver et al. (1986) Cliver, E. W., Dennis, B. T., Kane, S. R., Neidig, D. F., Sheeley, N. R., Jr., Koomen, M. I. 1986, ApJ, 305, 920
- Dennis (1985) Dennis, B. R. 1985, Sol. Phys., 100, 465
- Dennis (1988) Dennis, B. R. 1988, Sol. Phys., 118, 49
- Domingo et al. (1995) Domingo, V., Fleck, B., Poland, A. I. 1995, Sol. Phys., 162, 1
- Dulk (1985) Dulk, G. A., 1985, ARA&A, 23, 169
- Güdel et al. (1991) Güdel, M., Aschwanden, M. J., Benz, A. O. 1991, A&A, 251, 285
- Hoyng et al. (1976) Hoyng, P., van Beek, H. F., Brown, J. C. 1976, Sol. Phys., 48, 197
- Huang et al. (2006) Huang, G., Nakajima, H., Masuda, S., Kobayashi, K., Kubo, M. 2006, PASJ, 58, 37
- Huang & Nakajima (2009) Huang, G., Nakajima, H. 2009, ApJ, 696, 136
- Hudson et al. (1978) Hudson, H. S., Canfield, R. C., Kane, S. R. 1978, Sol. Phys., 60, 137
- Kai (1986) Kai, K. 1986, Sol. Phys., 104, 235
- Kosugi et al. (1988) Kosugi, T., Dennis, B. R., Kai, K. 1988, ApJ, 324, 1118
- Kosugi et al. (1991) Kosugi T., Makishima, K., Murakami, T., et al. 1991, Sol. Phys., 136, 17
- Kundu (1961) Kundu, M. R. 1961, J. Geophys. Res., 66, 4308
- Kundu (1965) Kundu, M. R. 1965, Solar Radio Astronomy (New York: Wiley)
- Masuda et al. (1994) Masuda, S., Kosugi, T., Hara, H., Tsuneta, S., Ogawara, Y. 1994, Nature, 371, 495
- Matsumoto et al. (2005) Matsumoto, Y., Makishima, K., Kotoku, J., Yoshimori, M., Suga, K., Kosugi, T., Masuda, S., Morimoto, K. 2005, PASJ, 57, 211
- Melnikov et al. (2002) Melnikov, V. F., Shibasaki, K., Reznikova, V. E. 2002, ApJ, 580, L185
- Melrose & Brown (1976) Melrose, D. B. & Brown, J. C., 1976, MNRAS, 176, 15
- Minoshima et al. (2008) Minoshima, T., Yokoyama, T., and Mitani, N. 2008, ApJ, 673, 598
- Nakajima et al. (1985a) Nakajima, H., Sekiguchi, H., Sawa, M., Kai, K., Kawashima, S. 1985a, PASJ, 37, 163
- Nakajima et al. (1985b) Nakajima, H., Dennis, B. R., Hoyng, P., Nelson, G., Kosugi, T. Kai, K. 1985b, ApJ, 288, 806
- Nakajima et al. (1994) Nakajima, H., Nishio, M., Enome, S., et al. 1994, Proc. IEEE, 82, 705
- Ogawara et al. (1991) Ogawara, Y., Takano, T., Kato, T., Kosugi, T., Tsuneta, S., Watanabe, T., Kondo, I., and Uchida, U. 1991, Sol. Phys., 136, 10
- Petrosian (1985) Petrosian, V. 1985, ApJ, 299, 987
- Ramaty (1969) Ramaty, R. 1969, ApJ, 158, 753
- Sakao (1994) Sakao, T. 1994, Ph.D. thesis, Univ. Tokyo
- Sato et al. (2003) Sato, J., Sawa, M., Yoshimura, K., Masuda, S., Kosugi, T. 2003, The Yohkoh HXT/SXT Flare Catalogue, (Montana State Univ., Montana; Inst. of Space and Astronautical Science, Sagamihara)
- Sato et al. (2006) Sato, J., Matsumoto, Y., Yoshimura, K., et al. 2006, Sol. Phys., 236, 351
- Scherrer et al. (1995) Scherrer, P. H., et al. 1995, Sol. Phys., 162, 129
- Shibasaki et al. (1979) Shibasaki, K., Ishiguro, M., Enome, S. 1979, Proc. Res. Inst. Atmos., 26, 117
- Silva et al. (1997) Silva, A. V. R., Gary, D. E., White, S. M., Lin, R. P., de Pater, I. 1997 Sol. Phys., 175, 157
- Silva et al. (2000) Silva, A. V. R., Wang, H., Gary, D. E. 2000, ApJ, 545, 1116
- Takasaki et al. (2007) Takasaki, H., Kiyohara, J., Asai, A., Nakajima, H., Yokoyama, T., Masuda, S., Sato, J., Kosugi, T. 2007, ApJ, 661, 1234
- Torii (1979) Torii, C., Tsukiji, Y., Kobayashi, S., Yoshimi, N., Tanaka, H., Enome, S. 1979, Proc. Res. Inst. Atmos., 26, 129
- White & Kundu (1992) White, S. M., Kundu, M. R. 1992, Sol. Phys., 141, 347
- Yoshimori et al. (1985) Yoshimori, M., Watanabe, H., Nitta, N. 1985, J. Phys. Sol. Japan, 54, 4462
- Yoshimori et al. (1991) Yoshimori, M., Okudaira, K., Hirasima, Y. 1991, Sol. Phys., 136, 69
| Data | Timea | Position | GOES | Sourcec | Hardeninge | (X) | |||||
|---|---|---|---|---|---|---|---|---|---|---|---|
| (1) | (2) | (3) | (4) | (5) | (6) | (7) | (8) | (9) | (10) | (11) | (12) |
| (a)1998 Sep 09 | 04:56:31 | 5 | S17W70 | M2.8 | L | 5.0 | 2.8 | 2.2 | 0.45 | i 3.4 (ii 2.6) | 3.1 |
| (b)2000 Jan 12 | 01:35:55* | 4 | N12E75 | M2.8 | L | 4.7 | 2.6 | 2.1 | 0.96 | i 2.7 (ii 1.9) | 2.2 |
| (c)2000 Apr 08 | 02:38:37 | 3 | S15E28 | M2.0 | L | 5.2 | 3.1 | 2.1 | 1.27 | i 1.5, ii 1.5 | 2.1 |
| (d)2000 Sep 16 | 04:13:18 | 15 | N13W05 | M5.9 | L | 4.4 | 3.6 | 0.8 | – | i 4.7, ii 3.8 | 2.8 |
| (e)2000 Oct 29 | 01:47:06 | 5 | S21E34 | M4.4 | L? | 4.5 | 3.7 | 0.8 | 1.66 | – | – |
| (f)2000 Mar 03 | 02:12:04* | 4 | S17W63 | M3.8 | F | 5.4 | 3.5 | 1.9 | 0.80 | (2.3) | 2.9 |
| (g)2000 Nov 25 | 01:21:58 | 17 | N09E46 | M8.2 | F | 3.8 | 2.4 | 1.4 | 1.38 | 2.8 | 2.1 |
| (h)2001 Mar 10 | 04:03:38 | 1 | N26W42 | M6.7 | F? | 3.9 | 2.2 | 1.7 | – | (1.5) | 1.9 |
| (i)1998 Nov 28 | 05:40:27 | 21 | N21E41 | X3.3 | – | 6.6 | 3.5 | 3.1 | – | – | – |
| (j)1999 Aug 04 | 05:49:22 | 10 | S17W61 | M6.0 | – | 6.2 | 2.9 | 3.3 | – | – | – |
| (k)2001 Mar 30 | 05:13:15 | 3 | N18W18 | M2.2 | – | 5.7 | 3.0 | 2.7 | – | – | – |
| (l)2001 Sep 25 | 04:34:36 | 0 | S21E01 | M7.6 | – | 6.5 | 3.6 | 2.9 | – | – | – |