Cosmology with large galaxy redshift surveys
Abstract
Galaxy redshift surveys are a major tool to address the most challenging cosmological problems facing cosmology, like the nature of dark energy and properties dark matter. The same observations are useful for a much larger variety of scientific applications, from the study of small bodies in the solar system, to properties of tidal streams in the Milky Way halo, to galaxy formation and evolution. Here I briefly discuss what is a redshift survey and how it can be used to attack astrophysical and cosmological problems. I finish with a brief description of a new survey, the Javalambre Physics of the Accelerating Universe Astrophysical Survey (JPAS), which will use an innovative system of 56 filters to map square degrees on the sky. JPAS photometric system, besides providing accurate photometric redshifts useful for cosmological parameter estimation, will deliver a low-resolution spectrum at each pixel on the sky, allowing for the first time an almost all-sky IFU science.
I Introduction
Galaxy redshift surveys on large areas of the sky are nowadays the astrophysical equivalent of large high-energy physics collaborations, like those built around the Large Hadron Collider at CERN. They aim to build 3-D maps of the galaxy distribution, since many astrophysical and cosmological process let their imprint in the cosmic structure traced by galaxies.
The investigation of the galaxy distribution obtained by large redshift surveys is able to deliver not only reliable estimates of cosmological parameters but, hopefully, should help to clarify the nature of dark energy and other cosmic problems, as more information is collected by new surveys, probing more deeply large areas of the sky.
Here I briefly review what are redshift surveys and what science they can address. I start with the CDM cosmology and discuss the overall agreement between this cosmological model and the observation of galaxy distribution. Then I discuss what are redshift surveys and present a quick panorama of the science they plan to address. I conclude presenting the main characteristics of the JPAS survey, conducted by a Spanish-Brazilian collaboration and that should become operational by 2013.
II Cosmology@2012
The cosmological scene in 2012 is somewhat paradoxical. The observations are consistent with an universe ruled by Einstein’s General Relativity with zero curvature and dominated by two mysterious components: dark energy and cold dark matter, contributing, respectively with 3/4 and 1/4, to the matter-energy budget required for a zero-curvature universe. The baryons of our everyday life participate in this budget with only , and other particles, like neutrinos and fotons, have a negligible contribution. And, although we do not know the nature of the dominant components, we know their quantities with high accuracy: in terms of the density parameter the amount of dark energy is and of dark matter is (Komatsu et al., 2011). This is the CDM universe.The density parameter of a given component is the ratio between the density of this component and the critical density, , where the critical density is defined as , where is the value of the Hubble constant and the gravitational constant.
Dark energy is the name of the component responsible for the acceleration of the universe. It acts like an anti-gravity. Dark matter, on the contrary, provides the gravitational seed which led to the formation of astronomical objects like stars and galaxies and is, in the largest scales, the major contributor for the gravitational pull between galaxies. The current cosmological paradigm assumes that these components control the formation and evolution of large scale structures- galaxies and groups and clusters of galaxies. Indeed, there is an excellent overall agreement between a variety of observations and cosmological simulations of a CDM universe. Observations of the cosmic background radiation with the satellite WMAP provide strong constraints on the curvature of the universe and on the amount of baryons, the latter in good agreement with estimates obtained independently from the abundance of light elements (Coc et al., 2004). Galaxy clusters provide strong evidence of dark matter, either through gravitational lensing or X-ray emission by the hot intracluster medium (e.g., Cypriano et al., 2005). It was the study of Supernovae Ia that showed that the expansion of the universe is accelerating, providing the first observational evidence of dark energy (Riess et al., 2004, 2004).
It is this very good agreement between observations and predictions of the CDM model that imposes the need of a much deeper investigation, aiming to understand the building bricks of our universe.
III The large scale structure
In scales above several thousands of parsecs the universe is populated by galaxies. Galaxies tend to cluster, due to the attractive nature of gravitation. Our galaxy, the Milky Way, is surrounded by many small satellites. Many bright galaxies are found in pairs, like the Milky Way and Andromeda in the Local Group; others are in more numerous groups, with a few dozen members. About 10% of the galaxies are in very rich structures, the clusters of galaxies, with hundreds or thousands of members within a volume not much larger than that of the Local Group. Groups and clusters themselves are clustered forming much larger structures, called super-clusters, with sizes some dozens to hundreds of times larger than the Local Group.
The knowledge of the galaxy distribution at the largest scales is a major achievement of redshift surveys like the 2dF Galaxy Redshift Survey (Colless et al., 2001) and the Sloan Digital Sky Survey (Abazajian et al., 2005). They have demonstrated that galaxies are distributed in a network of filaments and walls with galaxy clusters at their intersection. This network also contains large voids embedded, with diameters of a few dozens Mpc.
But galaxies are just the visible tracers of the dominant mass component of the universe: cold dark matter. Cold means that the velocity of the dark matter particles is non-relativistic when they were formed, just after the Big Bang. A major reason for the CDM paradigm is the strong resemblance between the observed galaxy distribution with the large scale distribution of dark matter established by numerical N-body simulations (Springel, Frenk & White, 2006). Indeed, the type of dark matter has a profound effect on the appearance of the large scales. Cold particles allow the collapse of very small structures, whereas if the universe was dominated by hot dark matter (e.g., massive neutrinos), only large objects, like superclusters and clusters, would be initially formed, and galaxies would appear later through the fragmentation of large objects.
The difference between the expected appearance of the universe in its largest scales predicted by different models actually shows how powerful is the study of galaxy distribution for unveiling some of the universe mysteries.
IV Galaxy redshift surveys
Galaxy redshift surveys are an important tool of contemporary astrophysics and observational cosmology. Their objective is to map the universe as traced by galaxies, obtaining a 3-D map of the galaxy distribution. The reason is that the cosmological parameters are imprinted in these 3-D maps, and their analysis is considered the most powerful way to address the nature of dark energy and other problems (Albrecht et al., 2006).
To make these 3-D maps we need to determine the cosmological distances of galaxies. This is usually done by measuring their spectral deviation . Due to the expansion of the universe, a foton emitted by a galaxy with wavelength is observed with wavelength . Since in general (except for some very close galaxies), the spectral deviation is usually known as the redshift. The redshift is directly related to the expansion: , where is the expansion factor (a growing function of with ). For a given cosmological model, the distance (there are several types of distances in cosmology) is a function of , only.
The overall, uniform, expansion of the universe is known as the Hubble flow, which is locally described by the Hubble law: , where is the recession velocity of a galaxy (interpreting the spectral deviation as due to the Doppler effect), is the velocity of light, and is the galaxy distance. But is also affected by the peculiar velocities, the movements produced by the gravitational interaction between a galaxy and its neighbors: . In rich clusters, for example, these velocities can achieve more than a thousand km/s. Peculiar velocities can change the value of from the value expected for a pure Hubble flow, affecting the distance estimation of nearby galaxies. It is worth mentioning that galaxies are a biased tracer of dark matter, and studies of the peculiar velocity field are a powerful way to measure this bias.
There are two ways to obtain : spectroscopy and photometry. In the first case, the measured spectrum allows the measurement of the spectral deviation of a galaxy with high accuracy (error in ). In the case of photometric redshifts, the flux in a few filters (5 for SDSS) are used as proxies for the spectra, and typical errors are much larger ((e.g., for SDSS/DR7; O’Mill et al., 2012). Despite the large errors of photometric redshifts when compared with spectroscopic redshifts, photometric surveys are often the choice because photometry is much cheaper than spectroscopy in terms of telescope time and consequently they can go wider and deeper than spectroscopic surveys. The strength of a photometric redshift survey like JPAS is that the large number of narrow filters covering the optical spectrum increases the accuracy of estimated photometric redshifts by a factor of ten when compared with SDSS results.
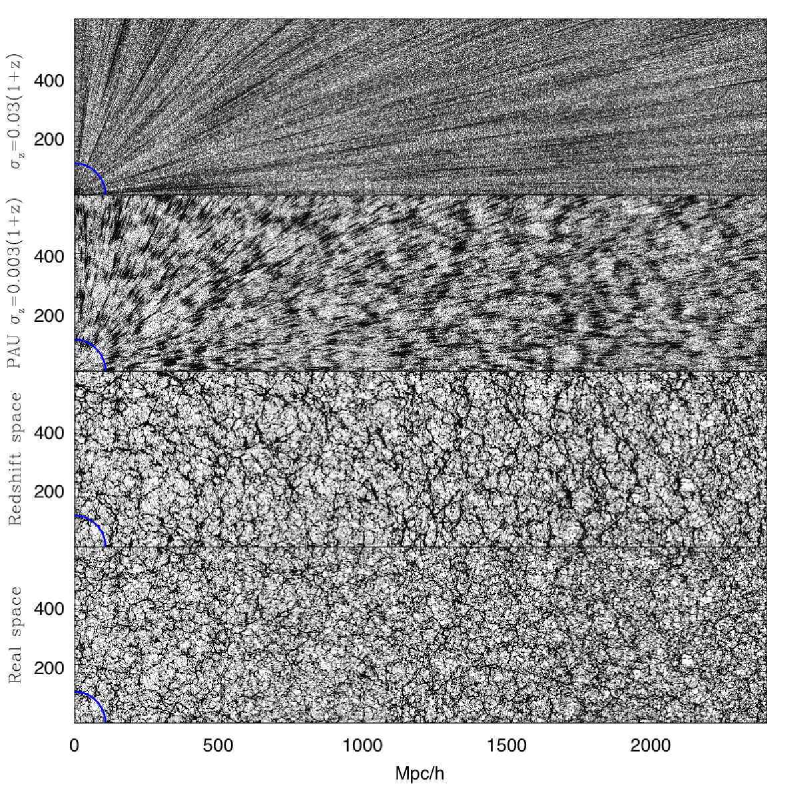
Figure 1 (Benitez et al., 2009) presents simulations illustrating the effect of the peculiar velocities and redshift measurements on the derived galaxy distribution. It also illustrates how difficult is to detect features of the galaxy distribution in the presence of large photometric redshift errors. Indeed, powerful statical methods are an essential tool for extracting useful information from photometric observations of the galaxy web. An example is the Bayesian approach to estimation of photometric redshifts (Benitez, 2000) which, by the use of prior probabilities and marginalization procedures, allows the inclusion of information often ignored by other methods, producing results of high reliability.
V Cosmology with large scale probes
The prime objective of most galaxy redshift surveys is to investigate the nature of dark energy, mainly by constraining its equation of state, . The value corresponds to a cosmological constant, which provides a good fit to the current data (Komatsu et al., 2011). But is this indeed a good model for the behavior of dark energy or does its properties vary with redshift?
To take in to account the possibility that dark energy evolves, a popular parametrization of contains a linear expansion in the scale factor of the universe : (e.g., Chevalier & Polarski, 2001), adopted by the Dark Energy Task Force (Albrecht et al., 2006) in their investigation of the best observational strategies to study dark energy.
In galaxy redshift surveys there are several probes to address dark energy properties, either based on distance-redshift relations or on the growth rate of cosmic structures. Indeed, the existence of dark energy was established though the luminosity distance-redshift relation of type Ia supernovae (Riess et al., 2004, 2004). Other canonical probes include the baryon acoustic oscillations, cosmic shear, and the abundance of galaxy clusters. These probes when combined with information obtained from the analysis of the temperature fluctuations of the cosmic microwave background (CMB) are able to impose stringent constraints on cosmological parameters (Eisenstein, Hu & Tegmark, 1999).
Baryon acoustic oscillations (BAOs) are acoustic waves produced during the radiative era by the interaction of the foton-baryon plasma with dark matter. These waves stop propagating at recombination, when the rate of Compton scattering between electrons and photons becomes too low, and have their size frozen and equal to the size of the sound horizon at that epoch, Mpc (Eisenstein & Hu, 1998). This scale can be considered a standard ruler and is imprinted in the galaxy distribution.
Since BAOs are associated with a density enhancement, they increase the probability of finding a galaxy at , which can be observed as a small excess (%) in the galaxy correlation function (e.g., Percival et al., 2010). Analysis of SDSS luminous red galaxies with an algorithm that takes in to account the effects of the peculiar velocity field (Padmanabhan et al., 2012) provides a 2% accuracy in in the local universe, . The measurement of this scale as a function of is a powerful cosmological probe and a major objective of future surveys.
It is worth mentioning that the BAO features can be measured either in the transverse or radial directions and that each of these measurements bring different cosmological information: radial BAO is directly sensitive to the Hubble parameter , whereas transverse BAO is a probe of the distance-redshift relation. Photometric redshift surveys are more sensitive to transverse BAOs, since photometric redshift errors tend to blur the radial information.
In a universe structures grow from small density fluctuations due to their gravitational atraction. Density fluctuations are usually expressed by the density contrast , where is the density in a given point and the mean matter density at that redshift. For cold dark matter, these fluctuations in scales well below the Hubble radius evolve accordingly with the equation . For small fluctuations and at high redshifts, is directly proportional to the scale factor of the universe, . This is the linear phase of growth of structures. The non-linear evolution is best studied with N-body simulations.
The largest virialized (or quasi) structures formed are the galaxy clusters. Since they are the largest structures to enter in the non-linear phase, it is assumed that their material composition is representative of the universe as a whole. The number of clusters in a given redshift and the cluster spatial correlations are strong functions of the cosmological parameters, and the cluster mass function- the number of clusters at a given redshift with mass in a certain interval- is then a powerful cosmological probe, since it depends directly on the element of volume and on the growth of structures. Massive clusters can be found in the galaxy distribution through a variety of techniques (e.g., Wen, Han & Liu, 2012). An important difficulty with this approach is the estimation of cluster masses from the photometric information (richness and/or luminosity) available in these surveys. This can be overcame through multiwavelength observations (e.g., X-rays) and/or self-calibration of the mass function (Lima & Hu, 2007) in combination with external mass inferences. Nevertheless, the results obtained up to now are consistent and highly complementary to those obtained by other probes (e.g., Vikhlinin et al., 2009).
The density fluctuations can also be studied through gravitational lensing. The ellipticities of background galaxies increase as their light travels towards the observer due to the gravitational deflection by the mass distribution along the line of sight. These optical distortions are highly correlated and are the signature of cosmic shear. The study of the cosmic shear as a function of redshift is called lensing tomography and is sensitive to cosmic expansion through both geometry and the growth rate of structures (e.g., Hu, 2002). It has the potential of becoming an important cosmological probe in many future large area surveys and, in particular, in EUCLID mission.
Gravity affects both the overall expansion and the formation and evolution of structures, but in completely different ways, what allows to use observations of the 3-D galaxy distribution to test the gravitational theory in cosmological scales. Recently, the combination of cosmic shear, galaxy clustering and structure growth rate allowed the comparison between general relativity and modified gravity theories, suggesting that general relativity is a better descriptor of the behavior of gravitation theory in large scales than some versions of alternative gravity theories (Reyes et al., 2010). Indeed, one of the classical tests of general relativity- the gravitational redshift- was recently measured in galaxy clusters (Wojtak, Hansen & Hjorth, 2011), but the large errors still precludes its use for evaluating alternative gravitation theories.
Massive neutrinos also let their imprint on the galaxy distribution. They are a kind of hot dark matter, since they are relativistic when formed. Consequently, they escape from density fluctuations and, since they carry mass, they dissipate small density fluctuations. This process, called “free streaming”, produces a cut-off in the number density of small fluctuations that can be detected in the power spectrum of the galaxy distribution and, in combination with other probes, provides strong constraints on the sum of the mass of neutrinos species. For example, analysis of the Canada-France-Hawaii Telescope Legacy Survey Wide Fields combined with WMAP7 data and a prior on the Hubble constant gives a very stringent upper limit on the sum of mass of neutrino species equal to 0.29 eV (Xia et al., 2012).
Another major scientific contribution from large scale redshift surveys is on our knowledge on how galaxies form and evolve. The reason is that the spectra or colors collected are useful to investigate the stellar populations and other galaxy properties (Cid Fernandes et al., 2005). Thanks mainly to SDSS photometric and spectroscopic surveys, much is known about the galaxy populations (e.g., stellar mass, luminosity, size, stellar populations, mean stellar ages and metallicities) and their relation with the environment, but big uncertainties remain. With CDM we expect that structures grow hierarchically, with merger of structures producing larger structures. But how does it work? Why the star formation rate start decreasing since ? How massive black holes interact with their host galaxy? In the case of Milk Way, SDSS lead to the discovery of many satellite galaxies (e.g., Belokurov et al., 2010) and tidal tails, which are snapshots of merging activity.
VI JPAS
The Javalambre Physics of the Accelerating Universe Astrophysical Survey (JPAS) is a collaboration between Spain and Brazil aiming to conduct a survey on square degrees with 54 narrow band filters and two broad band filters over the range Å to Å, with photometric depth . This innovative filter system actually provides a low resolution spectrum at each pixel on the sky and was designed to produce photometric redshifts with accuracy , about ten times better than that possible with SDSS. This survey should start in 2013 and its main part should be concluded by 2018.
The survey will be conducted from the Javalambre Astrophysical Observatory (JAO), which is being built on Pico del Buitre, near the city of Teruel, in Spain. The Sierra de Javalambre is amongst the darkest regions in Europe and has an excellent seeing, with a median of 0.71 arcsec (Moles et al., 2010). The main telescope, T250, has diameter of 2.5m and a very large field of view, 5 square degrees. It will be equipped with a 1.2 Gigapixel camera wich will be a mosaic of 14 9216 x 9232 e2v CCDs, with the 56 filters mounted in 4 trays. OAJ will also have a smaller telescope, T80, with diameter of 80cm and equipped with a 2 square degree camera for calibration of the photometric system of the survey. Since this telescope and camera will be ready for operation almost one year before the T250, we shall conduct from next year on a 5000 square degrees survey with T80: JPLUS, for Javalambre Photometric Local Universe Survey. Besides providing calibration for JPAS, JPLUS will allow us to test the scientific, technological and management system of our collaboration and will provide scientific data for many interesting projects.
The JPAS expected accuracy in photometric redshifts is enough to allow measuring BAO features also in the radial direction, what makes this photometric survey very competitive, with a DETF figure of merit above 100. We plan to measure the BAO scale above that allowed by galaxies () by using quasars (Abramo et al., 2012); these probes have number densities large enough to allow measuring BAOs up to .
Besides cosmology, JPAS will provide scientific results in many other areas: small bodies in the solar system, Galaxy archeology, galaxy evolution, quasars, clusters of galaxies. An absolutely unique aspect of JPAS is that it will allow us for the first time to do an all-sky IFU (for integral field unit) science, since JPAS will measure a low resolution spectrum at each pixel on the sky. This opens immense opportunities for studies on galaxy structure and evolution. But, besides these very competitive scientific perspectives we are pursuing, maybe the most compelling results of JPAS are still unknown, as always happens when new windows are open.
Acknowledgements.
I acknowledge the support of FAPESP and CNPq to this work.References
- Komatsu et al. (2011) Komatsu, E., 2011, ApJS, 192, 18
- Coc et al. (2004) Coc, A.; Vangioni-Flam, E.; Descouvemont, P.; Adahchour, A.; Angulo, C., 2004, ApJ, 600, 544
- Cypriano et al. (2005) Cypriano, E., et al., 2005, ApJ, 630, 38
- Riess et al. (2004) Riess, A. G., et al., 1998, AJ, 116, 1009
- Riess et al. (2004) Perlmutter, S., et al., 1999, ApJ, 517, 565
- Colless et al. (2001) Colless, M., et al., 2001, MNRAS, 328, 1039
- Abazajian et al. (2005) Abazajian, K., et al., 2005, ApJ, 625, 613
- Springel, Frenk & White (2006) Springel, V.; Frenk, C.; White, S. D., 2006, Nature, 440, 1137
- Albrecht et al. (2006) Albrecht, A., et al., 2006, Report of the Dark Energy Task Force (astro-ph/060959)
- O’Mill et al. (2012) O’Mill, A. L., et al., 2012, MNRAS, 421, 1897
- Benitez et al. (2009) Benitez, N., et al., 2009, ApJ, 691, 241
- Benitez (2000) Benitez, N., 2000, ApJ, 536, 571
- Chevalier & Polarski (2001) Chevalier, M.; Polarski, D., 2001, Int. J. Mod. Phys. D, 10, 213
- Eisenstein, Hu & Tegmark (1999) Eisenstein, D. J.; Hu, W.; Tegmark, M., 1999, ApJ, 518, 2
- Eisenstein & Hu (1998) Eisenstein, D. J.; Hu, W., 1998, ApJ, 496, 605
- Percival et al. (2010) Percival, W. J., et al., 2010, MNRAS, 401, 2148
- Padmanabhan et al. (2012) Padmanabhan, N., et al., 2012, arXiv:1202.0090
- Wen, Han & Liu (2012) Wen, Z. L.; Han, J. L.; Liu, F. S., ApJSS, 199, 34
- Lima & Hu (2007) Lima, M.; Hu, W., 2007, Phys. Rev. D, 76, 123013
- Vikhlinin et al. (2009) Vikhlinin, A. M., et al., ApJ, 692, 1033
- Hu (2002) Hu, W., 2002, Phys. Rev. D, 66, 083515
- Reyes et al. (2010) Reyes, R., et al., 2010, Nature, 464, 256
- Wojtak, Hansen & Hjorth (2011) Wojtak, R.; Hansen, S. H.; Hjorth, J., 2011, Nature, 477, 567
- Xia et al. (2012) Xia, J.-Q., et al., 2012, arXiv:1203.5105
- Cid Fernandes et al. (2005) Cid Fernandes, R., et al., 2005, MNRAS, 358, 363
- Belokurov et al. (2010) Belokurov, V., et al., ApJ, 712, L103
- Moles et al. (2010) Moles, M., et al., PASP, 122, 363
- Abramo et al. (2012) Abramo, L. R. W., et al., 2012, MNRAS, in press (arXiv:1108.2657)