Two Populations of Open Star Clusters in the Galaxy
Abstract
Based on our compiled catalogue of fundamental astrophysical parameters for 593 open clusters, we analyze the relations between the chemical composition, spatial positions, Galactic orbital elements, age, and other physical parameters of open star clusters. We show that the population of open clusters is heterogeneous and is divided into two groups differing by their mean parameters, properties, and origin. One group includes the Galactic clusters formed mainly from the interstellar matter of the thin disk with nearly solar metallicities () and having almost circular orbits a short distance away from the Galactic plane, i. e., typical of the field stars of the Galactic thin disk. The second group includes the peculiar clusters formed through the interaction of extragalactic objects (such as high–velocity clouds, globular clusters, or dwarf galaxies) with the interstellar matter of the thin disk, which, as a result, derived abnormally low (for field thin-disk stars) metallicities and/or Galactic orbits typical of objects of the older Galactic subsystems. About 70 % of the clusters older than 1 Gyr have been found to be peculiar, suggesting a slower disruption of clusters with noncircular high orbits. Analysis of orbital elements has shown that the bulk of the clusters from both groups were formed within a Galactocentric radius of kpc and closer than pc from the Galactic plane, but owing to their high initial velocities, the peculiar clusters gradually took up the volumes occupied by the objects of the thick disk, the halo, and even the accreted halo of the Galaxy. Analysis of the relative abundances of magnesium (a representative of the -elements) in clusters that, according to their kinematical parameters, belong to different Galactic subsystems has shown that all clusters are composed of matter incorporating the interstellar matter of a single protogalactic cloud in different proportions, i. e., reprocessed in genetically related stars of the Galaxy. The [Mg/Fe] ratios for the clusters with thick-disk kinematics are, on average, overestimated, just as for the field stars of the so-called ”metal–rich wing” of the thick disk. For the clusters with halo kinematics, these ratios exhibit a very large spread, suggesting that they were formed mainly from matter that experienced a history of chemical evolution different from the Galactic one. We point out that a large fraction of the open clusters with thin-disk kinematics have also been formed from matter of an extragalactic nature within the last Myr.
open star clusters, chemical composition, kinematics, Galaxy (Milky Way).
1 Introduction
In our previous paper (Gozha et al. 2012), we described the catalogue of fundamental parameters for open stars clusters that we compiled from the latest published data and discussed their errors and selection effects . We showed the chemical and kinematical properties of clusters and field thin-disk stars to differ and provided evidence for the heterogeneity of the population of open clusters in the Galaxy. In this paper, we continue a comprehensive statistical analysis of the interrelations between the physical, chemical, and spatial–kinematical characteristics of open clusters and nearby field stars in order to reveal clusters of different natures and to estimate the relative number, characteristic parameters, and patterns in the identified populations of Galactic open star clusters.
2 THE RELATION BETWEEN THE CHEMICAL COMPOSITION AND AGE OF OPEN CLUSTERS
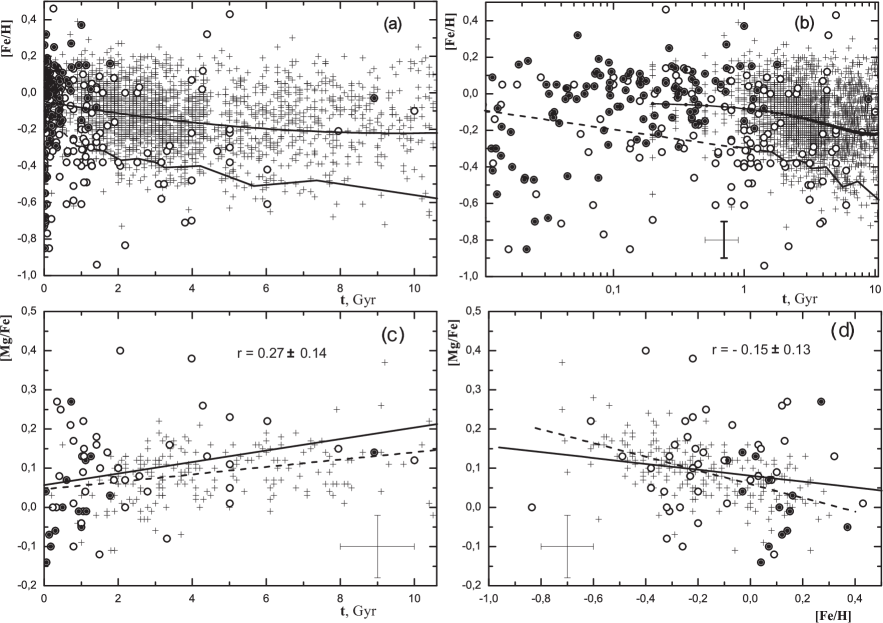
Marsakov et al. (1990) showed that the nearby field thin-disk stars and open clusters occupy slightly overlapping regions in the age–metallicity diagram and, in contrast to the field stars, a significant fraction of objects with a metallicity several times lower than the solar one are observed among clusters of any age. We will check the validity of this result based on currently available data. Since the stars that are currently located in the solar neighborhood were born at different Galactocentric distances, they reflect the chemical properties of the field thin-disk stars in a fairly wide range of distances. The mean or apogalactic radii of their orbits are most commonly assumed to be their most probable birthplaces. The mean orbital radii for the nearby field stars of our sample are 6 – 10 kpc, while the apogalactic radii for some of them reach 13 kpc (see Fig. 2c below), i. e., they are comparable to the distances to the open clusters being investigated. Therefore, we have the opportunity to compare the chemical properties of nearby stars and open clusters far from the Sun. Figure 1a presents the distributions of the open clusters from our catalogue and the nearby (within 70 pc of the Sun) field thin-disk F-G dwarfs selected into this subsystem from the catalog by Holmberg et al. (2009) based on the kinematical criteria from Koval’ et al. (2009) on the age-metallicity plane. The solid curve in the diagram indicates the cubic polynomial fit to the age-metallicity relation for the field stars (for a detailed justification and interpretation of the curve, see Marsakov et al. 2011). The curve shows that the metallicity in the thin disk has increased appreciably within the last 4 – 5 Gyr, while the mean metallicity at the initial evolutionary stages of this subsystem did not depend on the age, within the error limits. The polygonal line indicates the lower 5 % envelope for the field stars, i. e., about 5 % of the stars lie below this line in the diagram at any age. This polygonal line is almost parallel to the average relation. As we see from Fig. 1a, a significant fraction of the clusters (open circles) occupy the upper left corner in the diagram, i.e., they are young and metal-rich. The ages of the three oldest clusters and the oldest field thin-disk stars are comparable in magnitude. We also see from the figure that a significant fraction of the clusters occupy a region almost completely free from field stars in the diagram at any age. As we see, clusters with metallicities in the range that is more typical of the thick-disk stars (see, e.g., Marsakov and Borkova 2005) are being formed even at present. Note that mostly young stars are absent in our sample of F– G dwarfs, because the errors in the isochrone ages of stars lying near the zero-age main sequence are often very large and, therefore, they were not included in the sample. We extended the lower envelope toward younger ages (see the dotted line) based on our analysis of the metallicity for more massive stars, Cepheids, whose ages are within the range 50 – 300 Myr. According to the results from Andrievsky et al. (2002a), the mean metallicity of Cepheids in the solar neighborhood is and its dispersion is . Consequently, the metallicity of the 5 % lower point at zero age may be set equal to . We believe that it is the clusters lying below the polygonal line in the age-metallicity diagram rather than the clusters with the fixed limit , as was adopted by Vande Putte et al. (2010), that were formed from an interstellar medium with an appreciable admixture of matter with a different history of heavy–element enrichment. Out of the 264 clusters with known ages and metallicities, 90 clusters satisfying this criterion were found in our catalogue. In Fig. 1b, where the horizontal axis of the same diagram was transformed to a logarithmic scale, the dots inside open circles designate the clusters satisfying the criterion . We see that the overwhelming majority of such ”kinematically cold” clusters lie above the lower envelope and are younger than 1 Gyr. However, there are clusters lying below the lower envelope among them as well, with almost all of these metal–poor clusters being younger than 30 Myr. We emphasize that allowance for the radial metallicity gradient did not distort the general appearance of the age–metallicity diagram, causing only some redistribution of field stars and clusters.
Relative Magnesium Abundances.
To analyze the chemical composition differences between the clusters, we used the best-studied –element, magnesium, because it has lines of different intensities and degrees of excitation in the visible spectral range in F– G stars. In the age–[Mg/Fe] diagram (Fig. 1c), the open circles and the crosses indicate, respectively, our open clusters and the field thin–disk F– G stars from the catalogue by Borkova and Marsakov (2005). There are noticeable differences in the distributions of the field stars and clusters in the diagram, although both types of objects occupy approximately the same [Mg/Fe] range. As we see, the field stars show a clearly traceable sequence of the age–relative magnesium abundance relation. The corresponding correlation coefficients is , and the probability of chance occurrence of the same correlation coefficient for the same number of points in the diagram is %. Thus, the relative magnesium abundances in the thin–disk stars clearly increase with age. The correlation coefficient for the open clusters also turned out to be nonzero outside the error limits (, %). However, in this case, as we see, the highest ratios are observed in clusters younger than 4 Gyr, while these ratios in older clusters are considerably lower and they all lie in the band occupied by the field stars. Although there are only six clusters with such overestimated relative magnesium abundances in the diagram, they account for an appreciable fraction of all clusters with known [Mg/Fe] determinations. Therefore, it can be hypothesized that they could well be formed from matter that experienced a different history of chemical evolution than the interstellar medium of the thin disk. We also see from the figure that all ”kinematically cold” clusters (except the very old Col 261) lie in the diagram in a region that, as it were, is an extension of the sequence of field F– stars toward younger ages (designated by the dots inside circles in the diagram).
THE RELATION BETWEEN THE CHEMICAL COMPOSITION AND POSITION IN THE GALAXY.
When the evolution of elemental abundances in a stellar–gaseous system is studied, the total heavy–element abundance in the atmospheres of stars (metallicity) is most commonly used as the time axis. In this case, it is implied that in a closed system the heavy elements ejected into the interstellar medium by previous generations of stars lead to an inevitable increase in their abundances in younger stars, i. e., metallicity is a statistical age indicator. According to present views, the -elements together with a small number of iron atoms are synthesized in massive () asymptotic giant branch stars that subsequently explode as Type II supernovae (SNe II) (Arnett 1978), while the bulk of the iron–peak elements are produced during Type Ia supernova (SN Ia) explosions (Thielemann et al. 1986). Starting from the paper by Tinsley (1979), the negative trend as a function of metallicity observed in the Galaxy has been believed to be due to a difference in the evolution times of these stars. Indeed, the characteristic evolution time of SNe II is only Myr, while numerous SN Ia explosions begin only after Gyr (Matteucci and Greggio 1986; Yoshii et al. 1996). Therefore, having investigated the differences in relative –element abundances from cluster to cluster, we can attempt to ascertain how significant the genetic relationship between them is: the existence of a close correlation between metallicity and relative magnesium (a representative of the –elements) abundance in the system will provide evidence for a possible genetic relationship between the objects.
The [Fe/H]-[Mg/Fe] diagram for the open clusters (open circles) is shown in Fig. 1d. We see from this diagram that the spread in [Mg/Fe] for the clusters is much larger than that for the field thin-disk stars (crosses) at any metallicity. Therefore, the correlation for them also turned out to be insignificant (, %). However, the slope of the regression line for the clusters (solid line) was found to be the same, within the error limits, as that for the field stars (dashed line). As we see, the clusters of the kinematically cold group with known magnesium abundances (dots inside circles) lie mostly in the band occupied by the field stars (they all are equally rich in metals and, therefore, form no sequence by themselves). Note that the errors of the relative magnesium abundances in open clusters usually declared by the authors () are not much larger than those for single nearby field stars (), because the corresponding values were obtained for each cluster by averaging over several stars (for more details, see Gozha et al. 2012). Therefore, the large spread in [Mg/Fe] for the clusters cannot be attributed to their large errors. Thus, despite the large spread in relative magnesium abundances at a given metallicity, the existence of a weak correlation between [Mg/Fe] and [Fe/H] for the open clusters suggests that some genetic relationship most likely exists between the clusters.
The Radial and Vertical Metallicity Gradients
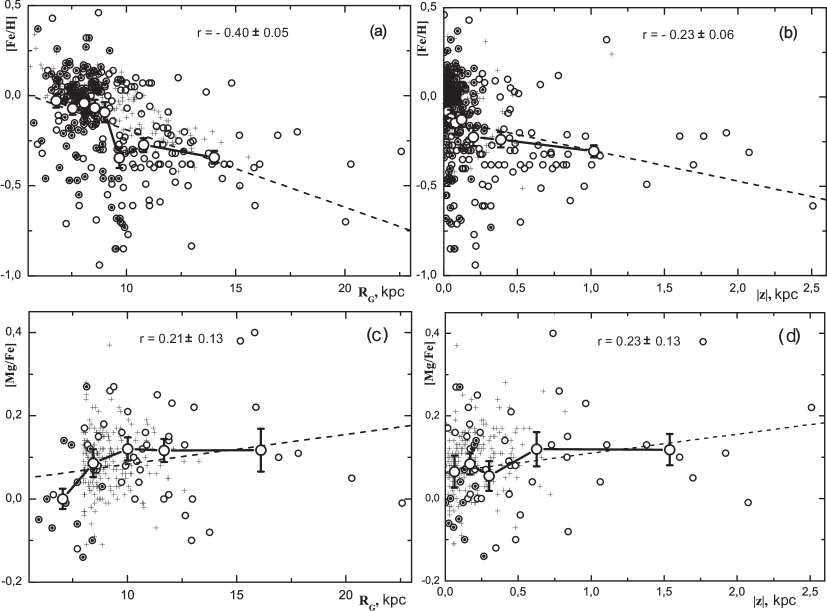
Let us now consider how the mean metallicity of the clusters changes with distance from the Galactic center, i. e., let us trace the radial metallicity gradient. Figure 2a presents the Galactocentric distance ()–metallicity diagram for all clusters of our catalogue. For a more detailed examination of the diagram, we restricted it to the range kpc, with only one cluster being to the left and three clusters reaching kpc being to the right. However, these points are taken into account in all calculations. The dashed line constructed from all of the observed open clusters is the regression line and gives a gradient kpc-1 (r = -0.40 0.05, PN ¡¡ 1other authors (see, e.g., Chen et al. 2003, 2008; Wu et al. 2009; Andreuzzi et al. 2011). The large circles designate the mean metallicities in narrow ranges, and the bars designate their rms deviations. The polygonal curve connecting these points shows the pattern of change in metallicity with distance from the Galactic center in more detail than does the regression line. We see that the mean metallicity decreases abruptly by ?[Fe/H] = -0.25 when passing through kpc, while the metallicity before and after this distance may be considered unchanged, within the error limits. The dots inside circles highlight the clusters obeying the condition ( , i. e., the ”kinematically cold” clusters. We see that the step-like pattern of the ”Galactocentric distance–metallicity” relation stems from the fact that most of such clusters turn out to be metal–rich () and to lie within 9 kpc of the Galactic center (see the concentration in the diagram), while the distant clusters turn out to be mostly less metal–rich. (However, it should be noted that since all ”kinematically cold” clusters are near the Galactic plane, they may not be identified beyond this radius due to strong interstellar extinction.) For comparison, the crosses in the diagram indicate the distant visible young thin-disk stars, Cepheids, from Andrievsky et al. (2002a - 2002c, 2004) and Luck et al. (2003). We see from the diagram that the field Cepheids form a narrow sequence and exhibit a slightly larger radial gradient than do the clusters: ( kpc-1. However, the radial gradient for the ”kinematically cold” clusters lying, just as the Cepheids, in the same narrow layer near the Galactic plane turned out to be larger than that for the Cepheids outside the error limits: kpc-1 (, % ). Note that almost all of the open clusters with ages of less than 300 Myr, i. e., as young as the Cepheids, lie within kpc of the Galactic center. They show almost the same gradient as do the ”kinematically cold” clusters: kpc-1 (, %). The older clusters exhibit a smaller gradient than do the young ones: kpc-1 (, %). Note that this result is in conflict with the steeper radial gradient usually obtained from old open clusters than that for young ones (see, e.g., Magrini et al. (2009) and references therein). The steep gradient results from the restriction of the range of Galactocentric distances by kpc, i. e., if we ignore the fact that the more distant clusters exhibit a higher metallicity than do the clusters lying in the range kpc (see Fig. 2a).
Consider the situation with the vertical metallicity gradient for the same objects. Figure 2b presents their distance from the Galactic plane (taken in absolute value)-metallicity diagrams. The regression line points to the existence of a steep negative vertical metallicity gradient for the clusters: kpc-1 (, %). Approximately the same (within the error limits) gradients are obtained for both field Cepheids and ”kinematically cold” clusters (the corresponding regression lines are not shown). However, the average line points to the existence of an abrupt decrease in metallicity by when passing through pc (although the jump here is considerably smaller in magnitude than that for the radial gradient, but, as we see from the figure, it also manifests itself outside the limits of the errors in the mean points). Just as in the preceding diagram, the concentration of points formed almost completely by the ”kinematically cold” clusters is clearly distinguished here (; pc).
Thus, the and diagrams show the same morphological structure that consists in the presence of concentrations of metal–rich clusters and abrupt decreases in metallicity when passing from these concentrations to greater distances. This most likely suggests that both negative metallicity gradients are due to the existence of two types of populations with differing metallicities and spatial distributions among the open clusters. Our checking showed that the results and conclusions also remain valid if not the present locations of the clusters but the maximum distances of their orbital points from the Galactic center and plane are used as the cluster distances from the Galactic center and plane. Recall that Yong et al. (2005) and Magrini et al. (2009) point to a decrease in the slope of the radial metallicity gradient when passing through 12 kpc. However, we believe that it is still more appropriate to talk about the metallicity jump at a shorter distance equal to kpc. This follows from the fact that, first, a similar step–like pattern is also observed for the vertical metallicity gradient and, second, both jumps are naturally explained by the same factor – the existence of two approximately equal (in number) populations of open clusters (see below).
The Radial and Vertical Gradients in Relative Magnesium Abundances Figure 2c presents the diagram for the open clusters (open circles). We see that because of the large spread in [Mg/Fe] among the clusters, the correlation between their Galactocentric positions and the magnesium abundance turns out to be insignificant (, %), although the radial gradient in relative magnetic abundance slightly differs from zero outside the error limits, ) kpc-1.(If, however, the maximum orbital radii are used for the clusters, then the gradient disappears altogether.) Because of the small number of magnesium abundance determinations in the clusters, a statistically significant existence of the jump in the relation cannot be traced, but the average line shows a clearly traceable break in the relation near kpc. Note that all ”kinematically cold” clusters exhibit low relative magnesium abundances, . No radial magnesium gradient is traceable ( %) from our sample of field thin–disk stars, which are indicated in the same panel by the crosses for comparison. Since all stars in this catalogue are nearby ones, we had to use the apogalactic radii of their orbits by assuming that they were formed precisely at these distances.
Figure 2d presents the diagram for the open clusters. The correlation here turned out to be also insignificant ( and %), although a small slope is also traceable: kpc-1. Just as in Fig. 2b, the average line here exhibits a jump, but its amplitude does not go outside the errors of the means and it is observed at a larger . For the nearby field thin–disk stars, the vertical gradient in relative magnesium abundance turns out to be slightly larger: ( kpc-1 ( and %. The ”kinematically cold” clusters that we identified show no correlation, because, on the one hand, they cannot be at large distances from the Galactic plane by definition and, on the other hand, a significant spread in relative magnesium abundances is observed among them.
THE STRATIFICATION OF OPEN CLUSTERS INTO POPULATIONS.
The Galactic field stars are known to show correlations between their spatial positions, orbital elements, chemical compositions, and ages. These correlations arose from significant differences between all of the listed parameters for four Galactic subsystems: the thin disk, the thick disk, the halo, and the accreted halo, i. e., corona (see, e.g., Marsakov and Borkova 2005, 2006a, 2006b). The first three subsystems are genetically related, i. e., their objects were formed from the interstellar matter of a single protogalactic cloud. The differences in parameters between these subsystems are attributable to the chemical and dynamical evolution of the interstellar matter of this collapsing protocloud. In contrast, the stars of the fourth subsystem were born in dwarf satellite galaxies that were subsequently disrupted under the tidal forces of the Galaxy. These stars were formed from matter that experienced chemical evolution different from the Galactic one (Marsakov and Borkova 2006b). In contrast to the field stars, all open clusters were formed from the interstellar matter of the thin Galactic disk and, thus, all of them are initially composed (at least partially) from the matter of a single protogalactic cloud. However, the properties of the open clusters described above unequivocally point to the heterogeneity of this population in the Galaxy. On the one hand, two groups can be identified among them according to their spatial-kinematical parameters. The first group includes the clusters with nearly circular orbits a short distance away from the Galactic plane (just as for the young population of the thin disk), while the second group includes the clusters with highly eccentric and high orbits typical of the thick–disk and even halo objects. On the other hand, the clusters can also be divided into two groups by the total heavy-element abundance in their stars. The bimodality of their metallicity distribution (see Gozha et al. (2012) and references therein) and their positions in the age–metallicity diagram above and below the lower envelope for the field stars (see Figs. 1a and 1b) are the main prerequisites to this division. Although the groups in metallicity and Galactic orbital elements mutually overlap, there is no close correspondence between them. Therefore, we will separate the clusters with a problematic origin independently by these two parameters. The clusters with low circular orbits (i.e., satisfying the criterion () and simultaneously lying above the lower envelope for the field stars in the age-metallicity diagram will be called Galactic or ”thin–disk” ones. Conversely, the clusters with atypically low metallicities for the thin–disk stars and the clusters with eccentric high orbits will be called peculiar ones. To this group we added 31 clusters for which no orbital elements were determined but they are currently at a distance kpc from the Galactic plane, definitely satisfying the kinematical criterion used above. By our definition, the clusters for which either the orbital elements or the metallicities were not found also fall into the peculiar group.
Out of the 264 open clusters with known metallicities, 90 turned out to have [Fe/H] atypically low for the thin–disk stars. At the same time, 30 such metal-poor clusters have kinematics like that for the thin–disk stars, while 17 clusters have orbits typical of the Galactic thick disk and halo. There are no orbital elements for 43 metal-poor clusters, but 13 of them have kpc. Twenty seven clusters with high metallicities have eccentric high orbits and 18 more clusters lie far from the Galactic plane. The peculiar group contains a total of 182 clusters. The spread in orbital parameters among the peculiar clusters turned out to be so large that we separated the clusters with characteristic (, i. e., exceeding the mean value for the group of peculiar clusters almost by , into an individual group. The bulk of the peculiar clusters constitute the ”thick-disk” group, while six clusters were separated into the individual ”halo” group – Berkeley 20, Berkeley 21, Berkeley 29, Berkeley 31, Berkeley 33, and Berkeley 99. The cluster Berkeley 29 turned out to have retrograde rotation around the Galactic center, and this unequivocally points to an extragalactic nature of the object. Clearly, the separation of clusters into the Galactic subsystems is arbitrary in the sense that these three groups only occupy the regions in the Galactic space that correspond to its subsystems of the same name. In fact, however, all of them, of course, were formed at different times in the thin disk mainly from its interstellar matter, which derived an admixture of matter with a different chemical composition and an additional momentum. The latter, on the one hand, led to star formation and, on the other hand, imparted an initial velocity to the formed cluster. Depending on the nature of the source of this momentum, the orbits and chemical compositions of the clusters will differ. The hypothesis that these clusters were formed at the maximum distances of their orbital points from the Galactic plane seems less probable, because the density of interstellar matter there is an order of magnitude lower than that within several tens of parsecs and star formation is unlikely to be possible at such a density. The membership of clusters in the ”thin–disk”, ”thick–disk”, and ”halo” populations is denoted in our catalogue by 1, 2, and 3, respectively (see Gozha et al. 2012), while the characteristic parameters for the identified populations of open clusters are listed in the table, where the number of clusters used to determine the parameters is given in parentheses.
| Parameters | Galactic | Peculiar clusters | Neaarby clusters( kpc) | ||
|---|---|---|---|---|---|
| ”thin disk” | ”thick disk” | ”halo” | ”thin disk” | ”thick disk” | |
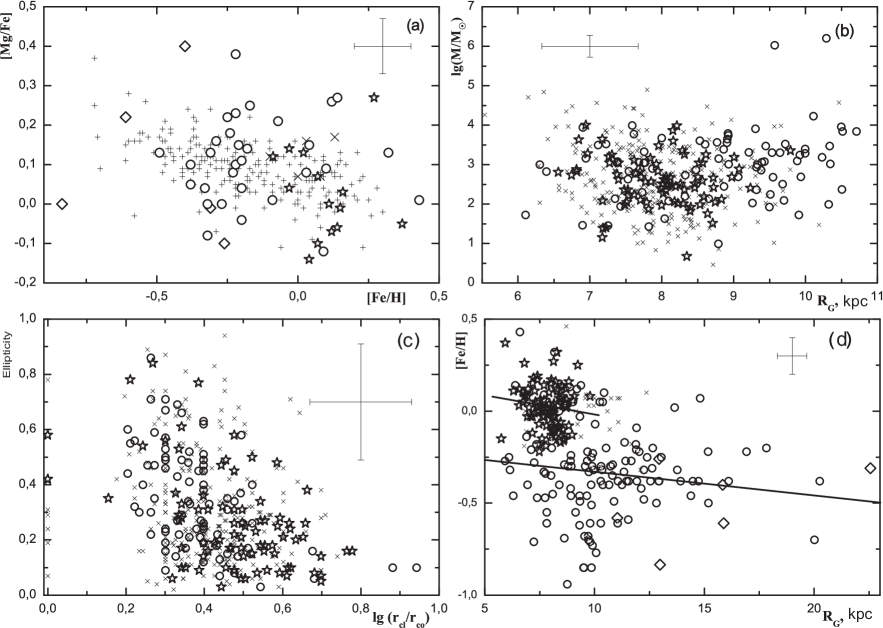
In the table, we are primarily interested not in the absolute values of the parameters but only in the comparative characteristics of the populations of open clusters, because some of these quantities can be distorted by observational selection effects. To have an idea of how strongly they affect the mean parameters, we give the corresponding quantities for the ”thin”- and ”thick-disk” clusters lying within 1 kpc of the Sun in the two extreme columns, because the selection is minimal within these limits (Piskunov et al. 2006). Taking into account the selection for distant clusters and the very low reliability of the means for nearby peculiar clusters (because of their small number), below we give only a qualitative description of the differences. Note that, according to the proposed stratification scheme, the number of peculiar open clusters in our catalogue turned out to be more than a factor of 1.5 larger than that of Galactic ones. However, such a high percentage of peculiar clusters in our sample was obtained due to the selection in favor of the clusters located at high Galactic latitudes, because the distances and metallicities are easier to determine for them. Indeed, among more than 2000 optically detected (Dias et al. 2002) open clusters, the overwhelming fraction of them lies near the Galactic plane. As a result, the actual fraction of the peculiar clusters is unlikely to exceed a third of their total number. The difference in metallicity turned out to be the expected one: the metallicity is nearly solar for the Galactic clusters, while it is approximately a factor of 2.5 lower for the ”thick–disk” clusters. At the same time, the metallicity dispersion for the second group is much greater. At such a large difference in metallicity between the groups, we obtained the explainable difference in relative magnesium abundances toward higher values for the ”thick–disk” clusters. At an even lower metallicity for the ”halo” clusters, the mean relative magnesium abundance in this group did not increase but even slightly decreased compared to the thick disk (see the distribution of clusters of different populations in Fig. 3a). The mean age and age dispersion for the ”thick–disk” clusters were found to be greater than those for the ”thin–disk” clusters outside the error limits. Note that 70 % of the clusters at Gyr are peculiar. An even greater age (and an even larger age dispersion) was obtained for the ”halo” clusters. Here, it should be remembered that the bulk of the old open clusters in each group have already been disrupted and the difference in ages points only to the degree of survivability of clusters with different orbits. The mean mass and its dispersion for the ”thick–disk” clusters turned out to be larger outside the error limits (however, the differences for nearby clusters are smaller, but these are most likely biased estimates, because there are data on the physical parameters only for ten peculiar clusters). In the RG-log(M/M ) diagram in Fig. 3b, we can not only examine the mass distributions of ”thin”- and ”thick–disk” clusters but also trace the increase in the lower mass limit as one recedes from the solar Galactocentric distance in both directions. Such a behavior implies that the higher, on average, mean mass for the peculiar clusters was obtained due to observational selection - distant low-mass clusters are harder to distinguish against the background of field stars and the distances are more difficult to determine for them. Unfortunately, there are no physical parameters for the ”halo” clusters. The mean ellipticities of the clusters in the disk populations at identical dispersions show a difference outside the error limits - the ”thick-disk” clusters turn out to be more deformed. The distributions of ”thin”- and ”thick-disk” clusters on the central concentration–ellipticity plane can be seen in Fig. 3c. The central concentrations turned out to be larger than those for the ”thin-disk” clusters outside the error limits - the corresponding distribution exhibits a clear asymmetry toward high values , i.e., dynamically, these clusters turn out to have evolved farther than the peculiar ones, although their ages are, on average, younger. The mean eccentricities of the orbits and their maximum distances from the Galactic plane as well as the corresponding dispersions are greater, outside the error limits, for the ”thick–disk” clusters. The mean values of these parameters for the ”halo” clusters are greater by several more times. This is undoubtedly a consequence of the selection into groups. However, in any case, the atypically large (for the thin Galactic disk) orbital elements for the peculiar clusters suggest a high energy of the factors that perturbed their motion. Since the clusters spend much of the time near the apogalactic radii of their orbits, it is not surprising that the mean Galactocentric distances for clusters with eccentric orbits turned out to be greater as well. The maximum in the distribution for the Galactic clusters is equal, within the error limits, to the solar Galactocentric distance, while for the peculiar clusters it is larger by almost 2 kpc (see the concentrations of the corresponding groups in Fig. 3b). The small Galactocentric distance at which the maximum density of ”thin-disk” clusters is observed in the diagram suggests that they are formed mainly within the solar circle, where the number of massive dense interstellar clouds is great (however, they may be simply invisible in the Galactic plane at great distances). At the same time, the mean ages less than those for the peculiar clusters imply that the Galactic clusters generally also live less due to the long-term destructive effect from massive clouds of interstellar gas and spiral density waves. The scale height for the ”thick-disk” clusters was found to be approximately a factor of 3.5 larger than that for the Galactic clusters and, outside the error limits, larger than that for the old ( Gyr) metal-poor () field thin–disk stars, which is pc (see Marsakov and Shevelev 1995). However, it turned out to be much smaller than that for the field thick–disk RR Lyr stars, which is kpc, but, at the same time, the mean half–thickness of the ”halo” clusters ( kpc) turned out to be even slightly larger than the scale height of the field RR Lyr stars of the Galactic accreted halo (see Borkova and Marsakov2002).
PROPERTIES OF DIFFERENT POPULATIONS OF OPEN CLUSTERS
Figure 3a presents the distributions of the ”thick”- and ”thin–disk” and ”halo” clusters as well as field Galactic–disk stars from the catalogue by Borkova and Marsakov (2005) on the [Fe/H]-[Mg/Fe] plane. As we see, the field stars show a rather narrow sequence indicative of their genetic relationship (for more details, see Marsakov and Borkova 2006a). The ”thin–disk” clusters do not go outside this sequence and, therefore, they can be assumed to be composed mainly of the matter reprocessed in previous generations of thin–disk stars, i.e., these stellar objects are genetically related. Note that we selected the clusters into this group by their orbital elements and metallicities, while here we discuss the magnesium abundance. If these clusters were formed from matter that experienced a different chemical history, then the [Mg/Fe] ratios in them could go well outside the sequence described for the field stars. As we see, the ”thick–disk” clusters lie in a slightly wider band than do the field stars and are located, on average, slightly above the sequence of field thin–disk stars. The field stars of the so-called ”metal–rich wing” () of the thick disk behave precisely in this way (see, e.g., Bensby et al. 2003; Marsakov and Borkova 2005). The ages and metallicities for these stars are the same as those for the thin–disk stars, while their kinematics is like that for the thick disk. Therefore, the debates over their origin have been conducted to the present day. The coincidence of both chemical and kinematical characteristics for the corresponding populations of clusters and field stars suggests that the field stars of the metal-rich wing of the thick disk could be the remnants of disrupted ”thick–disk” open clusters. The ”halo” clusters behave in the diagram quite differently: not only that they are, on average, less metal–rich, they exhibit a very large spread in relative magnesium abundances, with only one of the five clusters being within the band occupied by the field stars. This suggests with a high probability that they were born from matter that was genetically weakly related to the matter from which most of the thin–disk stars were formed. Having investigated the abundances of some chemical elements in five distant old open clusters (Berkeley 20, Berkeley 21, NGC 2141, Berkeley 29, Berkeley 31), Yong et al. (2005) concluded that they resulted from the stimulation of star formation by a series of captures of matter from dwarf satellite galaxies occurred in the outer Galactic disk at different times. Note that, according to our kinematical criterion, four of these clusters fell into the ”halo”, while one cluster (NGC 2141) with a slightly enhanced (compared to the field thin-disk stars) relative magnesium abundance fell into the ”thick disk”.
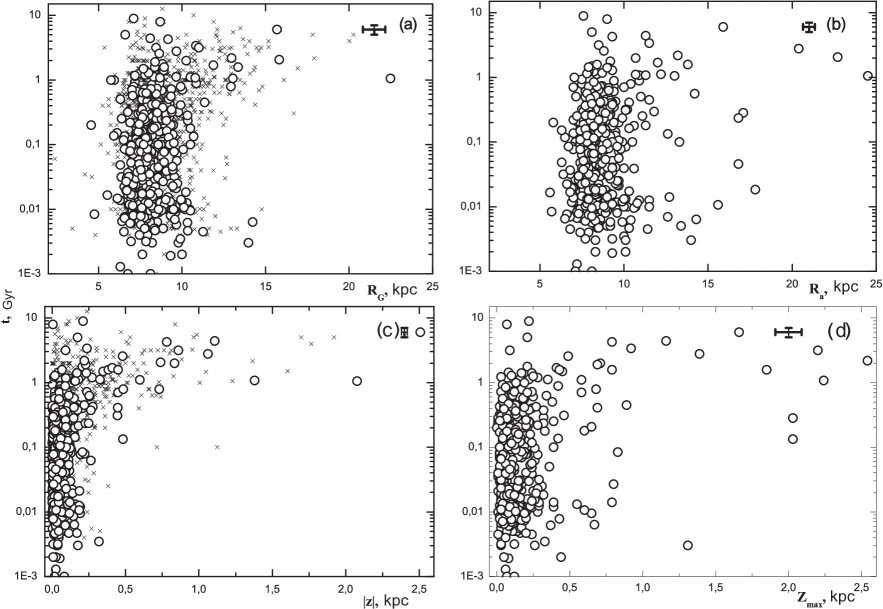
Based on the hypothesis about the dual nature of open clusters, we can naturally explain the emergence of the above-described metallicity jump when passing to more distant clusters. Figure 3d presents the diagram, in which the Galactic and peculiar clusters are marked by different symbols. Two regression lines were drawn in the diagram: one from the Galactic clusters and the other from the peculiar ones. Both correlations are insignificant, because % for both. Comparison with Fig. 2a shows that approximately the same slopes of the regression lines for each population turned out to be much smaller than those for the entire set of clusters and they are separated in metallicity by . A similar picture is also observed for the vertical metallicity gradient; in the diagram, both slopes are zero, within the error limits, while the regression lines are separated from each other in metallicity even slightly more (the corresponding figure is not shown to save space; see Fig. 2b). Two factors probably contributed to the formation of the jump-like pattern of the radial and vertical metallicity gradients: the existence of a corotation zone, which caused the chemical evolutions of the inner and outer regions of the Galaxy to be independent (see Lepine et al. 2011), and, most importantly, an active interaction of extragalactic fragments (such as high–velocity clouds, globular clusters, or dwarf galaxies) with the interstellar medium of the thin disk. The flattening of the negative radial metallicity gradient with increasing cluster age described in the Section ”The Relation between the Chemical Composition and Position in the Galaxy” can also be naturally explained in terms of the existence of two groups of open cluster populations. Indeed, as we see from Figs. 1a and 1b, the relative number of ”kinematically cold” clusters (to which all our Galactic clusters belong) progressively decreases with increasing age and, on average, a factor of 2 less metal-rich peculiar clusters constitute an increasingly large percentage (see Fig. 3d). Therefore, at an old age, the metallicity gradient is recorded only for the peculiar group of clusters, whose magnitude is appreciably smaller than that obtained from both groups together. When the evolution of the metallicity gradient is interpreted, it should be borne in mind that the age of any peculiar cluster is related to the individual capture of the extragalactic fragment that triggered local star formation by the Galaxy and not to the existence of regular star formation caused by the motion of spiral density waves. Therefore, the temporal trend of the radial metallicity gradient shown by the open clusters is an additive function of several factors: the star formation rate at different Galactocentric distances, the time of action of extragalactic objects on the interstellar medium, the open cluster disruption rates at different distances from the Galactic center and plane, and observational selection. A comparative analysis of the relations between the present positions and apogalactic orbital radii of clusters and their age can serve as a confirmation of the hypothesis that the peculiar clusters result from the action of rapidly moving extragalactic fragments on the interstellar medium. Indeed, we see from the diagram in Fig. 4a that there are only three clusters in the catalogue among the clusters younger than, say, 15 Myr and farther than kpc from the Galactic center. Since optically bright young clusters are seen far, this can be only if no clusters at all have been formed recently at great distances. Having gained a significant acceleration during their birth, the clusters that were formed near the solar circle have not yet had time to go far away. Such young clusters must have large apogalactic orbital radii, which we see in Fig. 4b, where there are more than ten and a half such clusters in the catalogue. Since the mean revolution period of the open clusters around the Galactic center is Myr and reaches 600 Myr or more for some of the peculiar clusters (see Wu et al. 2009), the clusters can in no way fill the lower right corner of the –age diagram in 15 Myr. If the clusters were born at the apogalactic radii of their orbits then the young clusters in the –age panel would be observed near precisely their Ra. The highest probability to detect them near the apogalactic radii of their orbits will also be at a steady–state random distribution of these objects in orbital phases. A similar situation is also observed when comparing the observed positions of the clusters with the maximum distances of their orbital points from the Galactic plane. We see from Fig. 4c that among the clusters younger than 15 Myr, only one is located higher than pc above the Galactic plane, while for about twenty of these young clusters exceed considerably this height (see Fig. 4d). According to the data from the catalogue by Wu et al. (2009), the mean time for a peculiar cluster crossing the Galactic plane between the opposite points and is Myr (at a maximum period of 125 Myr), i.e., several times greater than the constraint of 15 Myr adopted here. The high velocity of their passage by massive interstellar clouds and spiral arms helps such clusters to survive by being born within the solar circle, where the density of the interstellar medium is particularly high near the Galactic plane, reducing the duration of their destructive effect. In contrast, the peculiar clusters spend much of the time high above the Galactic plane and far from the Galactic center, where there are much fewer gravitational potential nonuniformities. Thus, a comparative analysis of the age dependences of the present positions of open clusters and their maximum distances from the Galactic center and plane suggests that the bulk of the clusters were formed within a Galactocentric radius of kpc and closer than pc from the Galactic plane, and only in the course of time did some of them recede to considerable distances. Thus, the causes of the formation of a particular open cluster are highly individual. This led to a wide variety of both external spatial–kinematical characteristics and internal chemical and physical parameters among them. Moreover, the difference in existence conditions led to different lifetimes of the clusters dependent on their Galactic orbital elements. As a result, all of the relations between the age, chemical composition, and spatial-kinematical characteristics observed for them turn out to be noncoincident with those for the field thin–disk stars. In other words, it is inappropriate to model the chemical and dynamical evolution of the Galactic thin disk by studying the integrated properties of open clusters whose stars account for only a small fraction of the field stars without allowance for the specific conditions of their formation and disruption. The total number of open clusters in the Galaxy is estimated to be from thirty to one hundred thousand (see Portegies Zwart et al. 2010; Piskunov et al. 2006), while we know slightly more than 2000 (Dias et al. 2002, version 3.1); the orbits were found only for of them, while the metallicities were found for fewer than three hundred clusters. Therefore, to increase the reliability of the results obtained, the estimates, and the conclusions, it is desirable to determine the required parameters for the already known clusters and to invoke the already published data on the detailed chemical composition of stars in the clusters.
ACKNOWLEDGMENTS
We are grateful to V.M. Danilov and A.V. Loktin for a preliminary familiarity with the manuscript and constructive additions. This work was supported by the Russian Foundation for Basic Research (project no. 11-02-00621 a). V.A. Marsakov also thanks the Ministry of Education and Science of the Russian Federation for partial support (project P 685).
- [1.] G. Andreuzzi, A. Bragaglia, M. Tosi, et al., MNRAS 412, 1265 (2011)
- [2.] S.M. Andrievsky, D. Bersier, V.V. Kovtyukh, et al., Astron. Astrophys. 384, 140 (2002a)
- [3.] S.M. Andrievsky, R.E. Luck, P. Martin, et al., Astron. Astrophys. 413, 159 (2004)
- [4.] S.M. Andrievsky, V.V. Kovtyukh, R.E. Luck, et al., Astron. Astrophys. 381, 32 (2002 )
- [5.] S.M. Andrievsky, V.V. Kovtyukh, R.E. Luck, et al., Astron. Astrophys. 392, 491 (2002 )
- [6.] W.D. Arnett, Astrophys. J. 219, 1008 (1978).
- [7.] T. Bensby, S. Feldsing, I. Lundstrem, Astron. Astrophys. 410, 527 (2003)
- [8.] T.V. Borkova and V.A. Marsakov, Astron. Rep. 79, 510 (2002)
- [9.] T.V. Borkova and V.A. Marsakov, Astron. Rep. 49, 405 (2005).
- [10.] D. Vande Putte, T.P. Garnier, I. Ferreras, et al., MNRAS 407, 2109 (2010)
- [11.] Z.-Yu. Wu, X. Zhou, J. Ma, et al., MNRAS 399, 2146 (2009)
- [12.] M.L. Gozha, T.V. Borkova and V.A. Marsakov, Astron. Lett. 38, 519 (2012)
- [13.] W.S. Dias, B.S. Alessi, A. Mointinho, et al., http://www.astro.iag.usp.br/wilton , Astron. Astrophys. 389, 871 (2002)
- [14.] D. Yong, B.W. Carney, M.L. Teixera de Almeida, Astron. J. 130, 597 (2005)
- [15.] Y. Yoshii, T. Tsujimoto, K. Nomoto, Astrophys. J. 462, 266 (1996)
- [16.] V.V. Koval’, V.A. Marsakov, and T.V. Borkova, Astron. Rep. 86, 844 (2009)
- [17.] R.E. Luck, W.P. Gieren, S.M. Andrievsky, et al., Astron. Astrophys. 401, 939 (2003)
- [18.] L. Magrini, P. Sestito, S. Randich, et al., Astron. Astrophys. 494, 95 (2009)
- [19.] V.A. Marsakov and T. V. Borkova, Astron. Lett. 32, 419 (2006 )
- [20.] V.A. Marsakov and T. V. Borkova, Astron. Lett. 32, 545 (2006 )
- [21.] V.A. Marsakov and T. V. Borkova, Astron. Lett. 31, 515 (2005).
- [22.] V.A. Marsakov, V. V. Koval’, T. V. Borkova, et al., Astron. Rep. 55, 667 (2011).
- [23.] V.A. Marsakov, Yu.G. Shevelev,Astron. Rep. 72, 630 (1995)
- [24.] V.A. Marsakov, A.A. Suchkov, Yu.G. Shevelev, Astrophys. Space Sci. 172, 51 (1990)
- [25.] F. Matteucci, I. Greggio, Astron. Astrophys. 154, 279 (1986)
- [26.] A.E. Piskunov, N.V. Kharchenko, S. Roser, et al., Astron. Astrophys. 445, 545 (2006)
- [27.] S. Portegies Zwart, S. McMillan, M. Gieles, Ann. Rev., 48, 431 (2010)
- [28.] F.K. Thielemann, K. Nomoto, Y. Yokio, Astron. Astrophys. 158, 17 (1986)
- [29.] B.M. Tinsley, Astrophys. J. 229, 1046 (1979)
- [30.] J. Holmberg, B. Nordstrem, J. Andersen, Astron. Astrophys. 501, 94 (2009)
- [31.] L. Chen, J.L. Hou, J.J. Wang, Astron. J. 125, 1397 (2003)
- [32.] L. Chen, J.L. Hou, J.L. Zhao, et al., A Giant Step: from Milli- to Micro-arcsecond Astrometry, IAU Symp. 248 (Ed. W.J. Jin, I. Platais, M.A.C. Perryman, Dordrecht: Kluwer Acad. Publ., 2008), p. 433