Dynamics and Accretion of Planetesimals
Abstract
In the standard scenario of planet formation, planets are formed from a protoplanetary disk that consists of gas and dust. The building blocks of solid planets are called as planetesimals that are formed by coagulation of dust. We review the basic dynamics and accretion of planetesimals by showing -body simulations. The orbits of planetesimals evolve through two-body gravitational relaxation: viscous stirring increases the random velocity and dynamical friction realizes the equiparation of the random energy. In the early stage of planetesimal accretion the growth mode of planetesimals is runaway growth where larger planetesimals grow faster than smaller ones. When a protoplanet (runaway-growing planetesimal) exceeds a critical mass the growth mode shifts to oligarchic growth where similar-sized protoplanets grow keeping a certain orbital separation. The final stage of terrestrial planet formation is collision among protoplanets known as giant impacts. We also summarize the dynamical effects of disk gas on planets and the core accretion model for formation of gas giants and discuss the diversity of planetary systems.
1 Introduction
The solar system consists of planets, their satellites, and a huge number of minor bodies (asteroids, trans-Neptunian objects, and comets). The planets can be classified into three groups: terrestrial planets (Mercury, Venus, Earth and Mars), gas giants (Jupiter and Saturn), and ice giants (Uranus and Neptune). These groups differ from one another by compositions, planetary masses, and orbital radii. The terrestrial planets are light (masses , where is the Earth mass, g), rocky ones with relatively small orbital radii ( AU, where AU is the astronomical unit that is the average distance between the sun and the Earth, cm), gas giants are heavy () planets with main components of H/He gas and –10 AU, and the ice giants are moderately massive ( with main components of H2O/CH4/NH3 ice and are in distant regions (–30 AU). These planetary orbits are nearly circular and coplanar, which suggests that the solar system was formed from a protoplanetary disk around the proto-sun.
The standard scenario for solar system formation was established in 1960’s to 1980’s.[1, 2] The basic ideas of the standard scenario are:
1) disk hypothesis: A planetary system is formed from a protoplanetary disk with mass much less than its host star’s mass,
2) planetesimal hypothesis: Building blocks of solid planets are km-sized rocky/icy “planetesimals” that are formed by coagulation of dust grains in the disk,
3) core accretion model: Gas components of gas giants are added after rocky/icy planets (cores) accrete from the planetesimals.
Though the standard scenario still has serious difficulties in formation of planetesimals from dust grains[3], discussion here starts with planetesimals, assuming that they have been formed by some mechanism. Planetesimals are bound by their self-gravity, but not by material strength. Except for the last stages of planet formation in which large planets perturb planetesimals, the relative velocities between planetesimals do not exceed the escape velocity from their surface, so collisions between them mostly result in accretion rather than bouncing or disruption. Since orbital damping timescale due to drag forces from disk gas and mean collision/close encounter timescale are much longer than orbital periods, planetesimal motion is well described by the Kepler motion in most of time. The Keplerian orbital elements such as semimajor axis, orbital eccentricity, and orbital inclination are invariable in a two-body problem. These elements are changed impulsively by occasional collisions and close encounters and gradually by gas drag, although secular changes due to secular perturbations are sometimes important.
Mass distribution of planetesimals evolves due to coagulation. While the collisional cross-section is determined by the relative velocity, the relative velocity is regulated by the mass distribution. This complicated interplay leads to the non-linear planetesimal growth. Nevertheless, these processes are better understood than planetesimal formation from dust grains and gravitational interactions between a planet and a gas disk.
Since the sun is one of G dwarf stars that commonly exist in the Galaxy and planets are considered to be by-products of star formation, it was expected that planetary systems commonly exist around other stars in the Galaxy. Although searches for extrasolar planets (planets orbiting other stars) started in 1940’s, they ended without any detection or with false detection until the end of the last century. The first extrasolar planet around a main-sequence star, 51 Peg b, was eventually discovered in 1995, by radial velocity survey detecting wobble motion of the host star due to orbital motion of a planet.[4]. The discovered planet was a gas giant of , however, its orbital radius was as small as 0.05 AU and rotates around the host star in only 4 days. Such close-in giant planets are called “hot jupiters.” As of 2012, more than 750 extrasolar planets have been discovered. In 2011, more than 2000 candidates have been identified by Kepler space telescope that detects eclipses of host stars by planets (transit survey).[5]
Most of the extrasolar planetary systems discovered so far have architectures quite different from the solar system.[6] Other than hot jupiters, many gas giants in eccentric orbits have been discovered. The origin of the diversity of planetary systems is now actively investigated.[7] Both the radial velocity and transit surveys detect planets with relatively small orbital radii. Even with such restriction, the current surveys suggest that more than 20% of solar-type stars harbor close-in rocky/icy planets of . The ubiquity of rocky/icy planets is another important subject. It is inferred that rocky/icy planets commonly exist in habitable zones that are the ranges of orbital radii where liquid water can exist on planetary surfaces. Thus, possible detection of extrasolar life, in particular, biomarkers on the extrasolar habitable planets through astronomical observations are also actively being discussed.[8]
Here we mainly describe the basic dynamical and accretionary processes of planetesimals in the standard scenario of planet formation by showing -body simulations. Planetesimal accretion that is regulated by planetesimal dynamics is an important stage of planet formation since it determines the timescale of planet formation and the basic architecture of the planetary system. We also briefly summarize the dynamical effects of disk gas on planets and the core accretion model for formation of gas giants and discuss the diversity of planetary systems, extending and generalizing the model to extrasolar planetary systems. The model of protoplanetary disks is introduced in section 2. We describe planetesimal dynamics and accretion in sections 3 and 4. The formation of terrestrial planets is presented in section 5. We introduce the current understanding of the planet-gas disk interaction and the core accretion model in section 6. Section 7 is devoted for a summary.
2 Protoplanetary Disk Model
To investigate planet formation from a protoplanetary disk, we need a model of protoplanetary disks. The standard disk model for solar system formation is the minimum-mass solar nebula (MMSN) model that is inferred from the mass distribution of planets in the present solar system in which the disk surface density (vertically integrated density) scales with the heliocentric distance as .[9]
Unfortunately current radio observations do not have enough resolutions to determine the surface density distribution of protoplanetary disks although a new large radio interferometer in Chile, ALMA, will bring us a lot of information on protoplanetary disks (e.g., Refs. \citenwd05,cea11). Thus, we adopt a generalized disk model that is based on the MMSN model. The surface density distributions of dust (rock/ice) and gas components are given by
| (1) | |||||
| (2) |
where and are multiplicative factors to scale disk surface densities of dust and gas components. The disk with corresponds to a 50% more massive MMSN model.
The step function is 1 inside the ice line and 4.2 outside . The ice line is the location where the disk temperature coincides with the condensation temperature of H2O. In this simple prescription, we set the ice line to that determined by an equilibrium temperature in optically thin disk regions[9]
| (3) |
where and are the stellar and solar luminosity, as
| (4) |
Note that the magnitude of may be modified by the local viscous dissipation and stellar irradiation. Although and are not necessarily proportional to in general, we here present results with this dependence for simplicity (for different -dependence models, see Ref.\citenki02). The total mass of MMSN within radius AU is and radio observations show that the total disk mass around young stars is distributed in a range of 0.001–.[13] So, the range of and may be 0.1–10. Hereafter we call the disk model with as the standard disk model.
The rotational angular velocity of gas taking into account the radial pressure gradient of disk gas is
| (5) |
where
| (6) |
is the sound velocity of gas, and are the Kepler angular velocity and velocity, and we used .[9]
3 Planetesimal Dynamics
The timescale of planetesimal accretion is usually much longer than that of planetesimal dynamics in which planetesimal orbits evolve by mutual gravitational interaction. Thus planetesimal dynamics controls planetesimal accretion. In this section we review the basic planetesimal dynamics due to two-body gravitational relaxation. The two basic effects of two-body gravitational relaxation in a planetesimal disk are viscous stirring and dynamical friction: viscous stirring increases the random velocity of planetesimals, while dynamical friction realizes the energy equiparation of the random energy. We also introduce the orbital repulsion of protoplanets.
3.1 Two-body relaxation
The equation of motion for a planetesimal is given as
| (7) |
where and are the mass and position of planetesimals, is the stellar mass, and is the gravitational constant. The terms on the r.h.s. express from left to right the solar gravity, the mutual gravitational interaction of planetesimals, the force from disk gas, and the velocity change by collisions. We neglect the indirect term due to planetesimals since the total mass of planetesimals is much smaller than the solar mass. For a planetesimal disk, the solar gravity is dominant except for the rare cases of close encounters of planetesimals and thus the orbit of planetesimals is almost Keplerian. The mutual gravitational interaction of planetesimals is the main perturbing force in a planetesimal disk. The effect of gas will be discussed in section 6.
The orbit of planetesimals is characterized by the semimajor axis , the eccentricity , and the inclination . The orbital eccentricity and inclination of planetesimals increase as a result of gravitational scattering among planetesimals. The deviation velocity, , of a planetesimal from the Kepler velocity of the local non-inclined circular orbit is called as random velocity, which is given by
| (8) |
The random velocity is an important factor that controls planet formation as will be shown later. For example, the growth timescale of planetesimals depends on the random velocity as when gravitational focusing is effective in collisions. Note that the thickness of a planetesimal disk is proportional to the inclination (random velocity in a vertical direction) of planetesimals.
The orbit of planetesimals gradually changes due to the mutual gravitational interaction. This process is equivalent to the two-body relaxation process in star clusters. In terms of stellar dynamics, a planetesimal disk is a collisional system like globular clusters, in the sense that the system evolves through two-body encounters.
The timescale of two-body relaxation for an equal-mass () many-body system is given by
| (9) |
where is the number density of constituent particles, is the velocity dispersion, is the gravitational radius given by , and is the Coulomb logarithm.[14] The denominator means the number of close encounters with deflection angle per unit time and takes into account the effect of distant encounters. On this timescale a particle forgets the initial orbit.
The two roles of two-body relaxation in a planetesimal disk are viscous stirring and dynamical friction. In the following, we illustrate these processes by showing examples of -body simulations. The initial conditions of planetesimals used below are summarized as follows: 1000 equal-mass ( g) planetesimals are distributed in a ring of the radius AU with width AU. The surface density of the ring is consistent with the standard disk model. The initial distributions of eccentricities and inclinations are set by the Rayleigh distributions with dispersions , where is the Hill (Roche) radius of planetesimals given by
| (10) |
The Hill radius is the radius of the gravitational potential well of a body in a rotating frame. Note that and are proportional to the velocity dispersions in radial and vertical directions, respectively, and . We set .
The basic gravitational relaxation processes such as gravitational scattering among planetesimals are scaled by the Hill units ( and ).[15]
3.2 Viscous stirring


The mutual gravitational interaction increases the random velocity of planetesimals on average. In other words, the Kepler shear velocity due to differential rotation is transfered to the random velocity. This process is called as viscous stirring.
Here we consider an equal-mass planetesimal disk for simplicity. In the dispersion-dominated regime () where the relative velocity of planetesimals is mainly determined by the random velocity, the viscous stirring rate for is given by[15]
| (11) |
We can obtain the viscous stirring rate for by replacing with in (11).
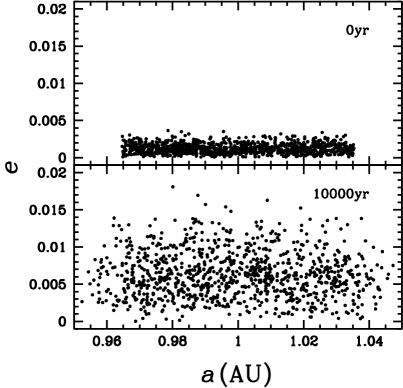
Figures 1 show the system snapshots at and 10000 year on the - and - planes. The eccentricities and inclinations of most planetesimals significantly increase in 10000 years. On average the increase of is larger than that of . The distributions of and relax into the Rayleigh distributions. We also see the diffusion of planetesimals in , which is the result of random walk in due to two-body scattering. These increases of and with the diffusion in are the basics of viscous stirring.
Time evolutions of and are shown in Figure 2. It is clearly shown that and increase with time as , and that corresponds to the anisotropic velocity dispersions in radial and vertical directions. These properties of and are the characteristics of two-body relaxation in a disk.[16]
As the number density of planetesimals is inversely proportional to the disk thickness that is proportional to the velocity dispersion, , we have . Thus, we have from (9). The origin of the anisotropy of the velocity dispersion is the shear velocity between planetesimals with different due to the differential rotation in the Kepler potential. This type of anisotropy is also known for the Galactic stellar disk.[17]
In reality the gas drag and collisions damp the random velocity of planetesimals. In planetesimal accretion, there exist equilibrium values of the eccentricity and inclination, at which viscous stirring and damping by the gas drag and collisions balance.
3.3 Dynamical friction

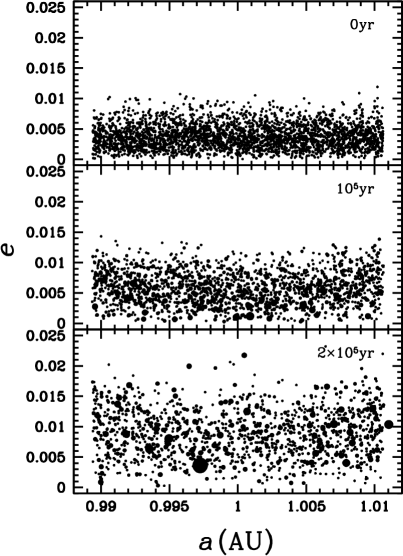
Next we consider the two-body relaxation for particles with a mass distribution. Dynamical friction is the process of the equiparation of the random energy, , of planetesimals. In other words, the random velocity becomes . As an illustration of dynamical friction, we consider a simple case with a protoplanet (large planetesimal) with embedded in a swarm of planetesimals. We focus on the orbital evolution of the protoplanet. The initial orbital elements of the protoplanet are AU and .
For and , the dynamical friction rate for is approximated as[15]
| (12) |
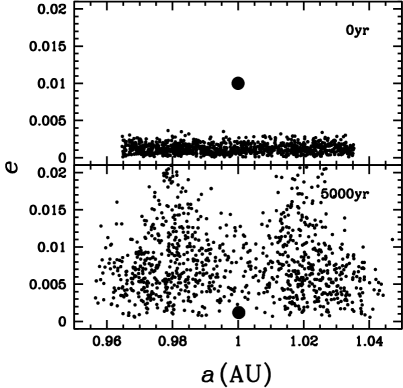
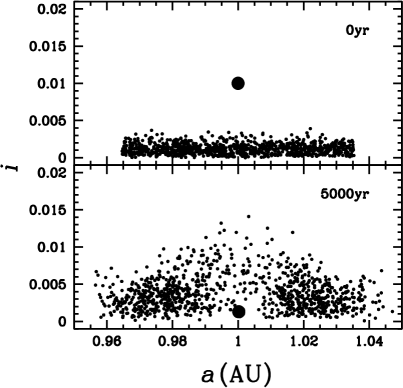
The rate for is obtained by replacing with in (12). Figures 3 show the system snapshots at and 3000 year on the - and - planes. We see that the eccentricity and inclination of the protoplanet decrease to almost 0 in 3000 years. However, its semimajor axis is kept almost constant. On the other hand, the eccentricities and inclinations of the neighbor planetesimals of the protoplanet are raised by reaction. The V-like structure around the protoplanet on the - plane corresponds to the constant Jacobi energy curve. This heating of neighbor planetesimals by a protoplanet leads to the decrease of the growth rate of the protoplanet as will be shown in section 4.3.[18]
Time evolution of and of the protoplanet is shown in Figure 4. In 3000 years, the eccentricity and inclination of the protoplanet are reduced to due to dynamical friction from small planetesimals, in other words, the orbit of the protoplanet becomes a non-inclined nearly circular orbit.
One of the important features of dynamical friction is that the dynamical friction rate does not depend on the mass of individual particles but the system density. For protoplanet-planetesimal scattering, for the protoplanet is from (9). Therefore, (12) leads to , where is the system density.
When the mass of a protoplanet is smaller than the total mass of planetesimals in its feeding zone, the recoil of planetesimal scattering damps and of the protoplanet as explained above. The recoil can also change the semimajor axis of the protoplanet under some circumstances. We comment on it in section 6, after explaining orbital migration of a protoplanet due to interactions with a gas disk.
3.4 Orbital repulsion
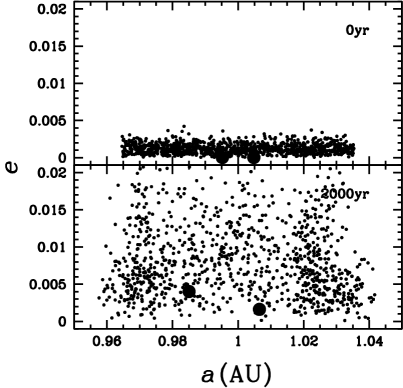
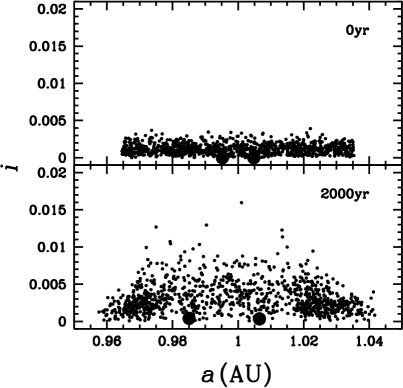
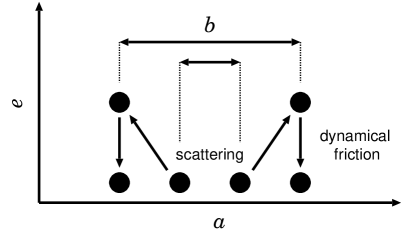
As an application of dynamical friction let us think the orbital evolution of two interacting protoplanets embedded in a swarm of planetesimals. It is found that if the orbital separation, , of the two protoplanets is smaller than a few times their mutual Hill radius, they expand their orbital separation to .[19] This phenomenon is called as orbital repulsion. In Figures 5, the protoplanets with initially on non-inclined circular orbits with the orbital separation of expands the orbital separation to keeping nearly non-inclined circular orbits in 2000 years.
The orbital repulsion is a coupling effect of gravitational scattering between large bodies and dynamical friction from small bodies. Figure 6 schematically explains the mechanism of orbital repulsion. The mechanism consists of two stages: 1) Scattering between two protoplanets on nearly circular non-inclined orbits increases their eccentricities and orbital separation. 2) Dynamical friction from planetesimals reduces the eccentricities of the protoplanets while the orbital separation remains almost the same. Thus, the orbital separation of two protoplanets increases keeping nearly circular orbits. If the orbital separation is less than , relatively strong scattering occurs and the separation expands rapidly. We can analytically show the behavior of the first stage, based on the conservation of energy and angular momentum in two-body scattering under the solar gravity.
During the course of planetesimal accretion, as protoplanets grow, their orbital separation normalized by the Hill radius decreases, since . This implies that they repeat the orbital repulsion while growing. Consequently, the orbital separation of protoplanets is kept always larger than about . This is one of the important factors that realize oligarchic growth of protoplanets. The typical orbital separation is , which only weakly depends on the mass and the semimajor axis of protoplanets and the disk surface density.[20]
4 Planetesimal Accretion
Orbiting the sun planetesimals sometimes collide with each other to form protoplanets. In this section we review the basic physics of accretionary evolution of planetesimals. Runaway growth of planetesimals and oligarchic growth of protoplanets are demonstrated by showing -body simulations.
4.1 Growth modes of planetesimals
In general, there are two major modes when particles grow by coagulation, namely, “orderly” and “runaway” growth. In the orderly growth mode, all the particles grow equally, in other words, mass ratios between particles tend to be unity. On the other hand, in the runaway growth mode, larger particles grow faster than smaller ones and their mass ratios increase monotonically. Which growth mode is relevant to planetesimal accretion had been controversial around the end of the last century.
Now we consider the evolution of mass ratio between two test particles with mass and (). The time derivative of the mass ratio is given by
| (13) |
which shows that it is the relative growth rate that determines the growth mode of particles. If the relative growth rate decreases with , is negative and the mass ratio tends to be unity. In this case, the growth mode is orderly. On the other hand, if the relative growth rate increases with , is positive and the mass ratio increases, which results in runaway growth.
The growth rate of a test planetesimal with mass and radius by accreting field planetesimals with mass () is given by
| (14) |
where is the number density of the field planetesimals, and and are the relative velocity between the test and the field planetesimals and the surface escape velocity from the test planetesimal, respectively.[21] For simplicity, we assume that all collisions lead to accretion (sticking probability is unity). Here is the collisional cross-section with gravitational focusing, which can be easily obtained using the conservation of energy and angular momentum. The term indicates the enhancement of geometrical collisional cross-section by gravitational focusing. We discuss the growth mode of planetesimals using (14) below.
4.2 Runaway growth of planetesimals

In the early stages of planetesimal accretion, the growth mode of planetesimals is runaway growth, where larger planetesimals grow more rapidly than smaller ones and their mass ratios increase with time. [22, 23, 21] We illustrate the basic processes of runaway growth of planetesimals by showing the results of -body simulation of planetesimal accretion. Figures 7 and 8 show an example of runaway growth.[24] Planetesimals are initially distributed in a ring around AU with the width AU. The planetesimal system initially consists of 3000 equal-mass ( g) bodies, which is consistent with the standard disk model. The internal density of planetesimals is gcm-3. For simplicity, the calculation in this section is gas-free.
Figure 7 shows the system snapshots on the - plane for , , and year. In years, the number of bodies decreases to 1322. It is clearly shown that a planetesimal grows in the runaway mode. At year, the mass of the largest body reaches about 200 times the initial mass, while the mean mass of planetesimals becomes only about twice larger. Note that the eccentricity and the inclination of the largest body is always kept small due to dynamical friction from smaller bodies. These small eccentricity and inclination facilitate runaway growth.[23, 25]
The evolution of the mass distribution of planetesimals is shown in Figure 8. The cumulative number of bodies against mass is plotted. The mass distribution relaxes to the distribution that is well approximated by a power-law distribution. The runaway body at year is shown by a dot that is separated from the continuous mass distribution. The mass range , which contains most of the system mass, can be approximated by . The power index calculated by using the least-square-fit method is . This index can be derived analytically as a stationary distribution.[26] The power index smaller than -2 is a characteristic of runaway growth, which means most of the system mass exists in small bodies. Note that runaway growth does not necessarily mean that the growth time decreases with mass, but does mean that the mass ratio of any two bodies increases with time. The runaway body keeps growing and then isolates from the continuous power-law mass distribution. In this stage, the runaway body predominantly grows as a sink of the mass flow from the continuous power-law mass distribution.
The runaway growth of planetesimals is explained as follows. When gravitational focusing is effective, , (14) reduces to
| (15) |
where is the surface density of planetesimals and we used , , , and . On the early stage of planetesimal accretion, and barely depend on , in other words, the reaction of growth on and can be neglected since the mass in small planetesimals dominate the system. In this case we have
| (16) |
which leads to runaway growth as shown in section 4.1.
4.3 Oligarchic growth of protoplanets
Protoplanets are formed through runaway growth of planetesimals. In the late runaway stage, protoplanets grow while interacting with one another. Kokubo and Ida[20] investigated this stage and found oligarchic growth of protoplanets: similar-sized protoplanets grow keeping their orbital separation larger than about , while most planetesimals remain small. Through oligarchic growth, a bi-modal protoplanet-planetesimal system is formed at the post-runaway stage.
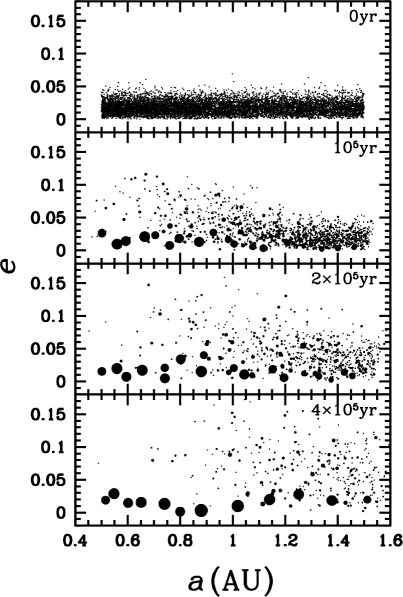
We present an example of the -body simulation that shows oligarchic growth.[12] Figure 9 shows the result of a large scale simulation starting from equal-mass (g) planetesimals in , which is consistent with the standard disk model. In this calculation, the 6-fold radius of planetesimals is used to accelerate the accretion process. The use of the 6-fold radius of planetesimals does not change the growth mode of planetesimals but shorten the growth timescale about 6 times.[21]
The accretion propagates from small to large . This is because the accretion timescale is smaller for smaller since the surface number density of planetesimals is higher and the orbital period is smaller for smaller [see (20)]. In years, the number of bodies decreases to 333. About 10 protoplanets form with mass g on nearly circular non-inclined orbits with the orbital separation of . Note that at large the protoplanets is still growing. The result of the -body simulation is consistent with the estimation based on the oligarchic growth model described below.
Oligarchic growth is the result of the self-limiting nature of runaway growth of protoplanets and orbital repulsion among protoplanets. The formation of similar-sized protoplanets is explained by the slow-down of runaway growth.[27, 18] Once the mass of the runaway body isolates from the continuous power-law mass distribution of planetesimals (see Figure 8), we can approximate the system by a two-component system: a protoplanet and small planetesimals. When the mass of the protoplanet exceeds about 100 times the typical mass of planetesimals, the protoplanet effectively heats up the random velocity of neighbor planetesimals to be .[18] In this case, from (15), the relative growth rate becomes
| (17) |
On this stage, decreases through accretion of planetesimals by the protoplanet as increases.[27] That is, the relative growth rate is a decrease function of . Thus the growth mode among protoplanets becomes orderly, in other words, the mass ratios between protoplanets tend toward unity rather than increase. Thus, the neighboring protoplanets grow keeping similar masses.
Note that still in this stage, the mass ratio of a protoplanet to its neighbor planetesimals increases since for its neighbor planetesimals with mass , , which leads to
| (18) |
The relative growth rate of the protoplanet is by a factor of larger than that of the planetesimals. Thus, a bi-modal protoplanet-planetesimal system is formed.
4.4 Isolation mass of protoplanets
As a result of the oligarchic growth of protoplanets, a protoplanet system is formed from a planetesimal disk. The dynamical characteristics of the protoplanet system are estimated based on the oligarchic growth model. In oligarchic growth, protoplanets are formed with a certain orbital separation. Given this orbital separation , the isolation (final) mass of a protoplanet at is estimated by[12]
| (19) |
and the growth timescale of the protoplanet is
| (20) | |||||
Then the growth timescale of the protoplanet to the isolation mass is given by
| (21) | |||||

Figure 10 shows the isolation mass of protoplanets against the semimajor axis for the standard disk model for solar system formation.[24] In the terrestrial planet region , which is as large as the mass of Mercury and Mars. This suggests that they are leftover protoplanets. In order to complete Venus and Earth whose masses are one order of magnitude larger than that of protoplanets, further accretion of protoplanets is necessary. In the standard scenario of terrestrial planet formation the final stage is the “giant impact” stage of protoplanets. The isolation mass of protoplanets in the gas giant region is around 5–10, which may accrete gas from the disk before the dispersal of disk gas. The mass () and orbital separation ( AU) of ice giants are consistent with the oligarchic growth model. However, their growth timescale is longer than the age of the solar system.
The oligarchic growth model of protoplanets is now generally accepted as the standard process of planet formation though it still has some discrepancies. The generalized oligarchic growth model is used to study the diversity of extrasolar planets together with the core accretion model as will be shown in section 6.2.
5 Terrestrial Planet Formation
It is generally accepted that the final stage of terrestrial planet formation is the giant impact stage where protoplanets (planetary embryos) formed by oligarchic growth collide with one another to complete planets.[28, 20] This stage is being actively studied as many small extrasolar planets are discovered.
5.1 Orbital instability of protoplanet systems

Through oligarchic growth protoplanets with orbital separation are formed from planetesimals. Though protoplanets perturb each other, the protoplanet system is orbitally stable when disk gas exists since its gravitational drag damps their eccentricities (see section 6.1). However observationally it is inferred that disk gas depletes on the timescale of 1-10 million years.[13] Thus in the long-term the protoplanet system becomes unstable through mutual gravitational perturbation after the dispersal of the gas disk.
The timescale of the orbital instability of a protoplanet system is numerically obtained by -body simulations as
| (22) |
where is the initial orbital separation of adjacent protoplanets and and are functions of the initial and of the system.[29, 30] The physical interpretation of this semi-logarithm dependence is still unclear.
Figure 11 shows the orbital instability timescale of a protoplanet system consisting 10 equal-mass (0.1) protoplanets obtained by -body simulations.[30] Here “instability” means orbital crossing or collision of protoplanets. The semi-logarithm dependence on the initial orbital separation of protoplanets is clearly shown. The constants and are smaller and larger for the larger initial and of protoplanets, respectively. With only a small initial and the instability timescale drastically shortens for large .
5.2 Giant impacts

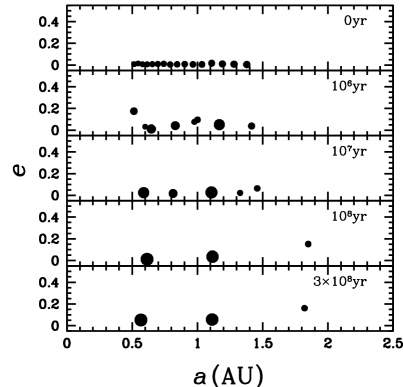
After a protoplanet system becomes orbitally unstable the giant impact stage of protoplanets begins. As this process is stochastic in nature, in order to clarify it, it is necessary to quantify it statistically. Kokubo et al.[31], Kokubo and Ida[32], and Kokubo and Genda[33] investigated the basic dynamics of the giant impact stage statistically with many -body simulations.
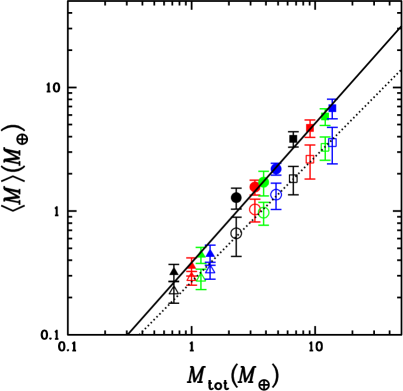
Figure 12 shows an example where three terrestrial planets are formed from 16 protoplanets.[31] In this run the giant impact stage lasts for about years. In the standard disk model, two Earth-sized planets typically form in the terrestrial planet region. Kokubo et al.[31] find that an important parameter of the initial protoplanet system for the number and mass of final planets is the total mass of protoplanets, . The effects of the surface density distribution of the disk are unified using . In Figure 13, the average masses of the largest planet and the second-largest planet are plotted against for various models of protoplanet systems with different surface densities and radial extent together with their empirical fits. It is clearly shown that both and increase almost linearly with and and . This result shows that protoplanet accretion proceeds globally, in other words, over the whole terrestrial planet region. Thus the large-scale radial mixing of material is expected.
The spin parameters of terrestrial planets are determined by the angular momentum brought by giant impacts.[32] The spin angular velocity averaged in mass bins against planet mass is shown in Figure 14a.[33] Kokubo and Genda[33] used the realistic accretion condition of protoplanets obtained by the numerical collision experiments of protoplanets.[34] It is clear that the average angular velocity is almost independent of mass. The average values are about 70% of the critical angular velocity for rotational breakup
| (23) |
This is a natural outcome for the giant impact stage where the impact velocity of protoplanets are . For an Earth-mass planet, the spin angular velocity of corresponds to the spin angular momentum of g cm2 s-1, which is 2.7 times larger than that of the Earth-Moon system. So the angular momentum of the Earth-Moon system is not a typical value but it is reasonably within the distribution of .
In Figure 14b, we show the obliquity distribution with the isotropic distribution
| (24) |
The obliquity ranges from 0∘ to 180∘ and follows an isotropic distribution. The isotropic distribution of is a natural outcome of giant impacts. During the giant impact stage, the thickness of the protoplanet system is , which is much larger than the size of protoplanets , where is the inclination of protoplanets. Thus, collisions are three-dimensional. We find that these results are independent of the initial protoplanet system parameters.
Our results clearly show that the distribution of spin obliquity is isotropic, which suggests that terrestrial planets formed through giant impacts are likely to have , in other words, their spin axes are nearly on their orbital plane. Prograde spin with small obliquity, which is common to terrestrial planets in the solar system except for Venus, is not a common feature for planets assembled by giant impacts. It should be noted, however, that the initial obliquity of a planet determined by giant impacts can be modified substantially by stellar tide if the planet is close to the star (Mercury) and by satellite tide if the planet has a large satellite (Earth).


6 Planet-Gas Disk Interaction
So far we have discussed dynamics and accretion of solid (rocky and icy) planets. In the solar system, gas giant planets, Jupiter and Saturn, exist. Since the gas giants are 100 times or more massive than terrestrial planets, the architecture of planetary systems is sculpted by the giants, if they exist in the systems. The mass of protoplanetary disks is about one order of magnitude larger than that of giant planets, which implies that planetary orbits are significantly affected by interactions with disk gas. Here we briefly summarize current understanding of planet-gas disk interactions and formation process of gas giant planets. Since distributions of gas giants in extrasolar planetary systems have been revealed by rapidly developing observations, we can compare the theoretical predictions with the observed distributions. Although some aspects of the observed distributions are explained by the theory, there still remain important unsolved problems.
6.1 Orbital evolution
While orbits of planetesimals and protoplanets can be eccentric, disk gas rotates in a circular orbit. Thereby, planet-disk interaction generally damps the orbital eccentricity of planetesimals and protoplanets. For small planetesimals, aerodynamic gas drag is dominant because the ratio of the surface area to the volume is higher for smaller bodies. On the other hand, dynamical friction from disk gas is dominant for large bodies (protoplanets) that are more massive than the lunar mass ().
The damping timescale of the relative velocity between a planetesimal (mass and physical radius ) and disk gas due to aerodynamical gas drag, in the case where Reynolds number is larger than unity, is given by[35]
| (25) |
The relative motion between a planetesimal/protoplanet and disk gas has two components: a component due to an eccentric orbit of the planetesimal () and an offset due to the pressure gradient in the gas (). Then, we have .
On a timescale of , both and are damped. Thus, eccentricity damping timescale is
| (26) | |||||
where the gas density is evaluated by divided by disk thickness , and the sound velocity is given by the equilibrium disk temperature .
The damping of causes inward radial migration of a planetesimal, because the planetesimal is subject to “head wind” to loose angular momentum, . Thus, . Since , the migration timescale is given by
| (27) |
Equations (26) and (27) show that is 2–3 orders of magnitude longer than .
The eccentricity damping timescale due to dynamical friction from disk gas is given by
| (28) |
where is the Bondi radius of the protoplanet. The last factor in the denominator is , which means that the velocity of density wave propagation is rather than , since we consider the case of . Note that the final form of is similar to (9) if is replaced by . The eccentricity damping timescale is given by[36]
| (29) | |||||
Equations (25) and (28) show that the effects of gas drag and dynamical friction are weaker for larger and smaller bodies, respectively, and -damping is the weakest for at AU. The -damping timescale even for bodies with is shorter than the disk lifetime million years. While the eccentricities of small planetesimals are excited by nearby protoplanets, allowing mutual collisions and accretion by the protoplanets, the eccentricities of the protoplanets are not excited, so that protoplanet-protoplanet collisions are generally inhibited in the presence of gas.
Although planet-disk gravitational interactions are much more complicated than aerodynamical gas drag, the timescale of radial migration due to dynamical friction is evaluated in a similar way as
| (30) |
This migration is often called “type-I migration.” Tanaka et al.[37] derived a numerical factor for (30) through detailed 3-D linear calculation, taking into a curvature effect (geometrical imbalance between the effects from inner and outer disks). With the numerical factor, (30) is
| (31) | |||||
The migration timescales for an Earth-mass planet at 1AU and a core of at 5 AU are years, which are 10–100 times shorter than disk lifetime, suggesting that the Earth and Jupiter’s core cannot survive. This is one of the most serious difficulties in planet formation theory today. On the other hand, discovery of many close-in planets in extrasolar planetary systems requires this kind of inward migration. Many possibilities to retard, halt or reverse the migration are discussed, although the mechanism for planets to survive type I migration has not been identified yet.
Orbital migration of protoplanets due to planetesimal scattering (gravitational interactions with a planetesimal disk) also exists, as pointed out in section 3.3. Although there is no systematic effect like in the gas disk, a curvature effect still exists. While , is generally larger than the velocity dispersion of planetesimals, so that “planetesimal-driven migration” cannot be always neglected compared with type I migration.[38] However, the migration speed and direction have not been clarified yet.
6.2 Formation of gas giants
For the formation of gas giant planets, two models have been proposed. In the “core accretion” model, a rocky/icy core first accretes from planetesimals and gas accretion onto the core follows.[39, 40] In the “disk instability” model, on the other hand, a protoplanetary disk fragments due to gravitational instability to directly form a gas giant(s).[41] Since rocky/icy planets cannot be formed by the disk instability and even Jupiter and Saturn are metal-rich compared to the solar composition, the core accretion model has been regarded as a “standard” model. Here, we summarize the core accretion model. Note that a possibility of disk instability is now being revisited, because extrasolar gas giants with large orbital radii, which are not easy to be formed in situ through the core accretion, are being observed by direct imaging.
When the core mass becomes larger than a critical core mass, pressure gradient no more supports envelope gas hydrodynamically against the core’s gravity and hydrostatic envelope no longer exists. The critical core mass () depends on planetesimal accretion rate onto the core () and the grain opacity in the envelope (). Through 1-D calculation, Ikoma et al.[42] found that
| (32) |
where is the grain opacity given by Pollack et al.[43], who assumed dust grains with interstellar abundance and size distributions. Faster accretion and higher opacity (relatively large and ) result in a warmer planetary envelope and enhanced pressure gradient, so that increases.[44, 42]
After exceeds , heat generation due to gravitational contraction of gas envelope itself supports the envelope against dynamical collapse and the envelope undergoes quasi-static contraction.[40] The contraction allows disk gas to flow from the protoplanetary disk into the Bondi radius of the planet, so that the contraction rate determines the rate of gas accretion onto the planet.
Although the rate of the quasi-static contraction of envelope should be evaluated by radiative transfer calculation, we here present a simple estimate for the rate.[45] For , heat generation due to planetesimal accretion marginally equilibrates with the gravity of the core. In the quasi-static envelope contraction, heat generation due to the envelope contraction marginally equilibrates with the gravity of the planet. Replacing and in (32) by (total mass of the core and envelope) and , the gas accretion timescale is given by
| (33) |
Detailed radiative transfer simulations[42, 46] showed consistent results.
Since rapidly decreases with increasing , the gas accretion is a runaway process and initial contraction regulates the total gas accretion timescale. Equation (33) shows that for gas accretion to start the runaway gas accretion within disk lifetime () of 1-10 million years, the core mass more than a few to ten Earth masses is required for .
6.3 Formation sites of cores
Using the results in section 4.4 and 6.2, we can quantitatively determine the formation sites of cores with a few or more, neglecting type-I migration, which is highly uncertain. We consider a conservative condition for formation of gas giants such that . In the following we use , g cm-3, and g.
In the inner regions, cores acquire the isolation mass given by (19), which shows that only at where
| (34) |
where we assumed . This equation shows that preferred locations of cores for giant planets are the regions beyond the ice line (), although formation of large cores is possible even inside the ice line for the most massive disks with .
On the other hand, in outer regions, core growth is so slow that the core mass does not reach the isolation mass before the depletion of disk gas. Then, the condition for formation of cores with larger than is , where we assume million years and is given by (20). This condition imposes an outer limit of the semimajor axis () for formation of gas giants:
| (35) |
where solar abundance, , is assumed. Formation of cores for gas giants is possible in the regions with .
6.4 Diversity of planetary systems
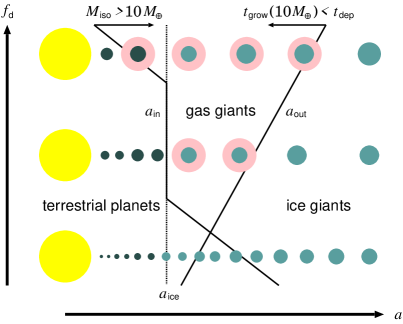
Using the results in the last subsection, we discuss the diversity of planetary systems.[12, 7] (Figure 15). We now know that within only at . In low-mass disks for which , gas giants are not formed. Equations (34) and (35) suggest that formation of gas giants is not expected in disks with (disks with masses smaller than the mass of the standard disk). On the other hand, in high-mass disks, it is expected that multiple gas giants are formed since the range between and is broad. The multiple giants often undergo close scattering among them, resulting in formation of gas giants in eccentric orbits that are found in extrasolar planetary systems. In massive disks, cores and gas giants form early enough when full amount of disk gas still exists. Then, the gas giant that has opened up a gap in the gas disk would migrate together with disk accretion (type II migration)[47, 48] to the vicinity of the host star. Thus, initial disk masses would produce diversity of planetary systems.[7]
Gas accretion rate onto the core and the mechanism to stop gas accretion are being discussed by many authors, as well as realistic type I migration rate. Although these processes sill have large uncertainties, the planetesimal dynamics and accretion described here are relatively well understood and they are fundamental pieces for discussion on formation of planetary systems.
7 Summary
In the standard scenario of planet formation terrestrial and icy planets and cores of gaseous planets are formed by accretion of planetesimals. The random velocity (eccentricity and inclination ) of planetesimals controls planetesimal accretion and then growth of planetesimals changes the random velocity of planetesimals. This interplay of planetesimal dynamics and accretion show interesting phenomena of planetesimal accretion. We have demonstrated the basic dynamical and accretionary processes of planetesimals by showing the examples of -body simulations.
In orbital evolution of planetesimals two-body gravitational relaxation plays key roles. The important basic processes are viscous stirring and dynamical friction. Viscous stirring increases dispersions and in proportion to time as , keeping the ratio , which is the characteristics of two-body relaxation in a Keplerian disk. Dynamical friction realizes the equiparation of the random energy, in other words, . Orbital repulsion of two protoplanets embedded in a swarm of planetesimals keeps the orbital separation of the two protoplanets . Orbital repulsion is one of the key processes that realize the oligarchic growth of protoplanets. All these elementary processes control the basic mode, timescale, and spatial structure of planetesimal accretion.
On the early stage of planetesimal accretion the growth mode of planetesimals is runaway growth where larger planetesimals grow faster than smaller ones. This is due to gravitational focusing that enhances the collisional cross-section of planetesimals by the self-gravity. The mass distribution of planetesimals is well approximated by a power-law distribution of , where for small bodies, and detached runaway bodies. Once the mass of a protoplanet (runaway-growing body) exceeds a critical mass, it effectively heats up the random velocity of local planetesimals, which results in orderly growth among protoplanets. Then orbital repulsion between adjacent protoplanets keeps their orbital separations . This growth mode is called as oligarchic growth of protoplanets where similar-sized protoplanets predominantly grow with certain orbital separations. These processes of planetesimal dynamics and accretion are relatively well understood and are now incorporated into the standard model of planet formation.
The final stage of terrestrial planet formation is known as giant impact stage. A protoplanet system becomes orbitally unstable after dispersal of disk gas on the timescale where is the initial orbital separation of protoplanets and and are functions of the initial and and then the giant impacts of protoplanets start. On this stage accretion proceeds globally and the total mass of protoplanets is a key parameter that determines the mass of planets. The masses of the largest and the second-largest planets increase with almost linearly. The spin parameters of planets are determined by giant impacts. The RMS spin angular velocity is as large as 70% of the critical spin angular velocity for rotational instability. The obliquity of the planets follow an isotropic distribution.
We also discussed the orbital evolution of planets by the planet-gas disk interaction. The core accretion model for gas giant formation is summarized and used to discuss the diversity of planetary systems.
As we have shown, planet formation consists of multi-scale, multi-layer processes regulated by a variety of physics. Some of fundamental processes are still unclear, in particular, formation of planetesimals from dust and orbital migration of (proto)planets. Both processes are regulated by structure and evolution of a protoplanetary disk. We hope ALMA will reveal detailed structure/evolution of protoplanetary disks. The diversity of observed extrasolar planets suggests that secular gravitational perturbations among planets also play an important role in creating the architecture of planetary systems. We need to deeply explore secular orbital dynamics as well as planet-disk interactions to understand the diversity of planetary systems. We can calibrate theoretical models by using the data of rapidly developing observations of extrasolar planets. In the theoretical model of planet formation, there are many unsolved problems related with many different kinds of physics. However, we already have tools to attack the problems. Studies on planet formation is now on an exciting, rapidly developing stage.
References
- [1] V. S. Safronov, Evolution of the Protoplanetary Cloud and Formation of the Earth and the Planets (Nauka, Moscow, 1969).
- [2] C. Hayashi, K. Nakazawa and Y. Nakagawa, in Protostars and Planets II, ed. D. C. Black and M. S. Matthew (Univ. Arizona Press, Tucson, 1985), 1100.
- [3] E. Chiang and A. N. Youdin, \JLAnnual Review of Earth and Planetary Sciences,38,2010,493.
- [4] M. Mayor and D. Queloz, \JLNature,378,1995,355.
- [5] N. M.Batalha et al., submitted (arXiv1202.5852B).
- [6] D. C. Fabrycky et al., submitted (arXiv1202.6328).
- [7] S. Ida and D. N. C. Lin, \AJ673,2008,487.
- [8] V. Meadows and S. Seager, in Exoplanets, ed. S. Seager (Univ. Arizona Press, Tucson, 2010), 441.
- [9] C. Hayashi, \PTPS70,1981,35.
- [10] S. Wolf and G. D’Angelo, \AJ619,2005,1114.
- [11] L. I. Cleeves et al., \AJ743,2011,L2.
- [12] E. Kokubo and S. Ida, \AJ581,2002,666.
- [13] S. V. W. Beckwith and A. I. Sargent, \JLNature,383,1996,139.
- [14] J. Binney and S. Tremaine, Galactic Dynamics (Princeton Univ. Press, Princeton, 1987).
- [15] S. Ida, \JLIcarus,88,1990,129.
- [16] S. Ida, E. Kokubo and J. Makino, \JLMon. Not. R. Astron. Soc.,264,1993,875.
- [17] E. Kokubo and S. Ida, \JLPubl. Astron. Soc. Jpn.,44,1992,601.
- [18] S. Ida and J. Makino, \JLIcarus,106,1993,210.
- [19] E. Kokubo and S. Ida, \JLIcarus.,114,1995,247.
- [20] E. Kokubo and S. Ida, \JLIcarus,131,1998,171.
- [21] E. Kokubo and S. Ida, \JLIcarus,123,1996,180.
- [22] R. Greenberg, J. Wacker, C. R. Chapman and W. K. Hartman, \JLIcarus,35,1978,1.
- [23] G. W. Wetherill and G. R. Stewart, \JLIcarus,77,1989,330.
- [24] E. Kokubo and S. Ida, \JLIcarus,143,2000,15.
- [25] S. Ida and J. Makino, \JLIcarus,98,1992,28.
- [26] J. Makino, T. Fukushige, Y. Funato and E. Kokubo, \JLNew Astron.,3,1998,411.
- [27] J. J. Lissauer, \JLIcarus,69,1987,249.
- [28] G. W. Wetherill, \JLScience,228,1985,877.
- [29] J. E. Chambers, G. W. Wetherill and A. P. Boss, \JLIcarus,119,1996,261.
- [30] K. Yoshinaga, E. Kokubo and J. Makino, \JLIcarus,139,1999,328.
- [31] E. Kokubo, J. Kominami and S. Ida, \AJ642,2006,1131.
- [32] E. Kokubo and S. Ida, \AJ671,2007,2082.
- [33] E. Kokubo, H. Genda, \AJ714,2010,L21.
- [34] H. Genda, E. Kokubo and S. Ida, \AJ744,2012,137.
- [35] I. Adachi, C. Hayashi and K. Nakazawa, \PTP56,1976,1756.
- [36] H. Tanaka and W. R. Ward, \AJ602,2004,388.
- [37] H. Tanaka, T. Takeuchi and W. R. Ward, \AJ565,2002,1257.
- [38] C. W. Ormel, S. Ida, H. Tanaka, \AJ758,2012,80.
- [39] H. Mizuno, \PTP64,1980,544.
- [40] P. Bodenheimer and J. B. Pollack, \JLIcarus,67,1986,391.
- [41] A. P. Boss, \JLScience,276,1997,1836.
- [42] M. Ikoma, K. Nakazawa and H. Emori, \AJ537,2000,1013.
- [43] J. B. Pollack, C. P. McKay and B. M. Christofferson, \JLIcarus,64,1985,471.
- [44] D. J. Stevenson, \JLPlanetary and Space Science,30,1982,755.
- [45] M. Shiraishi and S. Ida, \AJ684,2008,1416.
- [46] M. Ikoma and H. Genda, \AJ648,2006,696.
- [47] D. N. C. Lin and J. C. B. Papaloizou, in Protostars and Planets II, ed. D. C. Black and M. S. Matthew (Univ. Arizona Press, Tucson, 1985), 981.
- [48] D. N. C. Lin and J. C. B. Papaloizou, in Protostars and Planets III ed. E. H. Levy and J. I. Lunine (Univ. Arizona Press, Tucson, 1993), 749.