Top Quark Properties
Abstract
I review the latest results on properties of the top quark from the Tevatron and the LHC, including results measured in and single-top events on the mass, width, couplings, and spin correlations.
1 Introduction
With results from almost 9 fb-1 of collisions at TeV at the Tevatron, and up to 5 fb-1 of collisions at TeV at the LHC, measurements of top-quark properties are becoming quite precise. I will review the latest (as of early September, 2012) results from D0 and CDF at the Tevatron and CMS [1] and ATLAS [2] at the LHC. These results include the top quark mass and width, the and mass difference, top quark couplings, and spin correlations. The top quark charge asymmetry is covered elsewhere [3]. The event selection and background evaluation are also covered elsewhere [4].
2 Top Quark Mass Measurements
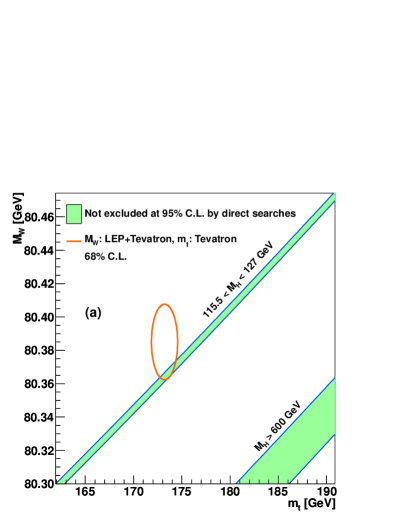
The top quark’s mass, , is its most fundamental property. It is also the most precisely measured property. Besides being a free parameter in the Standard Model, the importance of the top quark mass measurements stems from its role in electroweak radiative corrections which yield a quadratic dependence of the boson mass, , on , while only depends logarithmically on , the mass of the Higgs boson. Precision measurements of and therefore probe the Standard Model Higgs boson mass, as shown in Figure 1, and with a precise measurement of the Higgs boson mass probe the consistency of the Standard Model itself.
The measurement of involves a number of challenges. The top quark decays almost 100% of the time to a boson and a quark. The final state, with each boson decaying to or , involves six partons, and these must be identified in the selected events and properly assigned to the two bosons and the and quarks. In addition to the parton assignment, the best possible energy and momentum resolution must be achieved for each, and here the jet energy scale (JES) is of paramount importance.
A large number of techniques have been used over the years for measuring . Here I will discuss only those used in a few of the most recent results.
2.1 CDF Measurement in lepton+jets
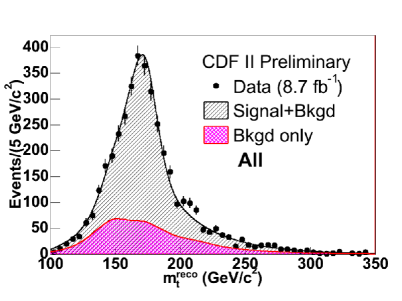
The CDF collaboration has recently released a measurement in 8.7 fb-1 of collisions at in the lepton+jets channel using a template fitting technique [6]. A minimization is used to assign measured objects to final-state partons. The reconstructed top mass is a free parameter in the , with the constraint that , and the includes resolution terms that allow the measured for each object to vary. The is minimized with respect to and the distribution of values over the ensemble of events is fit to Monte Carlo templates for the distribution of as a function of the true top mass. The JES uncertainty is controlled by a simultaneous fit of from the hadronically decaying boson to the known boson mass. The result, shown in Figure 2, is
The uncertainty due to JES is included as a statistical uncertainty here due to the fit. This is the most precise single measurement of the top-quark mass to date.
2.2 D0 Measurement in Dileptons
The D0 collaboration has recently measured the top mass in 5.3 fb-1 in the dilepton channel (, , ) [7]. In this channel there are two unobserved neutrinos, resulting in a kinematically under-constrained system. To address this problem three additional constraints are needed. Two are given as follows:
There are a number of different choices for imposing the third constraint. In this measurement an integration is performed over the pseudorapidity of both neutrinos, and . At each the neutrino momenta are calculated and from them the missing . A weight is assigned based on the agreement between the calculated and measured missing , and the missing resolution. Figure 3 shows the maximum likelihood fit to the weight distribution from which the top mass is extracted. The result is

2.3 Tevatron Top Mass Combination
The CDF and D0 collaborations have combined a variety of different measurements of the top quark mass using integrated luminosities up to 5.8 fb-1 [5]. The combination does not yet include the latest results, such as those described in Sections 2.1. Figure 4 shows the measurements used in the combination. Taking into account correlations in the systematic uncertainties between the different measurements, the combined top mass value is found to be
The top mass measured from Tevatron data has a precision of 0.54%. A remarkable achievement.

2.4 ATLAS & CMS Top Mass Measurements
At the LHC at TeV the production cross section is roughly 20 times what it is at the Tevatron. Both ATLAS and CMS have taken advantage of the large number of top quarks to employ new techniques for measuring . Using lepton+jets events, the ATLAS collaboration uses the three jets from hadronic-side top decay to form the per-event ratio [8], defined as
The jet triplet () assigned to the hadronic top decay is selected by maximizing a kinematic likelihood. The two jets assigned to the decay () are constrained to in the likelihood and the JES uncertainty is controlled through the ratio. The top mass is extracted through a maximum likelihood fit of templates determined from Monte Carlo simulation for a range of values. Figure 5 shows the template fit result in the +jets channel in 1.04 fb-1 of data at =7 TeV.

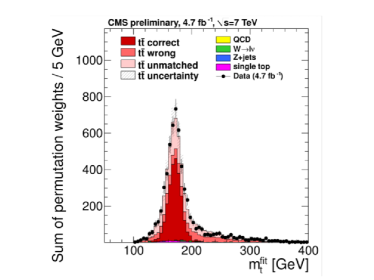
An alternate “2-D” method is used by both ATLAS [8] and CMS [9]. In the 2-D method and are measured simultaneously (instead of only in ratio). ATLAS does a simultaneous template fit to the best assignment, defined as the highest triplet made from a -tagged jet and light-jet pair with invariant mass between 50 GeV and 100 GeV. In contrast, CMS uses an ideogram method in which all jet-parton pairings are used with a weight given by the probability, from Monte Carlo simulation, of the pairing being correct. In both cases the JES is determined by fitting to . The distributions of reconstructed are fit to templates. The results are shown in Figure 6.

ATLAS, in 1.04 fb-1 of data at TeV measures
and CMS in 4.7 fb-1 of data at TeV measures
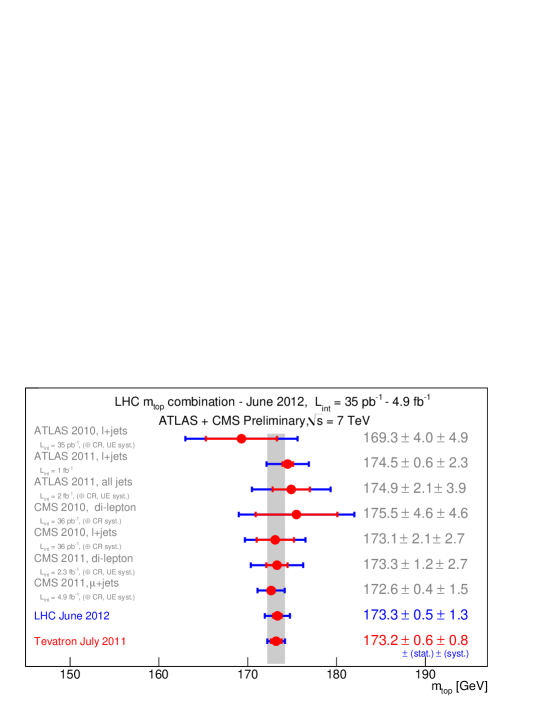
There are additional measurements from ATLAS and CMS, including a measurement in the all-jets channel from ATLAS [10], and one in the dilepton channel from CMS [11]. A compilation of the LHC measurements of is shown in Figure 7. The combined value from the LHC is
Separating the lepton+jets data into and events, CMS has measured the top-antitop mass difference [13], which should be zero if CPT is a good symmetry. The result is
3 Top Quark Width and
The production cross section for single-top events is sensitive to the partial width of the top-quark width, . The D0 collaboration [16] has combined the measured channel single-top production cross section and the ratio of top-quark branching fraction, to extract the total width of the top quark. The result
for a top mass of 172.5 GeV, is in good agreement with the Standard Model value of 1.3 GeV. The measured result is translated into a top-quark lifetime of s.
Since the CKM element and the partial width are proportional to one another, can be extracted by comparison of the measured and predicted (using ) single-top production cross sections. This has been done by all four experiments [17] with results consistent with 1.0 and precision of order 10%.
4 Top-Quark Couplings
In this section I discuss recent results on the top quark electric charge, couplings to and bosons, the helicity in top-quark decays and searches for flavor-changing-neutral-currents.
4.1 Top-Quark Electroweak Couplings
The top-quark electroweak couplings include those to photons and and bosons. The coupling to photons is sensitive to the electric charge of the top-quark (which is also measured directly at both the Tevatron and LHC using jet-charge techniques). In 1.04 fb-1 of data at TeV, ATLAS has measured the cross section for production [18] with a photon threshold of 8 GeV. The result is pb. This compares well with the Standard Model expectation of pb for a charge 2/3 top-quark. There are also direct measurements of the top-quark charge using jet-charge techniques. These are discussed elsewhere in these proceedings [19].
The associated production of and or bosons has been measured by CMS using trilepton events () and same-sign dilepton events (, ) in 4.98 fb-1 of pp collisions at TeV [20]. The results, compared with the Standard Model predictions, are shown in Figure 8.

4.2 -boson Helicity
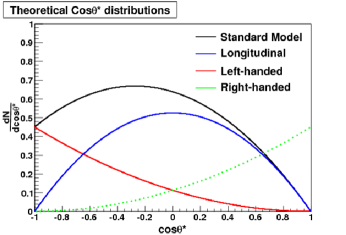
Measurements of the -boson helicity in top quark decays probe the structure of the vertex which, in the Standard Model, is . For the Standard Model coupling, the fraction of longitudinally polarized bosons is a function of the top quark and boson masses, given in the limit of by
which gives 69.9% for and . The remainder is almost entirely left-handed. Even with a non-zero the right-handed fraction is tiny.
The measurement of the helicity fractions is based on the angular distribution of the boson decay products. Figure 9 shows the ideal angular distributions for the three helicity states and their expected Standard Model sum. The angle is the charged lepton angle with respect to the top-quark direction in the rest frame.
The measurement can be made in all top-quark decay channels and is
done using a variety of techniques. D0 uses a template fit to the
reconstructed angular distributions in a combination of lepton+jets
and dileptons decays in 5.4 fb-1 [21]. CDF
has used a matrix element technique in 8.7 fb-1 [22]
of lepton+jets events, that uses the full event kinematics to
calculate an event probability as a function of the longitudinal and
right-handed helicity fractions. At the LHC, both CMS and ATLAS
have made measurements using template fits to the
distributions in 2.2 fb-1 [23] of lepton+jets events
and 1.04 fb-1 [24] of lepton+jets and dilepton
events, respectively. helicity measurements are made either as
two-parameter fits, or one-parameter fits with one helicity fraction
fixed to its Standard Model value and assumed. A
selection of recent results are
summarized in Table 1.
| Experiment | Helicity | Result | Channel | Reference |
| D0 | Dil & LJ | [21] | ||
| CDF | LJ | [22] | ||
| CMS | LJ | [23] | ||
| ATLAS | Dil & LJ | [24] | ||
4.3 Searches For Flavor-Changing Neutral Currents
In the Standard Model Flavor-changing neutral current (FCNC) interactions are forbidden at tree level and highly supressed at higher order by the GIM mechanism. Any observation, therefore, would be a sure sign of physics beyond the Standard Model. Several models of physics beyond the Standard Model predict FCNC effects in top-quark interactions at the level. The most sensitive tests in the top-quark sector come from single top-quark production in which FCNC production diagrams, such as those shown in Figure 10, modify the production kinematics. Searches in single top-quark production are only sensitive to a coupling.

The first branching fraction limits from single top-quark production came from CDF [25] and D0 [26]. The most precise limits which, taking advantage of the relatively large production cross section at the LHC, come from ATLAS [27], are
Direct searches for FCNC top-quark decays have been mounted by all four experiments, using final-state kinematics to search for a signal. The most precise limits again come from the LHC, due to the large production cross section. Both CMS [28] and ATLAS [29] have searched for trileptons in lepton+jets candidate events, with a same-flavor, opposite-sign pair consistent with a decay. In 2.1 fb-1 ATLAS sets a limit of . In 4.6 fb-1, the CMS limit is .
5 Top Quark Production Properties
The production cross section for pairs and for single top-quark production are covered elsewhere in these proceedings [4], as is the charge asymmetry [3]. Here I concentrate on the top quark spin direction at production.
The top-quark lifetime is so short that, unlike other quarks, it decays before hadronization. As a result, its spin direction at production is preserved through its decay and measurable through the angular distributions of its decay products.
5.1 Top Quark Polarization
The production of pairs occurs through the strong interaction and therefore, apart from small electroweak corrections, the top-quark spin is expected to be unpolarized. The first study of top-quark polarization was made by D0 at the Tevatron [31]. The CMS experiment has recently measured the polarization of top-quark pairs produced at the LHC [30] using 5.0 fb-1 of dilepton events. The polarization angle, , is defined as the angle between the direction of the positively-charged lepton, in the rest frame of its parent top quark, and the parent top-quark direction in the rest frame. The measurement of the polarization angle requires a reconstruction of the system, which is done using an analytic technique. The background subtracted, unfolded distribution is shown in Figure 11.

The polarization, is calculated from the asymmetry of the number of events with positive vs. negative values of and found to be
5.2 Spin Correlations
While the top-quark spins are unpolarized, they are expected to be correlated. At the Tevatron, where the dominant production mode for pairs is annihilation, and are expected to be produced mostly with opposite helicities. At the LHC, where the production mode is dominantly gluon-gluon annihilation, the pairs are expected to be like-helicity at low and opposite-helicity at high .
The first results have come from the Tevatron. CDF measures the correlation in the beam basis, where the angles and are defined as the positive and negative lepton directions with respect to the beam direction in the parent top rest frame. Here the double-differential angular distribution is given by
CDF uses 5.1 fb-1 of dilepton events [32] and a maximum likelihood technique to reconstruct the events, to measure .
D0 uses a matrix element technique in 5.3 fb-1 [33] in which a discriminant is calculated for each event, where and are the matrix-element probabilities for correlated and uncorrelated spins. The distribution of is fit with templates for correlated and uncorrelated spins to find a fraction of correlated spins of , yielding the first 3.1 evidence for spin correlations. Earlier studies from D0 can be found in Ref. [34].
At the LHC, the dominance of the gluon-gluon fusion production of pairs provides a straightforward technique for measuring the spin correlation. In production via gluon-gluon fusion, the spin correlation is encoded in the angular separation of the two leptons, , in dilepton decays of the pair [35]. Figure 12 shows the data and fits from both ATLAS and CMS.


The data are fit to a sum of the expected distribution for correlated spins and the expected distribution for uncorrelated spins. The ATLAS result is , where the first uncertainty is statistical and the second systematic, and is the fraction of events with a Standard Model spin correlation. The result excludes at the level. CMS measures . CMS has also searched for signs of new phyiscs in the dependence of on . Data at both low and high ( GeV) are consistent with Standard Model expectations. CMS also presents results on the asymmetry defined as the fraction of events with the product positive minus the fraction with that product negative. This result requires reconstruction of the frame in dilepton events and unfolding to correct for detector effects. It is, however, also sensitive to spin correlation in production of pairs. While less precise than the measurement of , the measured value is also consistent with Standard Model expectations.
6 Conclusions
With as much as 9 fb-1 of data from the Tevatron, and as much as 5 fb-1 analyzed and at least three times that much still to come from the LHC, the era of precision top physics is upon us. I have reviewed the latest results from the four experiments on the top-quark mass, couplings, and searches for rare decay modes. All results are, so far, consistent with Standard Model predictions. As more data are analyzed, and new techniques employed, the precision of these measurements, and sensitivity to beyond-the-Standard-Model effects, will continue to increase.
Acknowledgements
I thank the members of the CDF, D0, ATLAS, and CMS collaborations for the hard work in producing these results and the Fermilab and CERN staff whose outstanding work on the Tevatron and the LHC have produced such rich datasets. This work was supported in part by the U.S. Department of Energy.
References
- [1] CMS Collaboration, JINST 3 S08004 (2008).
- [2] ATLAS Collaboration, JINST 3 S08003 (2008).
- [3] Yvonne Peters, these proceedings.
- [4] Andreas Meyer, these proceedings.
- [5] T. Aaltonen, V.M Abazov, et al., The CDF and D0 collaborations., Phys. Rev. D86, 092003 (2012); arXiv:1207.1069 (2012).
- [6] The CDF collaboration., CDF Note 10761.
- [7] V.M. Abazov et al., The D0 collaboration, Phys. Rev. D 86, 051103(R) (2012).
- [8] ATLAS collaboration, Eur.Phys.J. C72, 2046 (2012).
- [9] CMS collaboration, CMS-PAS-TOP-11-015.
- [10] ATLAS collaboration, ATLAS-CONF-2012-030.
- [11] CMS collaboration, arXiv:1209.2393. Submitted to EPJC.
-
[12]
CMS collaboration, CMS-PAS-TOP-12-001
ATLAS collaboration, ATLAS-CONF-2012-095. - [13] CMS collaboration, arXiv:1204.2807. Submitted to JHEP.
-
[14]
V.M. Abazov et al., The D0 collaboration, Phys. Rev. Lett.
103, 132001 (2009)
V.M. Abazov et al., The D0 collaboration, Phys. Rev. D 84, 052005 (2011). - [15] T. Aaltonen et al., The CDF collaboration, Phys. Rev. Lett. 106, 152001 (2011).
- [16] V.M. Abazov et al., The D0 collaboration, Phys. Rev. D 85, 091104 (2012).
-
[17]
ATLAS collaboration, Phys. Lett. B717, 330 (2012)
CMS collaboration, CMS-PAS-TOP-11-021
CDF collaboration, CDF 10793
D0 collaboration Phys. Rev. D84, 112001 (2011)
CDF and D0 collaborations, Fermilab-TM-2440-E. - [18] ATLAS collaboration, ATLAS-CONF-2010-153.
- [19] Pavol Federic, these proceedings.
- [20] CMS collaboration, CMS-PAS-TOP-12-014.
- [21] V.M. Abazov et al., The D0 collaboration, Phys. Rev. D 83, 032009 (2011).
- [22] CDF collaboration, CDF 10855.
- [23] CMS collaboration, CMS-PAS-TOP-11-020.
- [24] ATLAS collaboration, JHEP 1206, 088 (2012).
- [25] T. Aaltonen et al., The CDF collaboration, Phys. Rev. Lett. 102, 151801 (2009).
- [26] V.M. Abazov et al., The D0 collaboration, Phys.Lett. B693, 81 (2010).
- [27] ATLAS collaboration, Phys. Lett. B712, 351 (2012).
- [28] CMS collaboration, CMS-PAS-TOP-11-028, arXiv:1208.0957.
- [29] ATLAS collaboration, JHEP 1209, 139 (2012).
- [30] CMS collaboration, CMS-PAS-TOP-12-016.
- [31] V. M. Abazov et al. The D0 Collaboration, arXiv:1207.0364.
- [32] CDF collaboration, CDF 10719.
- [33] V.M. Abazov, et al., Phys. Rev. Lett. 108, 032004 (2012).
-
[34]
V.M. Abazov, et al., Phys. Rev. Lett. 107, 032001 (2011)
V.M. Abazov, et al., Phys. Lett. B702, 16 (2011). - [35] G. Mahlon & S. Parke, Phys. Rev. D81, 074024 (2010).
- [36] ATLAS collaboration, Phys. Rev. Lett. 108, 212001 (2012).
- [37] CMS collaboration, CMS-PAS-TOP-12-004.