Illumina Sequencing Artifacts Revealed by Connectivity Analysis of Metagenomic Datasets
Adina Chuang Howe1,2, Jason Pell3, Rosangela Canino-Koning3, Rachel Mackelprang4, Susannah Tringe4, Janet Jansson4,5 , James M. Tiedje1,2, and C. Titus Brown1,3∗
1 Microbiology and Molecular Genetics, Michigan State University, East Lansing, MI, USA
2 Plant, Soil, and Microbial Sciences, Michigan State University, East Lansing, MI, USA
3 Computer Science and Engineering, Michigan State University, East Lansing, MI, USA
4 Department of Energy (DOE) Joint Genome Institute, Walnut Creek, CA, USA
5 Lawrence Berkeley National Laboratory, Genomics Division, Berkeley, CA, USA
E-mail: ctb@msu.edu
Abstract
Sequencing errors and biases in metagenomic datasets affect coverage-based assemblies and are often ignored during analysis. Here, we analyze read connectivity in metagenomes and identify the presence of problematic and likely a-biological connectivity within metagenome assembly graphs. Specifically, we identify highly connected sequences which join a large proportion of reads within each real metagenome. These sequences show position-specific bias in shotgun reads, suggestive of sequencing artifacts, and are only minimally incorporated into contigs by assembly. The removal of these sequences prior to assembly results in similar assembly content for most metagenomes and enables the use of graph partitioning to decrease assembly memory and time requirements.
Introduction
With the rapid decrease in the costs of sequencing, we can now achieve the sequencing depth necessary to study microbes from even the most complex environments [1, 2]. Deep metagenomic sequencing efforts in permafrost soil, human gut, cow rumen, and surface water have provided insights into the genetic and biochemical diversity of environmental microbial populations [1, 3, 2] and their involvement in responding to environmental changes [4]. These metagenomic studies have all leveraged de novo metagenomic assembly of short reads for functional and phylogenetic analyses. De novo assembly is an advantageous approach to sequence analysis as it reduces the dataset size by collapsing the more numerous short reads into fewer contigs and enables improved annotation-based approaches by providing longer sequences [5, 6]. Furthermore, it does not rely on the a priori availability of reference genomes to enable identification of gene content or operon structure [1, 3].
Although de novo metagenomic assembly is a promising approach for metagenomic sequence analysis, it is complicated by the variable coverage of sequencing reads from mixed populations in the environment and their associated sequencing errors and biases [7, 8]. Several metagenome-specific assemblers have been developed to deal with variable coverage communities, including Meta-IDBA [9], MetaVelvet [10], and SOAPdenovo [11]. These assemblers rely on analysis of local sequencing coverage to help build assemblies and thus are sensitive to the effects of sequencing errors and biases on coverage estimations of the underlying dataset. The effects of sequencing errors on de novo assembly has been demonstrated in simulated metagenomes [12, 7, 8] and isolate genomes [13, 14], but these datasets do not necessarily represent real metagenomic data. Specifically, these models exclude the presence of known non-biological sequencing biases which hinder assembly approaches [15, 16, 17].
In this study, we examine metagenomic datasets for the presence of artificial sequencing biases that affect assembly graph structure, extending previous work to large and complex datasets produced from the Illumina platform. We characterize sequence connectivity in an assembly graph, identifying potential sequencing biases in regions where numerous reads are connected together. Within metagenomic datasets, we find that there exist highly connected sequences which partially originate from sequencing artifacts. Moreover, these sequences limit approaches to divide or partition large datasets for further analysis, and may introduce artifacts into assemblies. Here, we identify and characterize these highly connected sequences and examine the effects of removing these sequences on downstream assemblies.
Results
Connectivity analysis of metagenome datasets
Presence of a single, highly connected lump in all datasets
We selected datasets from three medium to high diversity metagenomes from the human gut [2], cow rumen [1], and agricultural soil (SRX099904 and SRX099905) (Table 1). To evaluate the effects of sequencing coverage, we included two subsets of the 520 million read soil metagenome containing 50 and 100 million reads. We also included a previously published error-free simulated metagenome based on a mixture of 112 reference genomes [8].
We evaluated read connectivity by partitioning reads into disconnected components with a de Bruijn graph representation [18]. This approach guarantees that reads in different partitions do not connect to each other and permits the separate assembly and analysis of each partition. For each metagenome, regardless of origin, we found a single dominant, highly connected set of sequencing reads which we henceforth refer to as the “lump” of the dataset (Table 1). This lump contained the largest subset of connected sequencing reads and varied in size among the datasets, ranging from 5% of total reads in the simulated metagenome to 75% of total reads in the human gut metagenome. For the soil datasets, as sequencing coverage (e.g., the fraction of reads mapped to an assembly) increased from 1.4 to 4.7 to 5.6%, the lump size increased more dramatically from 7 to 15 to 35% of all reads, indicating increasingly larger connectivity between sequences with more sequencing.
Characterizing connectivity in the dominant partition
We characterized the connectivity of sequences within each lump by estimating the average local graph density from each k-mer (k=32 unless otherwise stated) in the assembly graph (see Methods). Here, local graph density is a measurement of total connected reads within a fixed radius. Sequences in the identified metagenomic lumps were characterized by very high local graph densities: between 22 to 50% of the total nodes in metagenomic lump assembly graphs had average graph densities greater than 20 (Table 1). This indicates that these nodes were in very nonlinear portions of the assembly graph and had high connectivity. In comparison, 17% of the total nodes in the simulated lump had an average local graph density greater than 20, and fewer than 2% of the nodes in the entire simulated data (all partitions) set had an average graph density higher than 20.
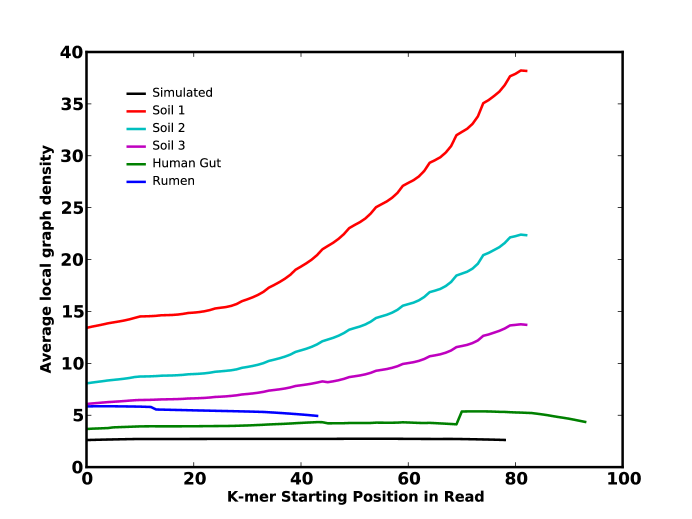
We next assessed the extent to which graph density varied by position along the sequencing reads. The degree of position-specific variation of graph densities was estimated by calculating the average local graph density within ten steps of every k-mer by position in each read. In all environmental metagenomic reads, we observed variation in graph density at the 3’-end region of reads (Fig. 1). In soil metagenomes, we observed the most dramatic variation with local graph density increasing in sequences located at the 3’-end of the reads. Notably, this trend was not present in the simulated dataset.
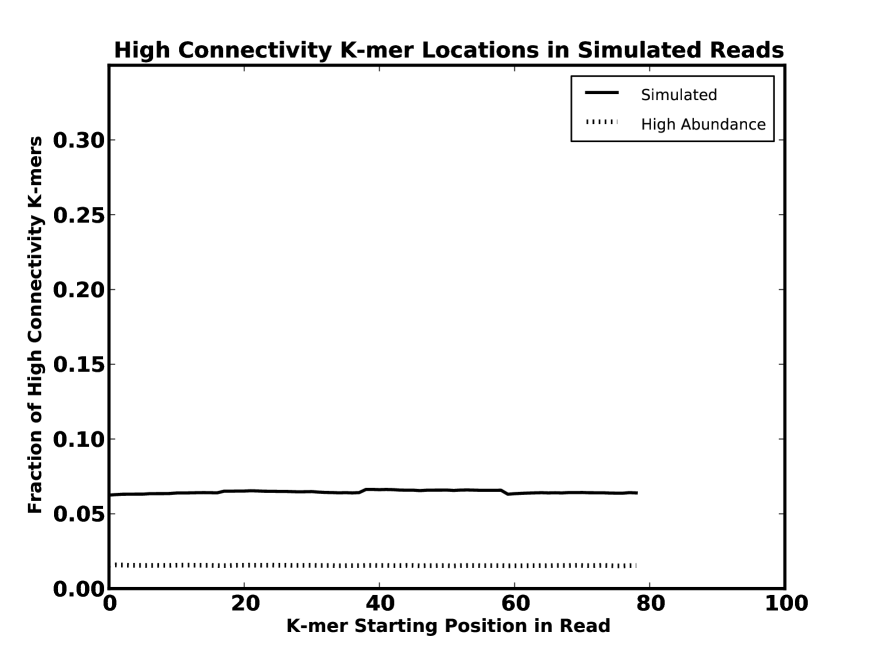
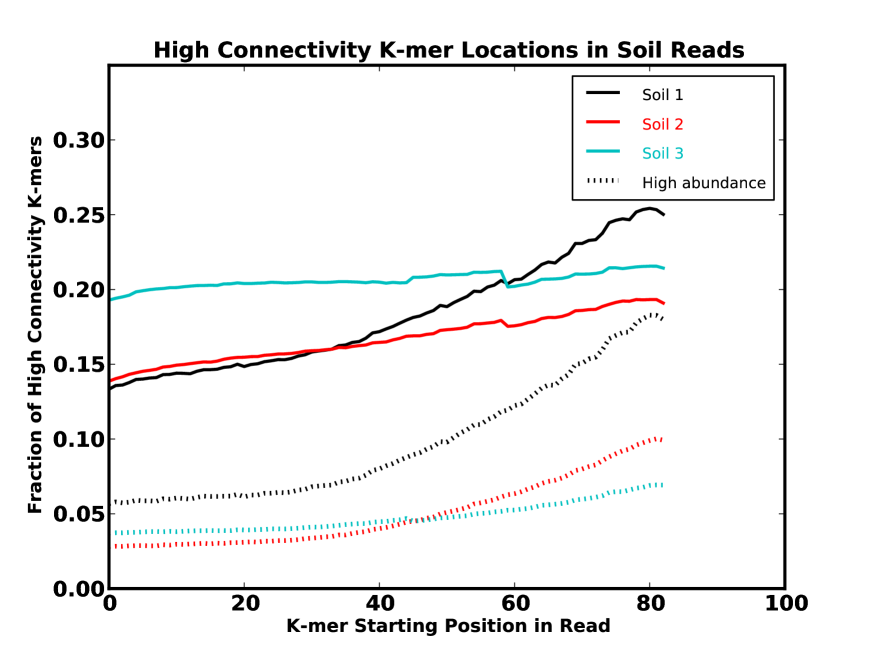
Next, we performed an exhaustive traversal of the assembly graph and identified the specific sequences within dense regions of the assembly graph which consistently contributed to high connectivity. We observed that this subset of sequences was also found to exhibit position-specific variation within sequencing reads, with the exception of these sequences in the simulated dataset (Fig. 2, solid lines). As with local density trends, position-specific trends in the location of these sequences also varied between metagenomes. As sequencing coverage increased among metagenomes, the amount of 3’-end variation appeared to decrease (e.g., the soils) or increase (e.g., rumen and human gut).
Effects of removing highly connected sequences on assembly
Removal of highly connected sequences enables graph partitioning of metagenome
Since these highly connected sequences exhibited position-specific variation indicative of sequences of non-biological origin, we removed them and assessed the effect of their removal on assembly (see Methods). We found that by removing these k-mers, we could effectively break apart metagenomic lumps, and the resulting largest partition of connected reads in each metagenome was reduced to less than 7% of the total reads in the lump. Partitioning also had the effect of significantly decreasing assembly time and memory usage [18].
Removing highly connected sequences resulted in minimal losses of reference genes
We explored the extent to which the identified highly connected sequences impacted assembly by first evaluating the effects of the removal of these sequences from the simulated lump. The assembly of the reads in the original, unfiltered simulated lump and that of the reads remaining after removing highly connected sequences (the filtered assembly) were compared for three assemblers: Velvet [19], Meta-IDBA [9], and SOAPdenovo [11]. Based on the total assembly length of contigs greater than 300 bp, filtered assemblies of the simulated metagenome resulted in a loss of between 4 - 16% of total assembly length (Table 2). In general, the filtered assemblies contained fewer total contigs than unfiltered assemblies, while the maximum contig size increased in the Velvet assembly but decreased in the Meta-IDBA and SOAPdenovo assemblies. Direct comparisons of the unfiltered and filtered simulated metagenome assemblies found that the filtered assemblies comprised on average 89% of the unfiltered assemblies, and the unfiltered assemblies contained nearly all (97%) of the filtered assembled sequences. Despite the removal of over 3% of the total unique 32-mers in the simulated metagenome, the resulting filtered assemblies lost only 3-15% of annotated original reference genes (Table 3).
We next evaluated the effects of removing highly connected sequences in real datasets. Similar to the simulated assemblies, the removal of highly connected sequences for all metagenomes and assemblers resulted in a decrease of total number of contigs and assembly length (Table 2). In general, filtered assemblies were largely contained within unfiltered assemblies and comprised 51-87% of the unfiltered assembly. The observed changes in metagenomic assemblies were difficult to evaluate as no reference genomes exist, and a decrease in assembly length may actually be beneficial if it eliminates contigs that incorporate sequencing artifacts. To aid in this evaluation, we used the previously published set of rumen draft genomes from de novo assembly efforts of high abundance sequences in the rumen metagenome [1]. Overall, we found that removal of highly connected sequences from the rumen dataset resulted in 9-13% loss of sequences present in draft reference genomes (Table 3).
Unfiltered assemblies contained only a small fraction of highly connected sequences
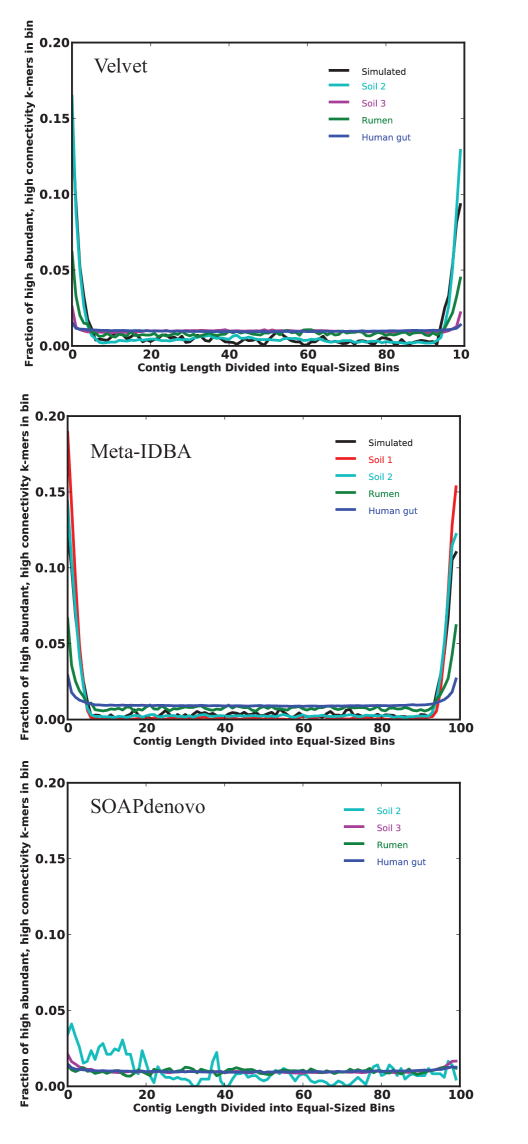
To further study the effects of highly connected sequences, we examined their incorporation into unfiltered assemblies. Except in the human gut sample, fewer than 2% of highly connected sequences were incorporated by any assembler (Table 4). Each assembled contig was divided into percentile bins and examined for the presence of the previously identified highly connected sequences. We found that contigs, especially in assemblies from Velvet and Meta-IDBA, incorporated a larger fraction of these sequences at their ends relative to other positions (Fig 3). The SOAPdenovo assembler incorporated fewer of the highly connected sequences into its assembled contigs; in the simulated data set, none of these sequences were assembled, and in the small soil data set only 41 were assembled. For the human gut metagenome assemblies, millions of the highly connected sequences were incorporated into assembled contigs, comprising nearly 4% of all assembled sequences on Velvet contig ends (Fig 3).
Identifying origins of highly connected sequences in known reference databases
For the simulated metagenome, we could identify the source of highly connected k-mers using available reference genomes. Reference genes with multiple perfect alignments to highly connected k-mers present in the dataset a minimum of 50 times were identified (Table 5). Many of these sequences were from well-conserved housekeeping genes involved in protein synthesis, cell transport, and signaling. To determine possible biological sources of highly connected sequences within real metagenomes, we compared the sequences shared between the soil, rumen, and human gut metagenomes (a total of 241 million 32-mers). Among these 7,586 shared sequences, we identified the closest reference protein from the NCBI-nr database requiring complete sequence identity. Only 1,018 sequences (13%) matched existing reference proteins, and many of the annotated sequences matched to genes conserved across multiple genomes. The most abundant proteins conserved in greater than 3 genomes are shown in (Table 6), and largely encode for genes involved in protein biosynthesis, DNA metabolism, and biochemical cofactors.
One potential cause of artificial high connectivity within metagenomes is the presence of high abundance subsequences. Thus, we identified the subset of highly connected k-mers which were also present with an abundance of greater than 50 within each metagenome and their location in sequencing reads (Fig 2, dotted lines). These high abundance k-mers comprised a very small proportion of the identified highly connected sequences, less than 1% in the soils, 1.5% in the rumen, and 6.4% in the human gut metagenomes, but the position-specific variation of these sequences was very similar to the variation in the larger set of highly connected k-mers.
We attempted to identify patterns within the sequences causing position specific variation by examining the abundance distribution of 5-mers within the highly abundant/highly connected 32-mers. There were significantly fewer 5-mers in the simulated sequences compared to those in metagenomes: 336 total 5-mers in the simulated data and from 425,572 to 221,085,228 total 5-mers in the small soil and human gut datasets, respectively. In the simulated dataset, the top ten most abundant unique k-mers made up 75% of the total 5-mers; in contrast, in the metagenomes, k-mers were more evenly distributed: the top ten most abundant 5-mers comprised less than 10% of the total 5-mers. The cumulative abundance distribution of the ranked 5-mers shown in Fig. 4 shows this even distribution in all of the real metagenomes. This suggests that there is no single, easily-identifiable set of sequences at the root of the highly connected component observed in real metagenomes.
Discussion
Sequencing artifacts are present in real metagenomes
Through assessing the connectivity of reads in several metagenomes, we identified a disproportionately large subset of reads connected together within an assembly graph, which we refer to as the “lump.” The total number of reads in metagenomic lumps (7-75% of reads) was significantly larger than that of simulated dataset (5% of reads) (Table 1). In the simulated data, this component consists of reads connected by sequences conserved between multiple genomes (Table 5). The larger size of this component within the soil, rumen, and human gut metagenomes suggests that anomalous, non-biological connectivity may be present within these lumps. Moreover, in the soil metagenomes, we observed that for a 5% increase in sequencing coverage of the assembled contigs, the amount of connectivity nearly doubled. While sequencing coverage of assembled contigs increased slightly from 4.7 to 5.6% in the medium and large soil metagenomes, the number of reads contained in the lump grew significantly from 15 million to 182 million. Given the very high diversity and very low coverage of these soil samples, the magnitude of the observed increases in connectivity cannot be due simply to increased coverage. This suggests the presence of non-biological features that falsely connect reads.
The superlinear increase in connectivity exhibited in these data sets indicates that a form of preferential attachment is occurring in the graphs [20]. This graph-theoretic phenomenon describes the results of a process where highly connected nodes in a graph preferentially acquire new edges – colloquially known as “the rich get richer.” In assembly, any systematic bias towards producing specific subsequences from shotgun sequencing would lead to a tendency to connect otherwise unrelated graph components; such a bias could be biological (e.g. repeat present in multiple genomes or other highly conserved DNA sequences), or non-biological (e.g., inclusion of sequencing primers in reads or even a low-frequency trend towards producing specific subsequences [21, 22, 23]).
We believe a significant component of the high connectivity that we see is of non-biological origin. Shotgun sequencing is a random process and consequently any position-specific variation within sequencing reads is unexpected and probably originates from bias in sample preparation or the sequencing process [15, 24, 16]. For the metagenomes studied here, we used two approaches to examine characteristics of connectivity correlated to specific positions within sequencing reads. First, we measured the connectivity of sequences at specific positions within reads by calculating local graph density. Next, we identified the specific k-mers which were consistently present in highly dense regions of the assembly graph and evaluated their location within sequencing reads. When these approaches were applied to the simulated dataset, we observed no position-specific trends when assessing either local graph density (Fig 1) or highly connected k-mers (Fig 2) as is consistent with the lack of sequencing errors and variation in this dataset. In all real metagenomes, however, we identified position-specific trends in reads for measurements of both local graph density and the location of highly connected sequences, clearly indicating the presence of sequencing artifacts. Although present in all metagenomes, the direction of the variation varied between soil, rumen, and human gut datasets, especially for the position-specific presence of identified highly connected sequences. It is likely that there is a larger presence of indirectly preferentially attached reads which are connected to high coverage sequences of biological origins in higher coverage datasets, such as the rumen and human gut. This preferential attachment of such reads would result in increasing the number of total reads and consequently the decrease the total fraction of highly connected k-mers (Fig 2, y-axis). This trend is observed in the decreasing fractions of highly connected sequences at the 3’ end of reads as sequencing coverage increased in the small, medium, to large soil metagenomes and in the soil, rumen, to human gut metagenomes (Fig 2).
Highly connected sequences are of unknown non-biological origin
We attempted to identify biological characteristics of highly connected sequences. Among the highly connected sequences in the simulated dataset and those shared by all metagenomes, we identified only a small fraction (13% in simulated and less than 7% in metagenomes) which matched reference genes associated with core biological functions (Table 5 and 6). This suggests that the remaining sequences are either not present in known reference genes (i.e., repetitive or conserved non-coding regions) or originate from non-biological sources. This supports the removal of these sequences for typical assembly and annotation pipelines, where assembly is often followed by the identification of protein coding regions.
Speculating that many of the highly connected sequences originated from high abundance reads, we examined the most abundant subsequences. We found that these subsequences (k-mers present more than 50x in the data set) displayed similar trends for position-specific variation compared to their respective sets of highly connected subsequences (Fig 2), indicating that they contribute significantly to position-specific variation. We attempted to identify signatures in these abundant, highly connected sequences from the simulated and metagenomic datasets by looking at shorter k-mer profiles. In the simulated dataset, we found that the total number of unique 5-mers was significantly lower than in metagenomes and that the most abundant of these 5-mers comprised the large majority of the total. This result is consistent with the presence of conserved biological motifs in the simulated dataset which would result in a small number of highly abundant sequences; it would also be consistent with the inclusion of sequencing primers in the data, were this a real data set.
In contrast, within real metagenomic data, we found that the 5-mers are evenly distributed and exhibit no specific sequence properties (Fig 4), making them difficult to identify and evaluate. Most importantly, we were unable to identify any characteristics that would explain their origin. In addition, a G-C content analysis of the highly connective k-mers did not reveal any systematic differences between the highly connected k-mers and the background k-mer distribution.
When we reviewed the literature on random and systematic sequencing errors in Illumina sequencing, we found many different types of sequencing errors: PCR amplification errors prior to and during cluster generation; random sequencing errors e.g. from miscalls of bases; sequencing errors triggered by specific sequence motifs [25]; adaptor contamination; and post-adaptor read through. Of these errors, only random sequencing errors and adaptor contamination and readthrough would be biased towards the 3’ end of the read. However, random sequencing error does not contribute to aberrant de Bruijn graph connectivity [18], while adaptor contamination and readthrough would yield a sharply biased 5-mer distribution. The observed artifactual sequences thus do not match any known set of random or systematic errors in Illumina sequencing.
Our current working hypothesis is that a low rate of false connections are created by a low-frequency tendency towards producing certain k-mers in the Illumina base calling software, as signal intensities decline. We cannot verify this without access to the Illumina software or source code.
Highly connected sequences are difficult to assemble
Not all of the observed connectivity within real metagenomes is artificial, and our approach cannot differentiate between sequencing artifacts and real biological connectivity. Therefore, removing highly connected sequences could remove real biological signal in addition to sequencing artifacts. However, we suspected that assemblers would be unable to generate contigs from highly connected graph regions, and so even the real sequences would be underrepresented in the assembly.
Indeed, very few highly connected sequences with abundances greater than 50 were incorporated into contigs (Table 4). Moreover, those which were assembled were often disproportionately placed at the ends of contigs (Fig 3), demonstrating that they terminated contig assembly. Although this trend was observed for all three assemblers, it was more prevalent in the Velvet and Meta-IDBA assemblers, highlighting differences in assembler heuristics.
One initial concern upon discovering this false connectivity was that these artifacts might nucleate false assemblies, e.g. as seen with the cow rumen [1]. While we only examined their effects on contig assembly and ignored scaffolding issues, misassembly is an especially significant concern for environmental metagenomics, where experimental validation of assemblies is virtually impossible. However, our observation that k-mers from highly connected graph regions are generally not present in contigs suggests that these particular artifacts do not create false assemblies at a high rate.
Filtered assemblies retained most reference genes
The advantages of removing highly connected sequences must be balanced against consequences to resulting assemblies. We compared several metagenome assemblies before and after the removal of these sequences. In comparing the simulated dataset’s assemblies, the removal of highly connected sequences resulted in very little loss of annotated reference genes (less than 1% total) and some loss of assembled contigs ( 15% of the final assembly). For the rumen metagenome, we performed a partial evaluation of the assemblies using available draft reference genomes. Similar to the simulated assemblies, we observed only a small loss (less than 3% total) of rumen reference genomes assembled (Table 3). In general, for all metagenomes, we observed 25% loss in assembly after removing highly connected sequences, much more than observed in assemblies of reference genes and genomes in the simulated and rumen datasets. Some of this loss could be beneficial, resulting from removal of sequencing artifacts. In addition, trimming or removing reads from already low-coverage data sets could result in the loss of contigs due to the length cutoff we use; as observed above, most of these highly connected k-mers fall at the ends of contigs, and removing them could shorten the contigs enough to lose them from our assembly. It is also possible, of course, that our approach removes sequences which can accurately be assembled, but we cannot evaluate this in the absence of reference genomes.
Filtered reads can be assembled more efficiently
Our original motivation for analyzing connectivity was to assess the practicality of partitioning metagenomes for later assembly, which can dramatically reduce the memory requirements for assembly [18]. Not only did removal of highly connected sequences eliminate problematic sequences, but it resulted in the dissolution of the largest component and allowed us to partition the metagenomes.
We compared the combined assembly of the partitioned sets of filtered reads to the original lump dataset, for several assemblers. For the partitioned reads, we were able to assemble subsets of reads in parallel, resulting in significantly reduced time and memory requirements for assembly (Table 2). In the case of the largest soil metagenome (containing over 500 million reads), we could not complete the Meta-IDBA assembly of the unfiltered reads in even 100 GB of memory, but after removing highly connected sequences and partitioning, the assembly could be completed in less than 2 GB of memory. Using partitioned sets of reads for all metagenomes, we were also able to efficiently complete multiple k-mer length assemblies (demonstrated with Velvet) and subsequently merge resulting assembled contigs. For unfiltered datasets, this was either impossible (due to memory limitations) or impractical (due to excessive processing time).
Conclusion
In this study, we characterize the connectivity of sequences in several metagenomes to detect and characterize a set of likely sequencing artifacts. These artifacts are surprisingly abundant, comprising 5-13% of the total unique sequence in real data sets. Moreover, they have a significant impact on the overall graph connectivity of the data sets, leading to components containing as many as 75% of the reads in the human gut data set.
Despite the prevalence and impact of these sequences, removal of the highly connected k-mers at the heart of these components leads to assemblies that are significantly but not catastrophically smaller than the original assemblies. The original unfiltered assemblies contain the majority of the filtered assemblies, while the filtered assemblies generally contain 70-94% of the unfiltered assemblies. The variability in these statistics between the different assemblers (Table 2) demonstrates that the assemblers have at least as large an effect on the content of the assemblies as our filtering procedure.
We cannot reach strong conclusions about the impact of these highly connected sequences on the correctness of the assembled contigs. In particular, in the absence of complex metagenomes that have been characterized by approaches other than short-read shotgun approaches, we have no very high quality positive control. However, we present evidence that these highly connected sequences primarily affect the ends of contigs and thus are unlikely to cause incorrect contig assembly with high frequency.
Our original motivation in exploring metagenome connectivity was to enable partitioning, an approach that leads to substantially greater scalability of the assembly procedure. In this respect, we were successful. By applying partitioning to filtered metagenome data, we were able to reduce the maximum memory requirements of assembly (including the filtering stage) to well below 48 GB of RAM in all cases. This enables the use of commodity “cloud” computing for all of our samples [26]. The decreased computational requirements for assembly also enabled ready evaluation of different assemblers and assembly parameters; as metagenome datasets grow increasingly larger, this ability to efficiently analyze datasets and evaluate multiple assemblies will be increasingly important.
More generally, our results demonstrate that metagenome assembly is still at an early stage of technology development, particularly for low-coverage data sets. Different assemblers and different filtering techniques yield substantially different assembly statistics on these data sets. Moreover, there are likely to be additional sources of sequencing artifacts lurking within large sequencing data sets, suggesting that more and better computational filtering and validation approaches need to be developed as environmental metagenomics moves forward. Evaluating the assembly graph connectivity created by reads will be a useful approach in the future.
Methods
Metagenomic datasets
All datasets, with the exception of the agricultural soil metagenome,
originate from previously published datasets. Rumen-associated
sequences (Illumina) were randomly selected from the rumen metagenome (read length 36 - 125 bp)
available at ftp://ftp.jgi-psf.org/pub/rnd2/Cow_Rumen
[1]. Human-gut associated sequences (Illumina) of
samples MH0001 through MH0010 were obtained from
ftp://public.genomics.org.cn/BGI/gutmeta/ Raw_Reads
[2] (read length 44 bp). The simulated high complexity, high coverage
dataset was previously published [8]. Soil metagenomes (read lengths 76-113 bp) are in the SRA (SRX099904 and SRX099905). All
reads used in this study, with the exception of those from the simulated
metagenome, were quality-trimmed for Illumina’s read segment quality
control indicator, where a quality score of 2 indicates that all
subsequent regions of the sequence should not be used. After
quality-trimming, only reads with lengths greater than 30 bp were
retained. All quality trimmed datasets, including the previously
unpublished agricultural soil metagenome, are available on a public
Amazon EC2 snapshot (snap-ab88dfdb). The sequencing coverage of each
metagenome was estimated as the fraction of reads which could be
aligned to assembled contigs with lengths greater than 500 bp. For
the coverage estimates, an assembly of each metagenome was performed
using Velvet (v1.1.02) with the following parameters: K=33, exp
cov=auto, cov cutoff=0, no scaffolding. Reads were aligned to
assembled contigs with Bowtie (v0.12.7), allowing for a maximum of two
mismatches.
de Bruijn graph analysis and partitioning software
We used the probabilistic de Bruijn graph representation previously described by [18] to store and partition the metagenome assembly graphs. The khmer and screed software packages are required for the analysis, and the versions used for this publication are available at https://github.com/ged-lab/khmer/tree/2012-assembly-artifacts and https://github.com/ged-lab/screed/tree/2012-assembly-artifacts.
For metagenomes in this study, we used 4 x 48e9 bit bloom filters (requiring 24 GB RAM) to store the assembly graphs. The data processing pipeline used for this analysis is available for public use on the Amazon Web Services public EBS snapshot snap-ab88dfdb: data-in-paper/lumps and method-examples/0.partitioning-into-lump.
The local graph density was calculated as the number of k-mers within a distance of N nodes divided by N. In this study, N was equal to 10. For the largest metagenomes, the human gut and large soil datasets, local graph density was calculated on a randomly chosen subset of reads because of computational limitations.
To identify specific highly connected sequences within the lump assembly graphs, graph traversal to a distance of 40 nodes was attempted from marked waypoints. If more than 200 k-mers were found within this traversal were identified (i.e. a graph density ), all k-mers within this traversal were marked. If the same k-mers were consistently identified in other graph traversals, up to five times, the k-mer was flagged as a highly connected sequence. Aligning these k-mers to original sequencing reads, we identified the position-specific location of these k-mers. Data and examples of scripts used for this analysis are available on the Amazon EC2 public snapshot: data-in-paper/density-bias, data-in-paper/hc-kmer-bias, method-examples/1.density-analysis, method-examples/2.identifying-hc-kmers, and method-examples/3.hc-kmer-analysis.
We identified the sources of highly connected k-mers from the simulated metagenome by aligning them against reference genes originating from the 112 source genomes using Bowtie (v0.12.7) requiring exact matches. Highly connected k-mers shared between all the metagenomes were also aligned against the NCBI non-redundant genome database (ftp://ftp.ncbi.nih.gov/blast/db, March, 1, 2011) using blastn [27], requiring an exact match over the entire k-mer.
We also identified the subset of highly connected 32-mers which were present greater than 50 times within lumps. Data used for this analysis are available on the Amazon EC2 public snapshot: data-in-paper/lumps/HC-kmers/HA-HC-kmers and method-examples/4.abundant-hc-kmers. These high abundance, highly connected sequences were aligned to sequencing reads to demonstrate position specific variation as described above. We evaluated the existence of short k-mer (k=5) motifs within high abundance, highly connected k-mers which did not have an exact match to the NCBI non-redundant database. Each identified 32-mer was broken up into shorter 5-mers, and the frequency of each unique 5-mer was calculated. Next, each unique 5-mer was ranked based on its abundance, from high to low, and the cumulative percentage of total 5-mers is shown in the resulting rank-abundance plot (Fig 4).
De novo metagenomic assembly
The lump within each dataset was assembled and referred to as the “unfiltered assembly”. Additionally, highly connected sequences identified as described above were were trimmed from sequencing reads and the remaining reads partitioned and assembled, resulting in the “filtered assembly”. De novo metagenomic assembly of reads was completed with Velvet (v1.1.02) with the following parameters: velveth -short -shortPaired (if applicable to the dataset) and velvetg -exp_cov auto -cov_cutoff 0 -scaffolding no [19]. For the small and medium soil, rumen, and simulated datasets, Velvet assemblies were performed at K=25-49, resulting contigs were dereplicated to remove contigs with 99% similarity using CD-HIT (v 4.5.6, [28]), and final contigs were merged with Minimus (Amos v3.1.0, [29]). For the largest soil and human gut metagenomes, assemblies were performed at only K=33 due to the size of the datasets and memory limitations. Additional assemblies were performed with Meta-IDBA (v0.18) [9] : –mink 25 –maxk 50 –minCount 0 and with SOAPdenovo: -K 31 -p 8 max_rd_len=200 asm_flags=1 reverse_seq=0. After removal of highly connected k-mers in metagenomic lumps, each filtered lump was partitioned into separate disconnected subgraphs. Multiple subgraphs were grouped together such that assembly could be performed in parallel on groups of sequences. Identical assembly parameters and methods as described above were used for these assemblies. Unfiltered and filtered assemblies were compared using the total number of contigs, total assembly length, and maximum contig size. Additional, the coverage of each assembly was calculated through estimating the average base pair coverage of the BLAST alignment of each assembly to one another (E-value less than 10-5) or, in the case of the simulated and rumen assemblies, to reference genomes. The simulated and rumen reference genomes were previously published in [1] and [8], respectively. Resulting assemblies are available on the Amazon EC2 public snapshot: /data-in-paper/assembly*.
We examined incorporation and the location of the identified high abundant, highly connecting k-mers within assembled contigs. Incorporation of these sequences was evaluated by dividing assembled contigs into words of 32 bp length and identifying exact matches between sequences and contig fragments. The location of these k-mers within assembled unfiltered contigs was examined by dividing each contig into 100 equally-sized regions. The fraction of highly connecting k-mers which aligned exactly to each region was calculated for each metagenome. Data and examples of scripts used for this analysis are available on the Amazon EC2 public snapshot: method-examples/5.hc-kmer-contigs/.
Acknowledgements
This project was supported by Agriculture and Food Research Initiative Competitive Grant no. 2010-65205-20361 from the United States Department of Agriculture, National Institute of Food and Agriculture and National Science Foundation IOS-0923812, both to C.T.B. A.H. was supported by NSF Postdoctoral Fellowship Award #0905961 and the Great Lakes Bioenergy Research Center (Department of Energy BER DE-FC02-07ER64494). The work conducted by the U.S. Department of Energy Joint Genome Institute is supported by the Office of Science of the U.S. Department of Energy under Contract No. DE-AC02-05CH11231. We thank Nick Loman and Lex Nederbragt for their helpful comments on the paper.
References
- 1. Hess M, Sczyrba A, Egan R, Kim TW, Chokhawala H, et al. (2011) Metagenomic discovery of biomass-degrading genes and genomes from cow rumen. Science 331: 463–7.
- 2. Qin J, Li R, Raes J, Arumugam M, Burgdorf KS, et al. (2010) A human gut microbial gene catalogue established by metagenomic sequencing. Nature 464: 59–65.
- 3. Iverson V, Morris RM, Frazar CD, Berthiaume CT, Morales RL, et al. (2012) Untangling genomes from metagenomes: revealing an uncultured class of marine euryarchaeota. Science 335: 587–90.
- 4. Mackelprang R, Waldrop MP, DeAngelis KM, David MM, Chavarria KL, et al. (2011) Metagenomic analysis of a permafrost microbial community reveals a rapid response to thaw. Nature 480: 368–71.
- 5. Miller JR, Koren S, Sutton G (2010) Assembly algorithms for next-generation sequencing data. Genomics 95: 315–27.
- 6. Pop M (2009) Genome assembly reborn: recent computational challenges. Briefings in bioinformatics 10: 354–66.
- 7. Mende DR, Waller AS, Sunagawa S, Järvelin AI, Chan MM, et al. (2012) Assessment of metagenomic assembly using simulated next generation sequencing data. PLoS ONE 7: e31386.
- 8. Pignatelli M, Moya A (2011) Evaluating the fidelity of de novo short read metagenomic assembly using simulated data. PLoS ONE 6: e19984.
- 9. Peng Y, Leung HCM, Yiu SM, Chin FYL (2011) Meta-idba: a de novo assembler for metagenomic data. Bioinformatics 27: i94–101.
- 10. Namiki T, Hachiya T, Tanaka H, Sakakibara Y (2012) MetaVelvet: an extension of Velvet assembler to de novo metagenome assembly from short sequence reads. Nucleic Acids Research .
- 11. Li R, Zhu H, Ruan J, Qian W, Fang X, et al. (2010) De novo assembly of human genomes with massively parallel short read sequencing. Genome Res 20: 265–72.
- 12. Mavromatis K, Ivanova N, Barry K, Shapiro H, Goltsman E, et al. (2006) Use of simulated data sets to evaluate the fidelity of metagenomic processing methods. Nature Methods 4: 495–500.
- 13. Morgan J, Darling A, Eisen J (2010) Metagenomic sequencing of an in vitro-simulated microbial community. PLoS ONE 5: e10209.
- 14. Chitsaz H, Yee-Greenbaum JL, Tesler G, Lombardo MJ, Dupont CL, et al. (2011) Efficient de novo assembly of single-cell bacterial genomes from short-read data sets. Nature Biotechnology 29: 915–921.
- 15. Gomez-Alvarez V, Teal TK, Schmidt TM (2009) Systematic artifacts in metagenomes from complex microbial communities. The ISME Journal 3: 1314–7.
- 16. Keegan KP, Trimble WL, Wilkening J, Wilke A, Harrison T, et al. (2012) A platform-independent method for detecting errors in metagenomic sequencing data: Drisee. PLoS Comput Biol 8: e1002541.
- 17. Niu B, Fu L, Sun S, Li W (2010) Artificial and natural duplicates in pyrosequencing reads of metagenomic data. BMC Bioinformatics 11: 187.
- 18. Pell J, Hintze A, Canino-Koning R, Howe A, Tiedje JM, et al. (2012) Scaling metagenome sequence assembly with probabilistic de Bruijn graphs. Proceedings of the National Academy of Sciences of the United States of America 109: 13272–13277.
- 19. Zerbino DR, Birney E (2008) Velvet: algorithms for de novo short read assembly using de bruijn graphs. Genome Res 18: 821–9.
- 20. Barabási A, Albert R (1999) Emergence of scaling in random networks. Science 286: 509.
- 21. Hansen KD, Brenner SE, Dudoit S (2010) Biases in Illumina transcriptome sequencing caused by random hexamer priming. Nucleic Acids Research 38: e131–e131.
- 22. Minoche AE, Dohm JC, Himmelbauer H (2011) Evaluation of genomic high-throughput sequencing data generated on Illumina HiSeq and Genome Analyzer systems. Genome Biology 12: R112.
- 23. Dohm JC, Lottaz C, Borodina T, Himmelbauer H (2008) Substantial biases in ultra-short read data sets from high-throughput DNA sequencing. Nucleic Acids Research 36: e105–e105.
- 24. Haas BJ, Gevers D, Earl AM, Feldgarden M, Ward DV, et al. (2011) Chimeric 16S rRNA sequence formation and detection in Sanger and 454-pyrosequenced PCR amplicons. Genome Research 21: 494–504.
- 25. Meacham F, Boffelli D, Dhahbi J, Martin DI, Singer M, et al. (2011) Assessment of metagenomic assembly using simulated next generation sequencing data. BMC Bioinformatics 12.
- 26. Angiuoli SV, White JR, Matalka M, White O, Fricke WF (2011) Resources and Costs for Microbial Sequence Analysis Evaluated Using Virtual Machines and Cloud Computing. PLoS ONE 6: e26624.
- 27. Altschul SF, Gish W, Miller W, Myers EW, Lipman DJ (1990) Basic local alignment search tool. J Mol Biol 215: 403–10.
- 28. Li W, Jaroszewski L, Godzik A (2001) Clustering of highly homologous sequences to reduce the size of large protein databases. Bioinformatics 17: 282–3.
- 29. Sommer DD, Delcher AL, Salzberg SL, Pop M (2007) Minimus: a fast, lightweight genome assembler. Bmc Bioinformatics 8: 64.
| Sm Soil | Med Soil | Large Soil | Rumen | Human Gut | Sim | |
|---|---|---|---|---|---|---|
| Total Reads (millions) | 50.0 | 100.0 | 520.3 | 50.0 | 350.0 | 9.2 |
| Mapped to assembly (percent) | 1.4 | 4.7 | 5.6 | 10.3 | 3.5 | 14.8 |
| Reads in Lump (millions) | 3.0 | 15.0 | 182.2 | 10.3 | 263 | 0.5 |
| Lump Fraction (%) | 7% | 15% | 35% | 21% | 75% | 5% |
| HC 32-mers (millions) | 6.4 | 33.3 | 230.4 | 25.4 | 136.6 | 0.4 |
| Total 32-mers (million) | 84.9 | 326.5 | 2,198.1 | 201.5 | 860.6 | 11.6 |
| Fraction of HC 32-mers (%) | 8% | 10% | 10% | 13% | 16% | 3% |
| High Density Nodes (%) | 50% | 37% | 40% | 22% | 28% | 17% |
| UF Assembly | F Assembly | UF Requirements | |
|---|---|---|---|
| (contigs / length / max size) | (contigs / length / max size) | Memory (GB)/Time (h) | |
| Velvet | |||
| Small Soil | 25,470 / 16,269,879 / 118,753 | 17,636 / 10,578,908 / 13,246 | 5 / 4 |
| Medium Soil | 113,613 / 81,660,678 / 57,856 | 79,654 / 54,424,264 / 23,663 | 18 / 21 |
| Large Soil | 554,825 / 306,899,884 / 41,217 | 290,018 / 159,960,062 / 41,423 | 33 / 12* |
| Rumen | 92,044 / 74,813,072 / 182,003 | 72,705 / 49,518,627 / 34,683 | 11 / 14 |
| Human Gut | 543,331 / 234,686,983 / 85,596 | 203,299 / 181,934,800 / 145,740 | 76 / 8* |
| Simulated | 11,204 / 6,506,248 / 5,151 | 9,859 / 5,463,067 / 6,605 | <1 / <1 |
| MetaIDBA | |||
|---|---|---|---|
| Small Soil | 15,739 / 9,133,564 / 37,738 | 12,513 / 7,012,036 / 17,048 | <1 / <1 |
| Medium Soil | 76,269 / 45,844,975 / 37,738 | 52,978 / 30,040,031 / 18,882 | 2 / 2 |
| Large Soil | 395,122 / 228,857,098 / 37,738 | N/A | >116 / incomplete |
| Rumen | 60,330 / 47,984,619 / 54,407 | 48,940 / 33,276,502 / 22,083 | 12 / 3 |
| Human Gut | 173,432 / 211,067,996 / 106,503 | 132,614 / 142,139,101 / 85,539 | 58 / 15 |
| Simulated | 8,707 / 4,698,575 / 5,113 | 7,726 / 4,078,947 / 3,845 | <1 / <1 |
| SOAPdenovo | |||
|---|---|---|---|
| Small Soil | 14,275 / 7,100,052 / 37,720 | 12,801 / 6,343,110 / 13,246 | 3 / <1 |
| Medium Soil | 66,640 / 33,321,411 / 28,695 | 56,023 / 27,880,293 / 15,721 | 10 / <1 |
| Large Soil | 412,059 / 215,614,765 / 32,514 | 334,319 / 171,718,154 / 41,423 | 48 / 11 |
| Rumen | 62,896 / 40,792,029 / 22,875 | 55,975 / 34,540,861 / 19,044 | 5 / <1 |
| Human Gut | 190,963 / 171,502,574 / 57,803 | 161,795 / 139,686,630 / 56,034 | 35 / 5 |
| Simulated | 6,322 / 2,940,509 / 3,786 | 6,029 / 2,821,631 / 3,764 | <1 / <1 |
Velvet Assembler
Cov. of UF by F
Cov. of F by UF
Cov. of RG by UF
Cov. of RG by F
Simulated
85.4%
99.4%
5.4%
4.6%
Small Soil
74.7%
98.8%
-
-
Medium Soil
75.6%
98.4%
-
-
Large Soil
50.9%
86.6%
-
-
Rumen
75.9%
98.8%
17.5%
14.8%
Human Gut
80.0%
89.1%
-
-
Meta-IDBA Assembler
Cov. of UF by F
Cov. of F by UF
Cov. of RG by UF
Cov. of RF by F
Simulated
87.4%
94.4%
4.7%
4.1%
Small Soil
75.7%
94.2%
-
-
Medium Soil
67.7%
94.8%
-
-
Large Soil
N/A
N/A
-
-
Rumen
70.8%
95.0%
17.5%
14.8%
Human Gut
74.4%
99.4%
-
-
SOAPdenovo Assembler
Cov. of UF by F
Cov. of F by UF
Cov. of RG by UF
Cov. of RF by F
Simulated
94.0%
97.0%
3.0%
2.9%
Small Soil
86.8%
96.1%
-
-
Medium Soil
82.4%
96.0%
-
-
Large Soil
78.9%
94.5%
-
-
Rumen
85.2%
97.8%
14.9%
13.6%
Human Gut
85.4%
99.3%
-
-
| Velvet | SOAPdenovo | MetaIDBA | |
|---|---|---|---|
| Small Soil | 0 (0.0%) | 41 (0.0%) | 8,717 (0.1%) |
| Medium Soil | 32,328 (0.1%) | 852 (0.0%) | 23,881 (0.1%) |
| Large Soil | 643,071 (0.3%) | 279,519 (0.1%) | N/A |
| Rumen | 45,721 (0.2%) | 14,858 (0.1%) | 33,046 (0.1%) |
| Human Gut | 4,661,447 (3.4%) | 1,749,347 (1.3%) | 5,528,054 (4.0%) |
| Simulated | 5,118 (1.4%) | 0 (0.0%) | 5,480 (1.5%) |
| Number of HC sequences with annotation | |
|---|---|
| ABC transporter-like protein | 306 |
| Methyl-accepting chemotaxis sensory transducer | 210 |
| ABC transporter | 173 |
| Elongation factor Tu | 94 |
| Chemotaxis sensory transducer | 51 |
| ABC transporter ATP-binding protein | 44 |
| Diguanylate cyclase/phosphodiesterase | 36 |
| ATPase | 36 |
| S-adenosyl-L-homocysteine hydrolase | 36 |
| Adenosylhomocysteine And downstream NAD binding | 36 |
| Ketol-acid reductoisomerase | 34 |
| S-adenosylmethionine synthetase | 34 |
| Elongation factor G | 34 |
| ABC transporter ATPase | 33 |
| Number of HC sequences with annotation | |
|---|---|
| Translation elongation factor/GTP-binding protein LepA | 11 |
| S-adenosylmethionine synthetase | 8 |
| Aspartyl-tRNA synthetase | 8 |
| Malate dehydrogenase | 7 |
| V-type H(+)-translocating pyrophosphatase | 6 |
| Acyl-CoA synthetase | 6 |
| NAD synthetase | 5 |
| Ribonucleotide reductase of class II | 4 |
| Ribityllumazine synthase | 4 |
| Heavy metal translocating P-type ATPase, copA | 3 |
| GyrB | 3 |
| Glutamine amidotransferase chain of NAD synthetase | 3 |
| ChaC family protein | 3 |