Intrinsic switching field distribution of arrays of Ni80Fe20 nanowires probed by magnetic force microscopy
Abstract
The progress of magnetization reversal of weakly packed ferromagnetic Ni80Fe20 nanowire arrays of different diameters (40, 50, 70 and 100 nm) electrodeposited in polycarbonate membranes was studied by magnetic force microscopy (MFM). For such a low packing density of nanomagnets, the dipolar interactions between neighbouring wires can be neglected. The intrinsic switching field distribution has been extracted from in situ MFM images and its width was found to be considerably smaller than for densely packed nanowire arrays.
I Introduction
Arrays of magnetic nanostructures, such as of nanowires (NWs), are extensively investigated due to their potential applications in magnetic storage [1] and microwave devices [2]. Amongst the various issues at stake for a comprehensive understanding of these arrays is the influence of long range dipolar interactions [3-10] because these interactions between NWs strongly influence the switching field distributions (SFD) which play a significant role for information storage. Particularly, the width of the SFD is important since smaller values of this parameter leads to less recording errors and it is also a measure of the quality of the recording media [11]. Consequently, understanding and evaluation of the distinct influences of interactions between NWs and intrinsic switching field distribution (SFD) in the magnetization reversal process of such arrays is critical for the development of magnetic recording media. The intrinsic SFD mostly originates from non-uniformities of the geometrical parameters such as the aspect ratio and shape of the NW tip that may affect the magnetization reversal properties. The present work aims at the determination of the magnetization reversal progress in low density two-dimensional arrays of ferromagnetic NWs of different diameters (40, 50, 70 and 100 nm) grown by electrodeposition inside low porosity () polycarbonate nanoporous membranes, by using in situ magnetic force microscopy (MFM). In these arrays, the NWs are sufficiently isolated from each other to neglect the dipolar interactions between them. This helps to avoid the difficult corrections which are necessary for dense NWs arrays [7-10], leading to an easier analysis and interpretation of the MFM experiments.
II Experimental procedure
Arrays of Ni80Fe20 NWs have been fabricated by electrodeposition in nanoporous polycarbonate (PC) templates of thickness 20m. The fabrication method of PC template, which has porosity less than , has been reported elsewhere [13]. Prior to the electrodeposition, a gold layer was evaporated on one side of the membrane in order to cover the pores and to use it as a cathode. In addition, for proper adhesion of gold layer with the PC membrane a thin film of Cr ( nm) was deposited. The solution used to fabricate the Ni80Fe20 NWs contains: NiSO4.6H2O 131g/L, FeSO4.6H2O 5.56 g/L, H3BO3 24.7g/L [14]. To ensure proper MFM experiments; the Au and Cr layers were removed by chemical etching, after electrodeposition, in order to obtain a smooth surface where all the NWs tips at that side of the PC membrane are close to the surface.
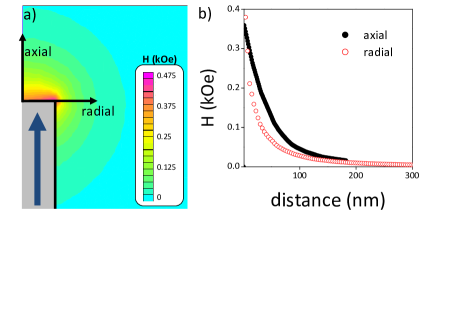
The length of the NWs is m with a standard deviation of m as determined by SEM. The pores diameters () vary from 40 to 100nm with a standard deviation of the diameter of nm. In this range of , the magnetic moment is expected to be uniform inside each NW. Actually, the domain wall width (where is the exchange stiffness and is the magnetocristalline anisotropy) for Ni80Fe20 is few hundreds of nm. Consequently, two remanent states are expected to be stable and correspond to a uniform magnetization aligned along and ( being the NW’s axis direction). Table I presents the template porosities P and the mean interwire distances of the first four neighbouring NWs. Figure 1 shows the dipolar stray field at the tip of a uniformly magnetized NW ( m, 0 nm, kOe) calculated using femm [11]. It illustrates that the dipolar field can be neglected in our arrays since it is localized around the tip of the NWs: in a volume with a typical size given by the radius of the NW and because the inter-wire distances measured in our arrays is around 1000 nm.
| (nm) | Measured () | Interwire distance (nm) | |
|---|---|---|---|
| 40 | 0.04 | 1200 | |
| 50 | 0.15 | 1000 | |
| 70 | 0.19 | 1000 | |
| 100 | 0.25 | 1200 | |
The magnetization reversal was investigated using a magnetic force microscope from Agilent Technology. The experiments were done using non-contact mode allowing us to obtain magnetic and topographic images simultaneously. The extremity of the NWs could be imaged separately while keeping them in the template, as well as their magnetic state: up or down. An external magnetic field was applied using a custom-built electromagnet with the ability to produce a controllable magnetic field (parallel to the NWs axis) of up to 2 kOe. This made it possible to not only saturate the sample but also to measure different DC demagnetization (DCD) remanent states. We applied an in situ external magnetic field parallel to the NWs before each measurement. The MFM images have been obtained at zero applied fields (in different remanent states) after switching off the external field. Indeed, as a consequence of the weak dipolar interactions between NWs in low porosity membranes, measurements done at a field and at zero field after applying a field are same (this was checked experimentally). By counting the number of NWs which reversed their magnetization direction after each increment of applied field, we obtained the switching field distribution (SFD) and MFM-magnetization curves.
III Experimental results and discussion
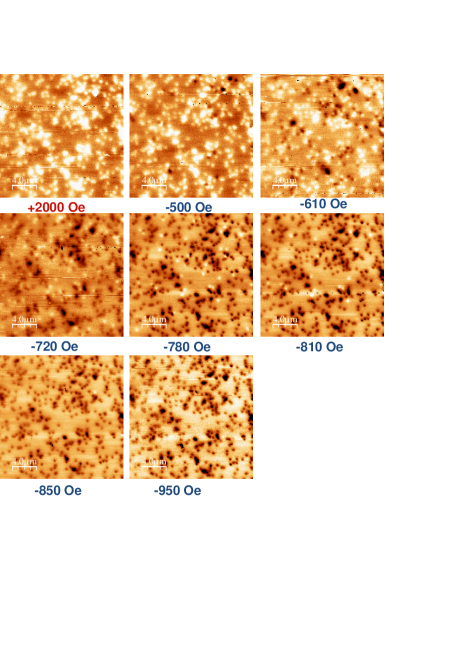
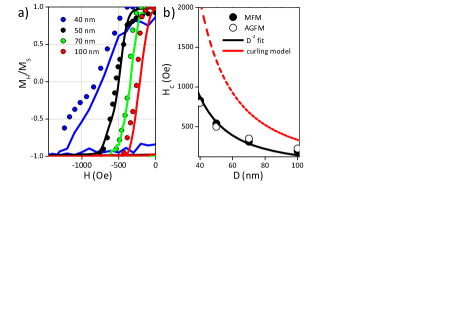
Figure 2 presents a series of MFM images of the 50nm diameter NWs array scanned at different remanent states. Before inserting the array inside the microscope, it was saturated under a magnetic field of 2 kOe along the NW axis () while the magnetic tip of the microscope was saturated in the opposite direction (). From the first image (top left), which corresponds to the one just after saturating the system, we observed that the NWs were still oriented in the same direction (as seen from the white spots). Then, a series of magnetic fields opposite to the sample’s initial saturation field was applied. The successive switching of the NWs started around Oe till the application of Oe where all the NWs had been switched black. The MFM-magnetization curves were determined by representing the percentage of switched NWs as a function of each increment of applied field. Figure 3a shows the MFM-magnetization curves obtained from the different arrays (solid dots). In addition, bulk magnetization curves have been obtained using an alternating gradient force magnetometer (AGFM) and compared to the MFM-magnetization curves (continuous lines in Figure 3a). The results from MFM and AGFM are in good agreement. The small deviations that appear between these two measurements can be attributed to the fact that a limited number of NWs is probed using MFM (local study) while the whole set of NWs is probed using magnetometry measurements.
The variation of as a function of is represented in Figure 3b; it increases with decreasing and ranges from Oe for nm to Oe for nm. This dependence of with diameter fits well with a law. It is well know that the of an infinite NW in the coherent rotation model is given by kOe and do not depends on the diameter [15]. Nevertheless, our NWs are not infinite and have diameters larger than 36 nm ( being the exchange length) which corresponds to the diameter beyond which non uniform reversal modes such as curling and buckling can occur [15,16]. We have calculated the -dependence of in the curling model (see Figure 3b) for infinite Ni80Fe20 NWs by using the bulk magnetic parameter; namely saturation magnetization: kG and exchange stiffness: erg.cm-1 [14, 15]. Although the measured HC are two times smaller than the ones found in the model, we observe the same dependence which shows that the reversal mechanism in our NWs resembles the curling model.
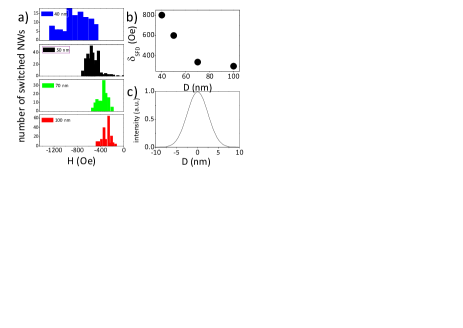
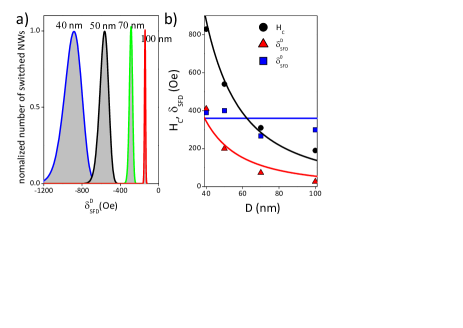
The SFD is linked with the number of switched NWs at each increment of the applied field and have been determined as a function of the applied fields; it is reported in Figure 4a. The SFD width () corresponds to the difference between the field of first reversed NW and the last one and is reported in Figure 4b as a function of . It decreases with increasing , from 800 Oe for nm to 320 Oe for nm. These values are smaller than the ones determined for densely packed NWs grown in alumina templates where was more than 2 kOe (for around 40 nm) [7, 9, 10] and where strong dipolar interactions were present. It has been shown that the dipolar interactions in arrays of NWs with a fixed and increasing lead to a broadening of [4]. Whereas, in our case, the packing density is relatively low () and decreases with decreasing , this mean that the broadening of with decreasing is mostly due to intrinsic effects and not from the dipolar interactions. Let us assume that is defined as where, is due to the size distribution of and may refer to; the inhomogeneities in the structure and chemical composition of the NW arrays which contribute to the broadening of the SFD. We propose to separately determine and . For this purpose, we consider a Gaussian size distribution of the NWs diameter with a standard deviation of nm (see Figure 4c), as it agrees with the SEM measurements and we use the fit obtained from the experimental evolution of with (Figure 3b). Figure 5a presents the calculated by this way, it increases with decreasing . The variation of and with are represented and fitted using laws in Figure 5b. Note that is almost constant with (blue squares in Figure 5b). This proves that the increase of for smaller is essentially due to the size distribution of the nanopores in the PC membrane while is due to other intrinsic effects.
IV Conclusion
Arrays of Ni80Fe20 ferromagnetic nanowires embedded into nanoporous polycarbonate membranes of low porosity have been studied using in situ magnetic force microscopy. The influence of the diameter of the nanowires on the magnetization reversal and thus the switching field distribution (SFD) has been investigated. By counting number of nanowires with magnetization up and down, the local magnetization curves were obtained which agree well with bulk magnetization measurements. We demonstrate narrow SFD width () regardless of the nanowire’s diameter () compared to the ones generally obtained for densely packed nanowire arrays in alumina membranes. Moreover, a decrease of with is observed and has been qualitatively explained by considering a Gaussian distribution of the nanopore diameter in polycarbonate membranes. The MFM magnetization curves and the SFD of the samples show that such systems would be suitable for data storage applications. However, the variation of with could be a limitation if one wants to use such systems with small diameter.
Arrays of Ni80Fe20 ferromagnetic NWs embedded into nanoporous polycarbonate membranes of low porosity have been studied using in situ magnetic force microscopy. The influence of the diameter of the NWs on the magnetization reversal and thus the switching field distribution (SFD) has been investigated. By counting number of NWs with magnetization up and down, the local magnetization curves were obtained which agree well with bulk magnetization measurements. We demonstrate narrow SFD width () regardless of the nanowire’s diameter (D) compared to the ones generally obtained for densely packed ferromagnetic NW arrays in alumina membranes. Moreover, a decrease of with increasing diameter is observed and has been qualitatively explained by considering a Gaussian distribution of the nanopores diameter. The variation of with could be a limitation if one wants to use such systems with small diameter for data storage applications.
Acknowledgements.
The authors thank E. Ferain for providing the PC templates. BN is Senior Research Associate of the F.R.S.-FNRS of Belgium. M.R.Tabasum is on leave from IME-RCET (University of Engineering and Technology Lahore).References
- (1) D.J. Sellmyer, Y. Xu, M. Yan, Y. Sui, J. Zhou and R. Skomski J. Magn. Magn. Mater. 303, 302 (2006)
- (2) A. Saib, M. Darques, L. Piraux, D. Vanhoenacker-Janvier and I. Huynen IEEE Trans. Microw. Theo. Tech. 53 2043 (2005)
- (3) A. Encinas Oropesa, M. Demand, L. Piraux, I. Huynen, U. Ebels Phys. Rev. B 63, 104415 (2001)
- (4) F. Zighem, T. Maurer, F. Ott and G. Chaboussant J. Appl. Phys. 109, 013910 (2011)
- (5) L. Clime, P. Ciureanu and A. Yelon, J. Magn. Magn. Mater. 297, 60 (2006)
- (6) K. Nielsch, R. B. Wehrspohn, J. Barthel, J. Kirschner and U. Gösele Appl. Phys. Lett. 79, 1360 (2001)
- (7) J. De La Torre Medina, L. Piraux, J. M. Olais Govea and A. Encinas Phys. Rev. B 81, 144411 (2010)
- (8) J. Escrig and D. Altbir, M. Jaafar, D. Navas, A. Asenjo, and M. Vázquez, Phys. Rev. B 75, 184429 (2007)
- (9) A.Asenjo, M. Jaafar, D. Navas and M. Vazquez J. Appl. Phys. 100, 023909 (2006)
- (10) T. G. Sorop, C. Untiedt, F. Luis, M. Kröll, M. Raşa and L. J. de Jongh Phys. Rev. B 67, 014402 (2003)
- (11) D. C. Meeker, Finite Element Method Magnetics (http://www.femm.info)
- (12) J. W. Lau and J. M. Shaw, J. Phys. D: Appl. Phys. 44, 303001 (2011)
- (13) R. Ferré, K. Ounadjela, J. M. George, L. Piraux and S. Dubois Phys. Rev. B 56, 14066 (1997)
- (14) A. Encinas, M. Demand, L. Vila and L. Piraux, Appl. Phys. Lett. 81, 2032 (2002)
- (15) A. Aharoni and S. Shtrikman Phys. Rev. 109, 1522 (1958)
- (16) R. Skomski, H. Zeng, M. Zheng, and D. J. Sellmyer Phys. Rev. B 62, 3900 (2000)
- (17) S. Da Col, M. Darques, O. Fruchart and L. Cagnon Appl. Phys. Lett. 98, 112501 (2011)