Very deep spectroscopy of the bright Saturn Nebula NGC 7009 – II. Analysis of the rich optical recombination spectrum
Abstract
In Paper I, we presented deep, long-slit spectrum of the bright Saturn nebula NGC 7009. Numerous permitted lines emitted by the C+, N+, O+ and Ne+ ions were detected. Gaussian profile fitting to the spectrum yielded more than 1000 lines, the majority of which are optical recombination lines (ORLs) of heavy element ions. In the current paper, we present a critical analysis of the rich optical recombination spectrum of NGC 7009, in the context of the bi-abundance nebular model proposed by Liu et al. Transitions from individual multiplets are checked carefully for potential blended lines. The observed relative intensities are compared with the theoretical predictions based on high quality effective recombination coefficients, now available for the recombination line spectrum of a number of heavy element ions.
The possibility of plasma diagnostics using the ORLs of various heavy element ions is discussed in detail. The line ratios that can be used to determine electron temperature are presented for each ion, although there is still a lack of adequate atomic data and some of the lines are still not detected in the spectrum of NGC 7009 due to weakness and/or line blending. Plasma diagnostics based on the N ii and O ii recombination spectra both yield electron temperatures close to 1000 K, which is lower than those derived from the collisionally excited line (CEL) ratios (e.g., the [O iii] and [N ii] nebular-to-auroral line ratios; see Paper I for details) by nearly one order of magnitude. The very low temperatures yielded by the O ii and N ii ORLs indicate that they originate from very cold regions. The C2+/H+, N2+/H+, O2+/H+ and Ne2+/H+ ionic abundance ratios derived from ORLs are consistently higher, by about a factor of 5, than the corresponding values derived from CELs. In calculating the ORL ionic abundance ratios, we have used the newly available high quality effective recombination coefficients, and adopted an electron temperature of 1000 K, as given by the ORL diagnostics and as a consequence presumably representing the physical conditions prevailing in the regions where the heavy element ORLs arise. Measurements of the ultraviolet (UV) and infrared (IR) CELs from the literature are used to calculate CEL ionic abundance ratios when optical data are not available for the ionic species. A comparison of results of plasma diagnostics and abundance determinations for NGC 7009 points to the existence of “cold”, metal-rich (i.e., H-deficient) inclusions embedded in the hot, diffuse ionized gas, first postulated by Liu et al.
At electron temperatures yielded by the N ii and O ii ORLs, the predicted relative intensities of ORLs agree well with the observed values, indicating that the current quantum calculations of the recombination spectra of those two ionic species well represent the recombination processes under nebular conditions. Deviations from the LS coupling, noticed in an earlier quantitative spectroscopy by Liu et al. for the same object, are again confirmed, especially for recombination lines of the 4f – 3d transition array. For N ii, as well as for O ii, the ionic abundances derived from different -resolved transitions within a multiplet, or from the transitions belonging to different multiplets, agree with each other. This is another evidence that the new effective recombination coefficients are reliable. New calculations of the effective recombination coefficients for the Ne ii lines at nebular temperatures and densities are needed.
keywords:
atomic data – atomic processes – ISM: abundances – planetary nebulae: individual: NGC 70091 Introduction
The bright Saturn Nebula NGC 7009 is known for its rich and prominent optical recombination lines (ORLs) of heavy element ions, especially those of O ii, ever since the spectrophotographic observations of Wyse wyse1942 (1942), who published and analyzed deep spectra of the Orion Nebula and nine planetary nebulae (PNe), including NGC 7009. He identified and measured several dozen O ii permitted lines in NGC in the wavelength range 3700 – 6750 Å, although accurate measurements of many of those O ii lines were hampered by line blending. At the end of this paper Wyse wyse1942 (1942) expressed the desire of having more accurate measurements of the O ii permitted lines. Aller & Kaler ak1964 (1964) identified more than 100 O ii permitted lines in the spectrum of NGC 7009. Large numbers of permitted lines of other ionic species, such as C ii, N ii, N iii, O iii, Ne ii, were also detected. The majority of these permitted lines are mainly excited by recombination. Other possible excitation mechanisms, such as the dielectronic recombination, radiative charge transfer, and resonance fluorescence by starlight or by some other prominent nebular emission lines, are all by their nature selective, which means that they tend to excite lines from specific spectral terms of certain parity and multiplicity only (e.g., Grandi grandi1976 1976; Liu & Danziger 1993a ; Liu, Danziger & Murdin ldm93 1993). With high signal-to-noise ratio, high spectral resolution and wide wavelength-coverage spectra of PNe now available, more and more ORLs of fainter intensities from heavy element ions that arise from many different multiplets are observed and provide an opportunity to study the radiative and dielectronic recombination processes and test the accuracy of the recombination theories for non-hydrogenic ions. The first systematic study of the ORLs in NGC 7009 was carried out by Liu et al. (liu1995 1995, hereafter LSBC), who analyzed dozens of O ii ORLs, using effective recombination coefficients calculated in the intermediate coupling scheme for transitions from the 3d – 3p and 4f – 3d arrays, and coefficients calculated in the LS coupling scheme for transitions from the 3p – 3s array. LSBC found clear deviations from the LS coupling in the 3d – 3p and 4f – 3d transitions. Luo, Liu & Barlow (luo2001 2001, hereafter LLB01) presented high-quality observations of several dozens Ne ii ORLs in NGC 7009, and derived the Ne2+/H+ abundance ratios from them.
Along with the advance of observational techniques that have enabled the detections of many faint ORLs of heavy element ions in photoionized gaseous nebulae, the recombination theories of heavy element ions, such as C ii, N ii, O ii, and Ne ii, have seen steady improvements since early 1980s (e.g. Storey storey1981 1981; Nussbaumer & Storey ns1983 1983, ns1984 1984, ns1986 1986, ns1987 1987; Escalante & Victor ev1990 1990; Péquignot, Petitjean & Boisson ppb1991 1991; Storey storey1994 1994; LSBC; Kisielius et al. kisielius1998 1998; Davey, Storey & Kisielius davey2000 2000; Kisielius & Storey ks1999 1999, ks2002 2002; Fang, Storey & Liu fsl2011 2011). The high-quality atomic data have been widely used to reveal the physical conditions (electron temperatures and densities) under which the ORLs of heavy element ions arise, and to determine ionic and elemental abundances from them (e.g. Liu et al. liu2000 2000).
In nebular astrophysics there has been a long-standing dichotomy whereby the ionic and elemental abundances of C, N, O and Ne relative to hydrogen determined from ORLs (e.g. C ii M6 4267, N ii M39b 4041, O ii M1 4649 and M48a 4089, Ne ii M55e 4392) are systematically higher than those derived from the much brighter collisionally excited lines (CELs, often referred to as forbidden lines). With high-quality optical spectra now available, detailed studies of this problem have been carried out for several archetypal PNe (LSBC and LLB01 for NGC 7009; Liu et al. liu2000 2000 for NGC 6153; Liu et al. 2001b for M 1-42 and M 2-36; Liu et al. lbzbs06 2006 for Hf 2-2; Garnett & Dinerstein gd2001 2001 for NGC 6720). Several deep optical spectroscopic surveys of PNe, which allow for the analyses of nebulae based on ORLs, have been carried out during the past decade (Tsamis et al. tsamis2003 2003, tsamis2004 2004; Liu et al. 2004a , b; Robertson-Tessi & Garnett rtg2005 2005; Wesson, Liu & Barlow wlb2005 2005; Wang & Liu wl2007 2007). The abundance discrepancy factors (ADFs), defined as the ratio of the abundance derived from ORLs to that deduced from CELs, typically lie in the range 1 – 3. But for a significant number of PNe, ADF values exceeding 5, or even 10, are seen. The highest ADF value (70) of all PNe is found in Hf 2-2 (Liu et al. lbzbs06 2006). Another dichotomy that is closely related to the problem of abundance discrepancy is that nebular electron temperatures derived from the traditional diagnostic [O iii] nebular-to-auroral line ratio are generally higher than those derived from the Balmer jump (BJ) of hydrogen recombination spectrum (e.g. Peimbert peimbert1971 1971; Liu & Danziger 1993b ). A number of postulations have been raised to explain these problems (e.g. Peimbert peimbert1967 1967; Rubin rubin1989 1989; Viegas & Clegg vc1994 1994), but all failed to provide a consistent interpretation of all the available observations. Recenltly, Nicholls, Dopita & Sutherland nicholls12 (2012) explored the possibility that electrons in H ii regions and PNe depart from a Maxwell-Boltzmann equilibrium energy distribution and suggested that a “-distribution” for the electron energies, which are widely found in solar system plasmas, can explain the temperature and abundance discrepancies in H ii regions and PNe. The bi-abundance nebular model proposed by Liu et al. liu2000 (2000), who postulated that PNe (probably also H ii regions) contain H-deficient inclusions, provides a better and natural explanation of the dichotomy. In this model, the faint ORLs of heavy element ions originate mainly from the “cold”, H-deficient inclusions, while the stronger CELs are emitted from the warmer ambient plasma with ‘normal’ chemical composition. Deep spectroscopic surveys and recombination line analysis of individual nebulae in the past decade has yielded strong evidence for the existence of such a “cold” component (see recent reviews by Liu liu2003 2003, 2006a , liu2011 2011).
This is the second of the two papers devoted to very deep spectroscopy of NGC 7009. In the previous paper (Fang & Liu fl2011 2011, hereafter Paper I), we presented high-quality spectra of NGC 7009 and tabulation of all detected lines, including their observed and dereddened intensities, many of which were obtained via careful deblending using the technique of multi-Gaussian profile fitting. We also carried out plasma diagnostics using the CEL ratios, the H i recombination spectrum (including the Balmer and Paschen decrements of the line spectrum, and the Balmer and Paschen jumps of the continuum spectrum), and the He i and He ii recombination spectrum (including the He i recombination line ratios, and discontinuities of the He i and He ii recombination continua). The average electron temperature yielded by CELs, (CELs), is higher than that from the H i Balmer jump, (H i BJ), which in turn is higher than the temperature derived from the He i recombination line ratios, (He i). The current paper focuses on analyses of the optical recombination spectra of heavy element ions detected in the spectrum of NGC 7009. New effective recombination coefficients, including those for the N ii and O ii recombination spectrum that were calculated in the intermediate coupling scheme, are now available and are utilized in the analyses. Plasma diagnostics based on the ORLs of heavy element ions are carried out in Section 2, and the electron temperatures derived from the N ii and O ii ORL ratios agree with each other and are both close to 1200 K. Thus the general pattern of electron temperatures, (CELs) (H i BJ) (He i) (N ii, O ii ORLs), which was predicted by the bi-abundance nebular model (Liu liu2003 2003) and has been seen in many PNe, is confirmed in the current analysis of NGC 7009. A comprehensive analysis of individual multiplets of the C ii, N ii, O ii, and Ne ii recombination spectra are presented in Section 3. The lines are critically examined for potential blending effects. Comparison is made for the observed and predicted relative intensities of the best observed transitions, using the latest effective recombination coefficients. Ionic and elemental abundances are derived in Section 4, where ADFs for the C, N, O, and Ne ionic abundances are calculated. The results are discussed in Section 5, followed by a summary in Section 6.
2 Plasma diagnostics based on the ORLs of heavy element ions
2.1 Effective recombination coefficients
Reliable atomic data, most importantly the effective recombination coefficients of abundant heavy element ions such as C ii, N ii, O ii, and Ne ii, are key to the spectroscopic analysis of photoionized gaseous nebulae. Most of the ab initio calculations of heavy element ions aimed for astrophysical applications hitherto were carried out in the LS coupling scheme. This approximation tacitly assumes a statistical distribution in the population of the fine-structure levels of the recombining ions (i.e., 1 : 2 for the N2+ 2P and 2P levels in the case of N ii; 1 : 3 : 5 for the O2+ 3P0, 3P1 and 3P2 levels in the case of O ii). The assumption of LS coupling may give satisfactory results for some of the low-lying transitions such as those belonging to the 3p – 3s configuration, but not for many of the transitions from the higher 3d – 3p or 4f – 3d configurations. In low-density objects such as H ii regions and evolved PNe, the relative populations of the ground-term fine-structure levels of the recombining ion actually have density-dependence and deviate from the statistical distribution, and so do the relative emissivities of resultant recombination lines. A better treatment of the recombination and the following cascading in a proper coupling scheme is vital for probing the physical conditions in gaseous nebulae.
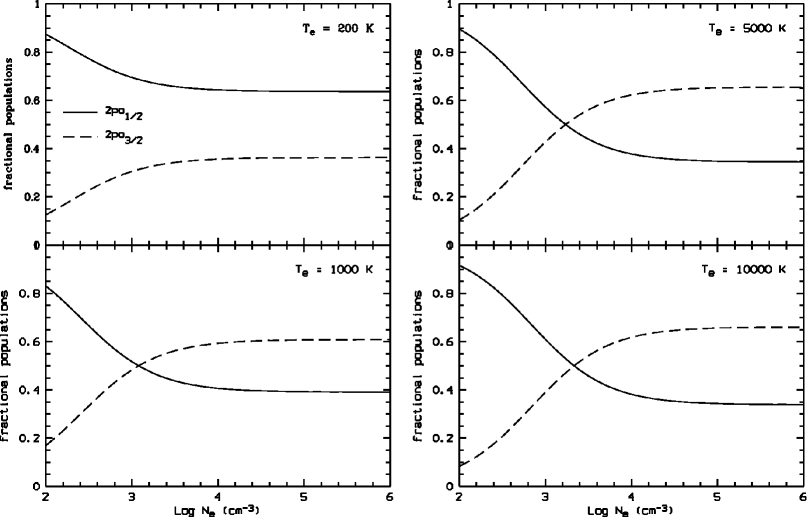
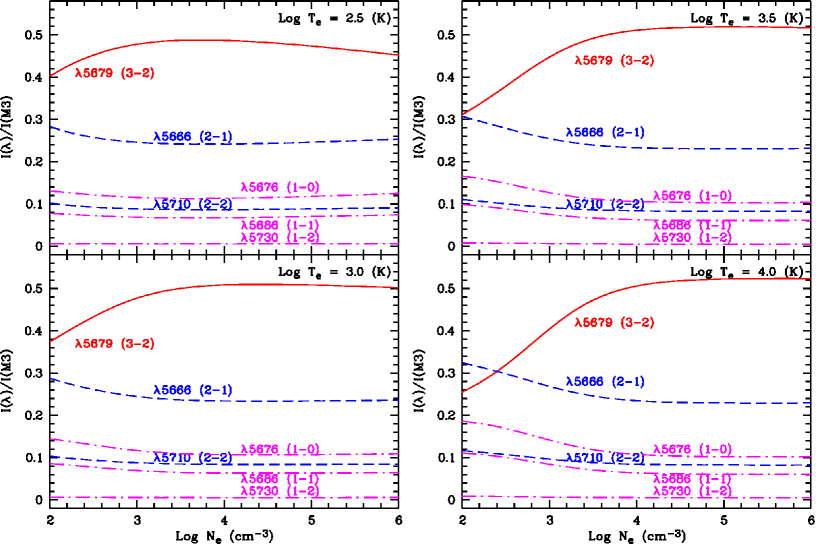
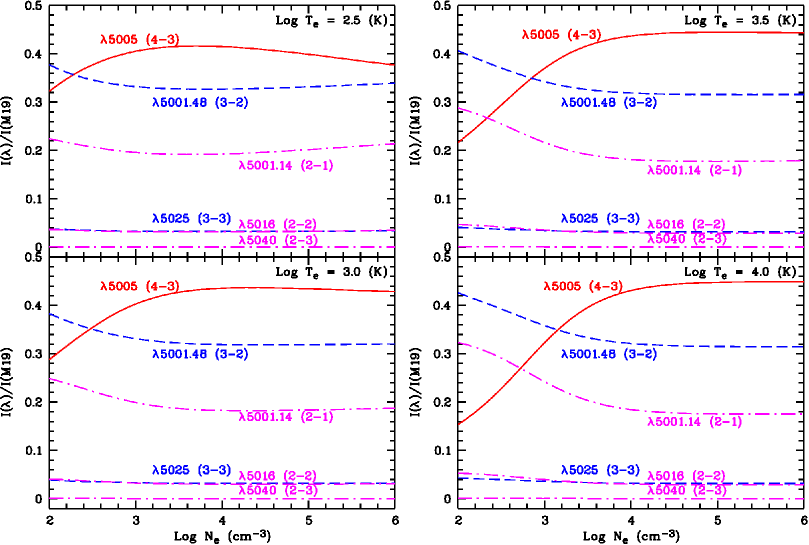
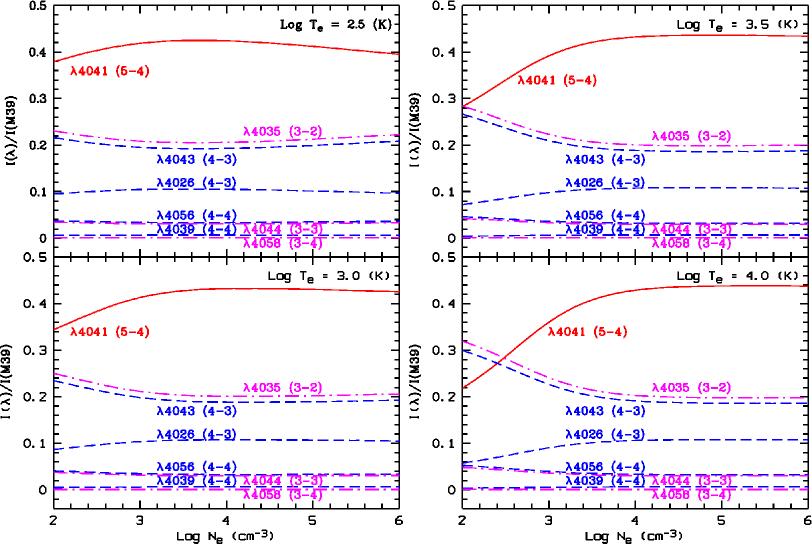
New ab initio calculation of the effective recombination coefficients for the N ii recombination spectrum was presented by Fang, Storey & Liu (fsl2011 2011, hereafter FSL11)111Dr. Daniel Péquignot found some anomalies in the published data of FSL11, which were due to mislabeling of five bound-state energy levels of N ii. The labeling has recently been corrected and the effective recombination coefficients for the N ii lines were re-calculated. A corrigendum has been in preparation. Figs. 2, 3 and 4 in the current paper are based on the revised effective recombination coefficients of N ii., who took into account the density dependence of effective recombination coefficients arising from the density-dependence of relative populations of the ground fine-structure levels of the recombining ion (i.e. N2+ 2P and 2P), an elaboration that has not been attempted before for this ion. The availability of such data opens up the possibility of electron density determination via recombination line analysis. Fig. 1 (also Fig. in FSL11) shows the relative populations of the N2+ 2P and 2P fine-structure levels as a function of electron density under typical nebular conditions. Photoionization cross-sections, bound state energies, and oscillator strengths of N ii with and were obtained using the close-coupling R-matrix method in the intermediate coupling scheme. Photoionization data were computed using an energy mesh which accurately map out the near-threshold resonances, and were used to derive recombination coefficients, including radiative and dielectronic recombination. Also new is the inclusion in the calculations of the effects of dielectronic recombination via high- resonances lying between the 2P and 2P thresholds. The calculated coefficients are valid for temperatures down to an unprecedentedly low level (100 K). Figs. 2, 3 and 4 (also Figs. , and in FSL11) show the theoretical relative intensities of the fine-structure components of the M3 2p3p 3D – 2p3s 3Po, M19 2p3d 3Fo – 2p3p 3D and M39 2p4f G[7/2,9/2] – 2p3d 3Fo multiplets of N ii, respectively, as a function of electron density.
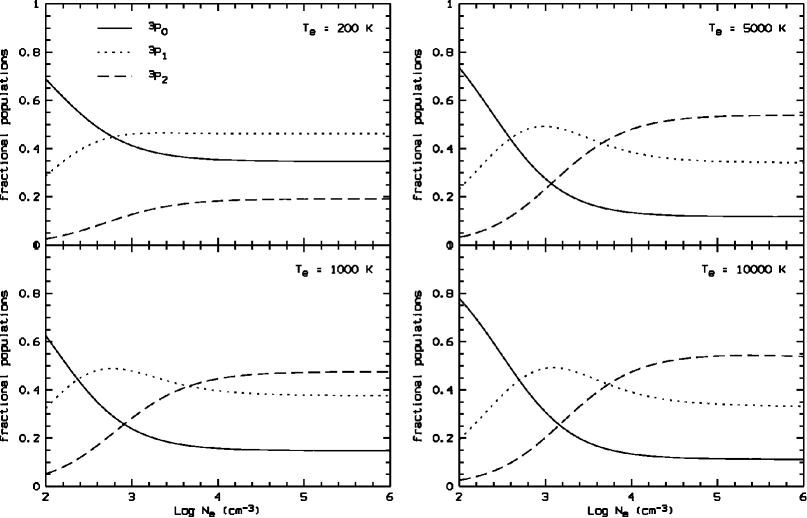
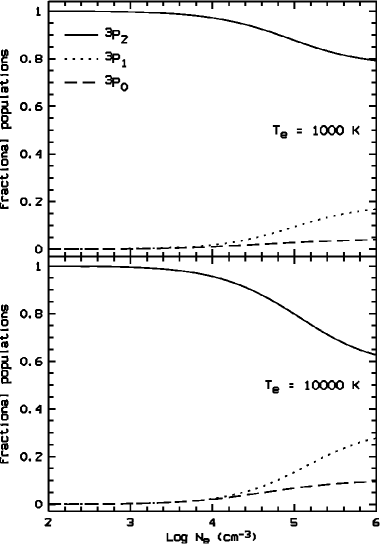
So far, most calculations of the O ii effective recombination coefficients have been in the LS coupling assumption. The first comprehensive treatment of the O ii recombination at nebular temperatures and densities was by Storey storey1994 (1994), who adopted the bound-bound and bound-free radiative data of O ii from the Opacity Project data base (Cunto et al. cunto1993 1993) and took into account cascading as well as the effects of collisions. LSBC presented partial treatment of intermediate coupling effects in transitions between the (3P)4f, (3P)3d, and (3P)3p electron configurations. The most recent calculations of effective recombination coefficients for the O ii recombination spectrum was carried out by P. J. Storey (private communication, hereafter PJS) in the intermediate coupling scheme. Density dependence of the relative populations of the ground-term fine-structure levels of the recombining ion was considered in the level population calculations. Fig. 5 shows the fractional populations of the recombining ion O2+ 3P0, 3P1 and 3P2 fine-structure levels as a function of electron density. The new O ii recombination coefficients were calculated down to a temperature of 400 K. Figs. 6, 7 and 8 show the theoretical relative intensities of the fine-structure components of the O ii M1 2p23p 4Do – 2p23s 4P, M10 2p23d 4F – 2p23p 4Do and M48 4f G[5,4,3]o – 3d 4F multiplets, respectively, as a function of electron density.
The new effective recombination coefficients for the N ii and O ii recombination spectra provide an opportunity to construct nebular plasma diagnostics based on the ORLs of heavy element ions. With those new atomic data, we have determined electron temperatures and densities for over 100 Galactic PNe and 40 Galactic and extragalactic H ii regions (McNabb et al. mfls2011 2011). By comparing our results of plasma diagnostics based on the N ii and O ii ORLs with the electron temperatures given in literature (’s derived from CELs, H i Balmer jump and the He i recombination lines), we find a temperature sequence for about 50 PNe, ([O iii]) (H i BJ) (He i) (N ii & O ii ORLs), which is consistent with predictions from the bi-abundance nebular model postulated by Liu et al. liu2000 (2000).
Kisielius et al. kisielius1998 (1998) published the Ne ii effective recombination coefficients that were calculated in the LS coupling scheme. Only transitions between states with were presented. Preliminary effective recombination coefficients for a few selected lines from the 4f – 3d configuration are available (P. J. Storey, private communication), but only for a single temperature and density case. All the previous calculations of the Ne ii recombination spectrum assumed that the three ground-term fine-structure levels of the recombining ion Ne2+, 3P2, 3P1 and 3P0, are thermalized, i.e. they are populated according to the statistical weights. However, the 3P1 and 3P0 levels have relatively large critical densities: 2.0105 cm-3 for 3P1 and 2.9104 cm-3 for 3P0 at 10 000 K, and these values drop to about half when the electron temperature decreases to 1000 K. At physical conditions lower than the critical densities, the 3P1 and 3P0 levels are underpopulated compared to the values under thermal equilibrium. Fig. 9 shows the fractional populations of the three Ne iii levels as a function of electron density. The effects of the non-equilibrium level populations of Ne iii on the effective recombination coefficients for the 4f – 3d transitions are not clear and may vary from line to line. For the strongest 4f – 3d lines that form exclusively from recombination of target 3P2 plus cascades, their effective recombination coefficients will be underestimated if a thermal equilibrium of the Ne iii ground levels is assumed, and that will cause a corresponding overestimation of the derived Ne2+/H+.
Many Ne ii recombination lines from different multiplets have been observed in deep spectra of PNe and H ii regions and ionic abundances derived (e.g. LLB01). However, a proper analysis of those data requires new calculations in an appropriate coupling scheme for the strongest Ne ii recombination lines, especially those belonging to the 3d – 3p and 4f – 3d transition arrays.
2.2 Electron temperature from the C ii recombination lines
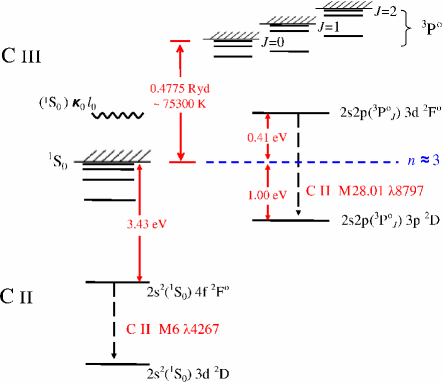
Most C ii lines detected in the spectrum of NGC 7009 are mainly excited by radiative recombination, except for a few for which dielectronic recombination dominates. Examples of the latter include the C ii M28.01 3d′ 2Fo – 3p′ 2D 8797 multiplet, which originates from dielectronic capture of an electron to the 2s2p(3P)3d 2Fo autoionization state that lies 0.41 eV (Moore moore1993 1993) above the first ionization threshold 2s2 1S0 and the subsequent decay to the 2s2p(3P)3p 2D bound state that lies about 1.00 eV below the ionization threshold. Fig. 10 is a schematic diagram that shows the dielectronic and radiative recombination of C ii.
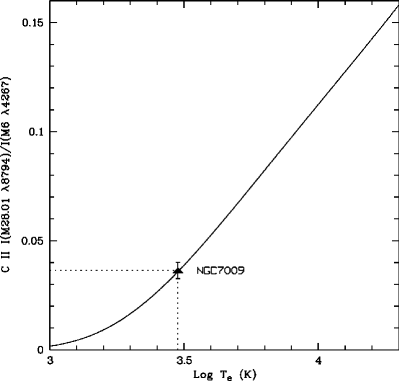
The electron on an autoionizing state either decays to another autoionizing or bound state with the emission of radiation, or autoionizes to a true continuum state leaving an ion and a free electron with no emission of radiation. The latter process usually dominates, and the population of autoionization states is close to that given by Saha and Boltzmann equations as in the case of the local thermodynamic equilibrium (LTE). The emissivity of a dielectronic recombination line is sensitive to electron temperature through the Boltzmann factor , where is the excitation energy of the upper state relative to the ionization threshold. By comparing the strength of a dielectronic recombination line to that of an ordinary (i.e. radiative recombination dominated) recombination line, whose emissivity has a relatively weak power-law dependence on electron temperature (, where 1), one can determine the electron temperature. The C ii dielectronic lines have been used to determine electron temperatures in stellar winds of PNe (e.g. De Marco et al. dsb1998 1998). The strongest C ii recombination line detected in the spectra of nebulae is the M6 4f 2Fo – 3d 2D 4267 line, which is excited by radiative recombination only. The upper state of the 4267 line lies about 3.4 eV below the ionization threshold 2s2 1S0 (see Fig. 10), and its population is far from LTE, and thus has a very different temperature-dependence from that of the upper state of the M28.01 8797 transition (i.e. 3d′ 2Fo). We use the intensity ratio of the 8793.80 (3d′ 2F – 3p′ 2D5/2) line, the stronger fine-structure component of the C ii M28.01 multiplet, and the 4267 line to determine electron temperature. In NGC 7009, this line ratio yields a temperature of 3000 K, as shown in Fig. 11. The atomic data used here are the effective dielectronic and radiative recombination coefficients of Nussbaumer & Storey ns1984 (1984) and Péquignot, Petitjean & Boisson ppb1991 (1991), respectively. Measurements of the C ii M28.01 lines are presented in Section 3.1.2.
2.3 Electron temperatures and densities from the N ii and O ii recombination lines
In the low-density conditions in nebulae, the relative populations of the ground-term fine-structure levels of a recombining ion (e.g., N2+ 2P and 2P in the case of N ii) vary with electron density, and this is reflected in the density dependence of the resultant emissivities (i.e. the effective recombination coefficients) of different recombination lines within a multiplet of the recombined ion. Thus by comparing the intensities of two ORLs belonging to the same multiplet but formed from different parent levels one can determine electron density. At typical nebular conditions, emissivities of heavy element recombination lines have only a weak, power-law dependence on electron temperature, (), and in general, the line ratios depend very little on temperature. However, the temperature sensitivity still differs for recombination lines decaying from levels of different orbital angular momentum quantum number , and this difference becomes more profound if two lines of very different are compared. Thus the intensity ratio of two lines from multiplets of different can be used to determine electron temperature, provided that the measurements are precise enough (e.g. Liu liu2003 2003; FSL11).
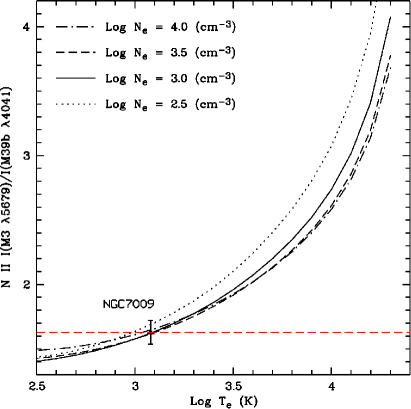
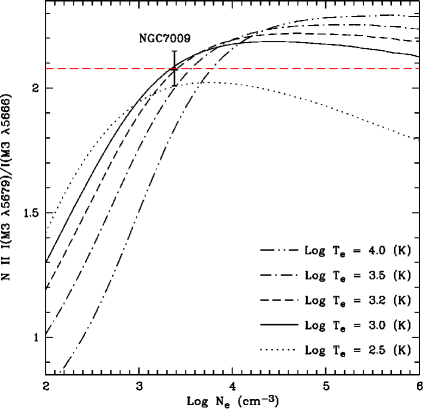
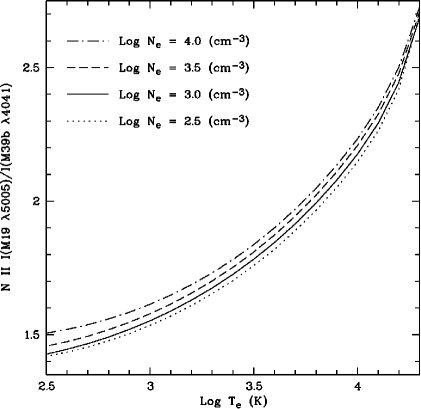
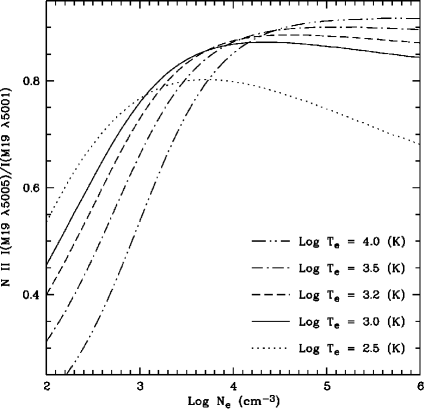
Figs. 12 and 13 show that the N ii line ratio 5679/4041 observed in NGC 7009 yields an electron temperature of 1200200 K, whereas the 5679/5666 ratio yields a density of 2000 – 3000 cm-3. The 5679.56 line is the strongest fine-structure component of the N ii M3 3p 3D – 3s 3Po 5679 multiplet, and forms exclusively from the 2P core capturing an electron plus cascades from higher levels, while the second strongest line 5666.63 can form, in addition, from recombination of the 2P core. For the target N2+, the population of the fine-structure level 2P relative to 2P increases with electron density due to collisional excitation, and this results in an increase of the 5679.56 intensity relative to the 5666.63 line with density, as shown in Fig. 2. Thus the 5679/5666 ratio can be used as a density diagnostic. The 4041.31 line belongs to the N ii M39b 4f G[9/2] – 3d 3Fo multiplet and is the strongest among the N ii 4f – 3d array. It forms from recombination of the 2P core plus cascades from higher levels. The intensity ratio of the 5679.56 and 4041.31 lines has a relatively strong temperature dependence, and thus can serve as a temperature diagnostic. In the spectrum of NGC 7009, the 5666.63 line is free of blending and is amongst the best observed N ii ORLs, while the 5679.56 and 4041.31 lines are affected by line blending. Accurate measurements of the latter two lines were obtained using multi-Gaussian profile fits (see Section 3.2). The M19 2p3d 3Fo – 2p3p 3D multiplet is the strongest of the 3d – 3p configuration of N ii. The density-dependence of the relative emissivities of the two strongest fine-structure components of M19 is noticeable (Fig. 3). The intensity ratio of those components, 5005.15/(5001.14 + 5001.48), may serve as another density diagnostic. Similarly, the intensity ratio of the 5005.15 and M39b 4041.31 lines may be used to determine electron temperature. Figs. 14 and 15 show the 5005/5001 and 5005/4041 ratios of N ii as a function of electron density and temperature, respectively. However, accurate measurements of the N ii M19 lines are essentially impossible due to the presence of the extraordinarily strong [O iii] 5007 line, which is often strongly saturated in deep spectra.
Some N ii states of parentage other than 2Po have energies
even higher than the 2p(2Po)4f G[9/2] spectral term, which is
the upper state of the M39b 4041.31 line. The intensity ratio of an
N ii recombination line that originates from one of those high-energy
states to the M3 5679.56 line can also be used as a temperature
diagnostic. Possible candidates in the optical waveband for such application
are, e.g. the M63 3p′ 5Do – 3s′ 5P,
M66 3d′ 5F – 3p′ 5Do and M72
4f′ 5Go – 3d′ 5F multiplets.
According to the experimental data given by NIST222The NIST Spectra
Database
, the
upper state of the M63 multiplet is about 1.85 eV below the ionization
threshold N iii 2P, while the upper states of the
M66 and M72 multiplets are 0.53 and 3.67 eV, respectively, above this
threshold. The R-matrix calculation of the bound-state energy levels of
N ii in FSL11 only extends to about
0.45 eV (corresponding to in the principal series of N ii)
below the ionization threshold. Thus only the energy levels of the
2s2p2(4P) 3s and 2s2p2(4P) 3p configurations (i.e., the
levels of the 5P, 3P, 3So, 5Do,
5Po, 3Do, 5So and 3Po
spectral terms, in the energy order given by NIST) are included in the
R-matrix calculation and the N ii recombination lines that originate
from those levels are precisely calculated. In principle, the intensity ratio
of the 5679.56 and the 5535.36 lines, the strongest
fine-structure components of the M3 3p 3D – 3s 3Po
and the M63 3p′ 5Do – 3s′ 5P
multiplets of N ii, respectively, can be used to determine electron
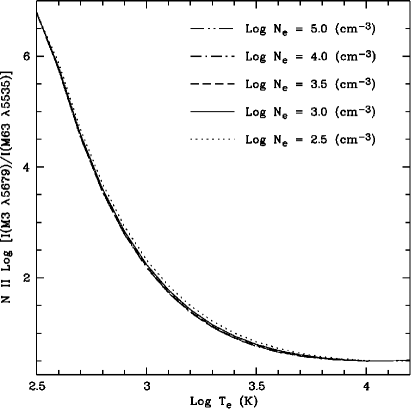
temperature. Fig. 16 shows the 5679/5535
ratio as a function of electron temperature, and this relation is quite
insensitive to electron density in the logarithmic scale. However, accurate
measurements of the 5535.36 line is difficult due to weakness (about
104 times weaker than H). We have not detected any N ii
lines of the parentage other than 2Po in the deep spectrum of
NGC 7009.
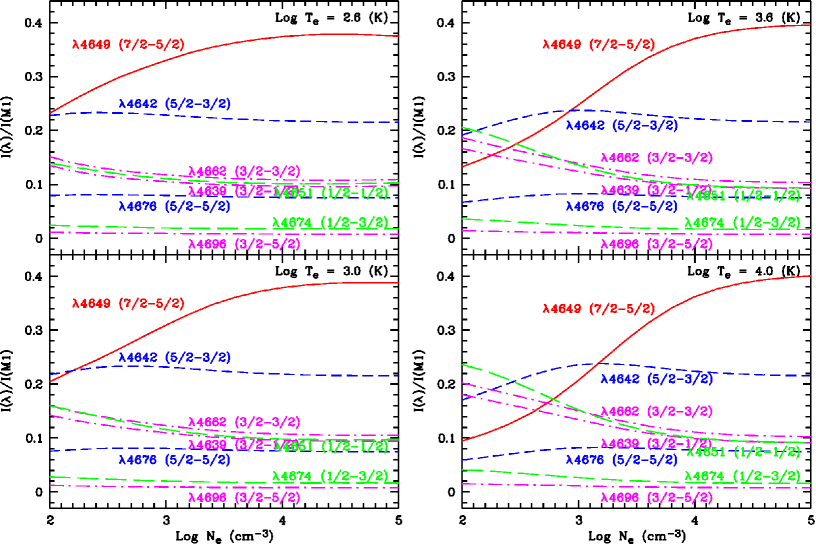
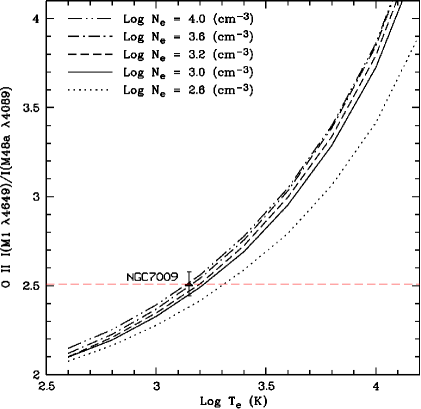
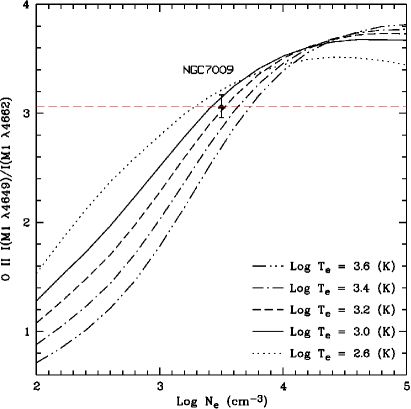
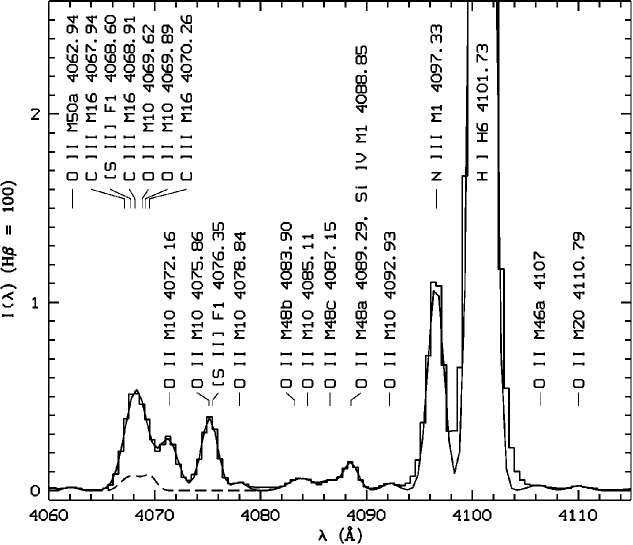
The 4649.13 line is the strongest of the O ii M1 3p 4Do – 3s 4P multiplet, and forms only from recombination of the 3P2 core plus cascades from higher energy levels, while another O ii M1 line 4661.63 can form, in addition, from recombination of the 3P0 and 3P1 cores. For the recombining ion O2+, the population of the fine-structure level 3P2 relative to 3P0 and 3P1 increases with electron density due to collisional excitation, and so does the resultant emissivity of the 4649.13 line relative to the 4661.63 line, as is shown in Fig. 6. Thus the intensity ratio 4649/4662 can serve as a density diagnostic. The 4089.29 line (M48a 4f G[5] – 3d 4F9/2) is the strongest amongst the O ii 4f – 3d array, and forms from recombination of the 3P2 core. The intensity ratio of the 4089.29 and the 4649.13 lines has a strong temperature dependence, and can be used to determine electron temperature. Figs. 17 and 18 show that the observed O ii line ratios 4649/4089 and 4649/ in NGC 7009 yield an electron temperature of 1400300 K and a density of 2500 – 4000 cm-3, respectively. Although the 4661.63 line is the third strongest in the O ii M1 multiplet, it is free from line blending and thus best observed, while the 4649.13 and 4089.29 lines both suffer from line blending: the 4649.13 line is blended with another O ii M1 line 4650.84 and the three C iii M1 lines 4647.42, 4650.25 and 4651.47; the 4089.29 line is contaminated by the Si iv M1 4088.86 (4p 2P – 4s 2S1/2) line. Multi-Gaussian fitting was carried out to derive the intensities of the two O ii ORLs, and both intensities are accurate to within 20 per cent. Details of spectral fits are given in Section 3.3.
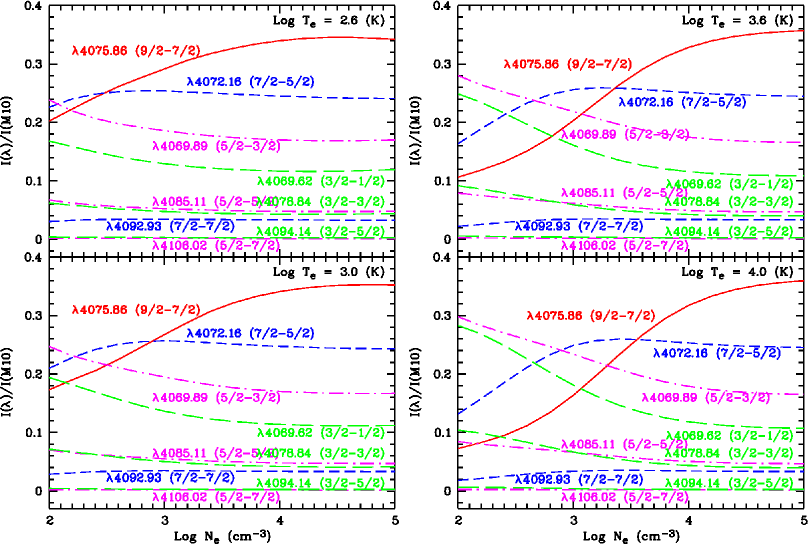
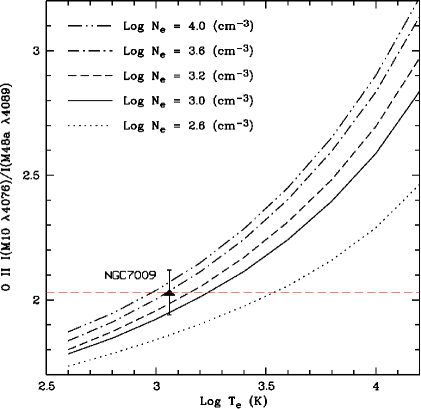
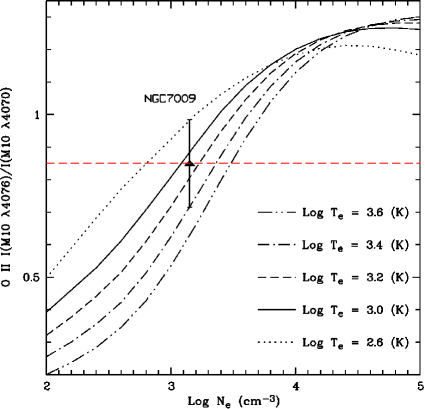
The M10 3d 4F – 3p 4Do 4075 multiplet is the strongest transition of the 3d – 3p configuration of O ii. Given the opposite trends of the fractional intensities of the 4075.86 and 4069.89,62 lines, the three fine-structure components of M10, as a function of electron density, as shown in Fig. 7, the intensity ratio of the two lines may serve as another density diagnostic. Here the 4075.86 line is the strongest component of the M10 multiplet. The intensity ratio of the 4075.86 line and the 4089.29 line, the strongest fine-structure component of the M48a 4f G[5]o – 3d 4F multiplet of O ii, can be used as another temperature diagnostic. Figs. 19 and 20 show the 4076/4089 and 4076/4070 as a function of electron temperature and density, respectively. Here the intensity of the 4070 line is a sum of the 4069.89 (M10 3d 4F5/2 – 3p 4D) and 4069.62 (M10 3d 4F3/2 – 3p 4D) lines. If we assume a density of about 4300 cm-3, as derived from CEL ratios (Paper I), the electron temperature deduced from the O ii 4076/4089 ratio is 1150300 K for NGC 7009. The electron density derived from the O ii 4076/4070 ratio is of large uncertainty, due to the relatively large measurement uncertainties of the two lines. The 4075.86 line is blended with [S ii] 4076.35 (3p3 2P – 4S) line, while the 4069.89,62 line is blended with the [S ii] 4068.60 (3p3 2P – 4S) line and the three C iii M16 5g 3G – 4f 3Fo lines 4067.94, 4068.92 and 4070.31. Multi-Gaussian profile fitting was carried out to obtain line fluxes (c.f. Section 3.3.2).
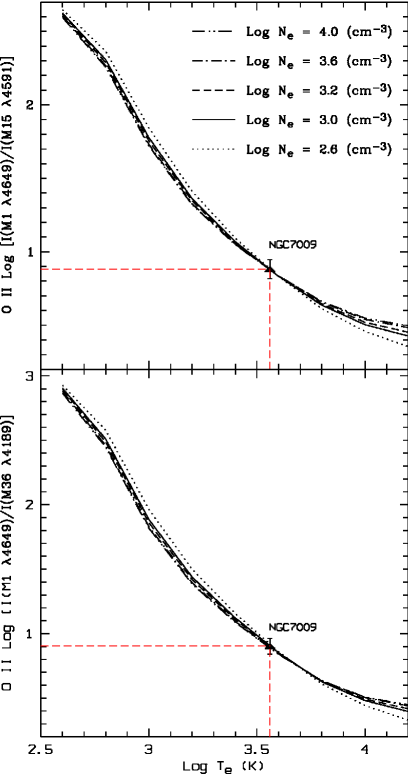
Several O ii recombination lines with parentage other than 3P have been detected in the spectrum of NGC 7009. These lines belong to the M15 3p′ 2Fo – 3s′ 2D, M36 3d′ 2G – 3p′ 2Fo, M101 4f′ H[5]o – 3d′ 2G, and M105 4f′ P[1]o – 3d′ 2S multiplets of O ii. According to the experimental data from NIST, the upper states of the M15 and M36 multiplets are 6.76 and 3.80 eV, respectively, below the ionization threshold O iii 3P0, while the upper states of the M101 and M105 multiplets are about 0.89 and 0.87 eV, respectively, below this threshold. In the most recent calculation of PJS for the O ii effective recombination coefficients, only the transitions between the levels with principal quantum number 6 (i.e. corresponding to 1.50 eV below the ionization threshold 3P0) were presented. Thus only the effective recombination coefficients of the M15 and M36 lines are available. The strongest fine-structure components of the M15 and M36 multiplets are 4590.97 (3p′ 2F – 3s′ 2D5/2) and 4189.79 (3d′ 2G9/2 – 3p′ 2F), respectively, and both lines are detected in the deep spectrum of NGC 7009, as shown in Figs. 42 and 31. Although the effective recombination coefficients of the M101 and M105 multiplets are not available, the strongest fine-structure component of the M101 multiplet, the 4253.90 (4f′ H[5] – 3d′ 2G9/2) line, is also detected (Fig. 31). Fig. 21 shows the O ii line ratios 4649.13/4590.97 and 4649.13/4189.79 as a function of electron temperature. The figure also shows that the two line ratio–temperature relations are insensitive to electron density, indicating that they are good temperature diagnostics. Both line ratios detected in the spectrum of NGC 7009 yield electron temperatures close to 3600 K.
2.4 The Ne ii recombination lines as potential plasma diagnostics
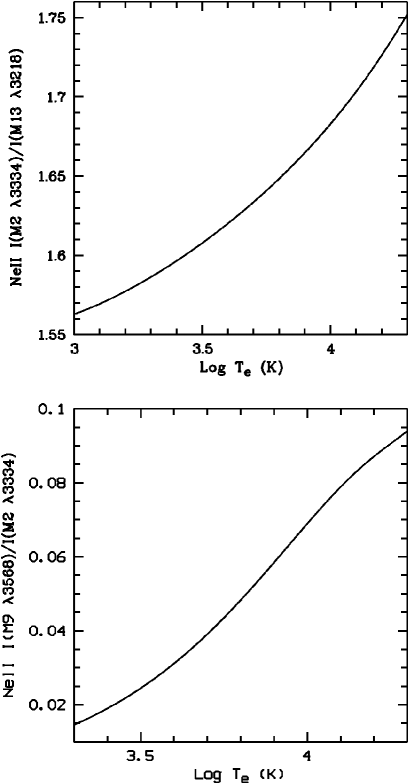
So far no efforts have been attempted for plasma diagnostics based on the Ne ii recombination spectrum, partly due to the lack of suitable effective recombination coefficients. Since all Ne ii effective recombination coefficients were calculated under the LS coupling scheme, and relative populations of the 3P2, 3P1 and 3P0 parent levels were assumed to be proportional to the statistical weights, no density diagnostic is possible with the current available atomic data. However, the Ne ii recombination line ratios may still serve as temperature diagnostics using the effective recombination coefficients of Kisielius et al. kisielius1998 (1998). The M2 3p 4Do – 3s 4P 3337 multiplet is the strongest transition of the 3p – 3s configuration, and M13 3d 4F – 3p 4Do 3220 is the strongest multiplet of the 3d – 3p configuration of Ne ii. The intensity ratio of the strongest fine-structure components of those two multiplets, 3334.84/3218.19, may be serve as a temperature diagnostic, as shown in the upper panel of Fig. 22. In order to obtain reliable electron temperature, the measurement uncertainty of the 3334/3218 ratio needs to be less than 10 per cent, which is very demanding to achieve.
Recombination of the Ne2+ 1D core plus cascades gives rise to another series of Ne ii recombination lines, and the strongest multiplet of this series is M9 3p′ 2Fo – 3s′ 2D 3571. The intensity ratio of the 3568.50 line, the strongest fine-structure component of the M9 multiplet, and the M2 3334.84 line may be used as another temperature diagnostic, as shown in the lower panel of Fig. 22. The calculation of Kisielius et al. kisielius1998 (1998) shows that the 3568/3334 ratio is only marginally sensitive to electron temperature. In order to derive reliable temperature, the line ratio (especially the 3568 line) needs to be measured to a very high accuracy level. Although the temperature range considered in the calculation of Kisielius et al. kisielius1998 (1998) is from 1000 to 20 000 K, the current analytic fit to the effective recombination coefficient for the 3568 line is only valid for 2000 –20 000 K. As a consequence, the usage of the diagnostic curve of the 3568/3334 ratio in Fig. 22 outside this temperature range is not recommended. The Ne ii 3334/3218 and 3568/3334 ratios observed in NGC 7009 are 1.86 and 0.40, respectively, both falling outside the diagnostic ranges of Fig. 22.
2.5 The C iii, N iii and O iii recombination lines as potential temperature diagnostics
In this Section, we discuss the possibility of using the C iii, N iii and O iii optical recombination line ratios to determine electron temperatures. Although some of those lines are detected in the spectrum of NGC 7009, they are not used for plasma diagnostics in the current paper, due to the lack of adequate atomic data. Unless otherwise specified, the effective recombination coefficients of Nussbaumer & Storey ns1984 (1984) and Péquignot, Petitjean & Boisson ppb1991 (1991) are used to create the diagnostic curves.
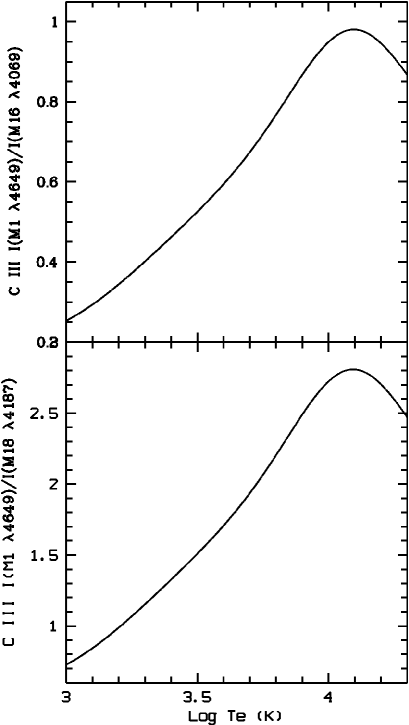
The C iii lines are excited by recombination only, and the ratios of the best observed lines can be used as temperature probes. The intensity ratio of the M1 4649 (3p 3Po – 3s 3S) and M16 4069 (5g 3G – 4f 3Fo) multiplets of C iii is sensitive to electron temperature, as shown in the upper panel of Fig. 23. The intensity ratio of the C iii triplet M1 4649 and singlet M18 4187 (5g 1G – 4f 1Fo) can also be used to determine electron temperature, as shown in the lower panel of Fig. 23. However, those C iii lines all suffer from line blending. The 4187 line is blended with the O ii M36 4185.45 (3d′ 2G7/2 – 3p′ 2F) line, but its intensity can be measured to a high accuracy using multi-Gaussian profile fitting (Fig. 31). The C iii M1 4649 triplets are blended with the O ii M1 3p 4Do – 3s 4P lines 4649.13 and 4650.84 (Fig. 32), and the C iii M16 4069 triplets are blended with three O ii M10 3d 4F – 3p 4Do lines and the [S ii] 4068.60 line (Fig. 33). Intensities of the C iii M1 and M16 multiplets are obtained from multi-Gaussian profile fitting. The intensity ratio of the fine-structure components of each multiplet was assumed to be as in LS coupling (Sections 3.3.1 and 3.3.2). In NGC 7009, the C iii (M1 4649)/(M16 4069) and (M1 4649)/(M18 4187) ratios are 1.05 and 3.41, respectively. Both ratios are beyond the diagnostic ranges of Fig. 23.
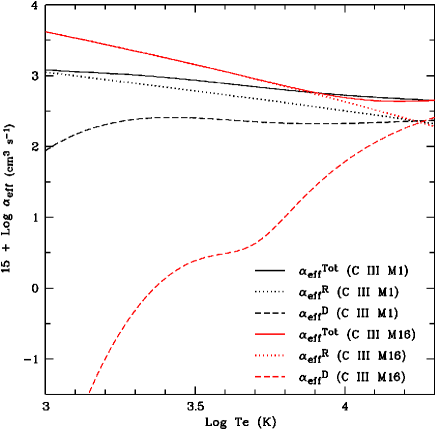
Fig. 23 shows that the C iii (M1 4649)/(M16 4069) and (M1 4649)/(M18 4187) ratios increase with electron temperature below 10 000 K, but both decrease when the temperature goes beyond 12 600 K ( 4.1). In order to explain those trends, the effective radiative () and dielectronic () recombination coefficients as well as the total effective recombination coefficients () of the C iii M1 and M16 multiplets are shown in Fig. 24 as a function of electron temperature. Below 10 000 K, the C iii M16 multiplet is dominated by radiative recombination. In this temperature regime, the total effective recombination coefficient of the C iii M16 multiplet decreases much faster than that of the M1 multiplet as temperature increases. When the temperature goes above 10 000 K, the decreasing rate of the M16 multiplet slows down because its monotonically increasing dielectronic recombination coefficient becomes relatively significant, while that of the M1 multiplet does not change much.
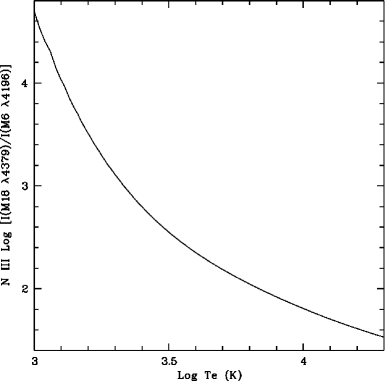
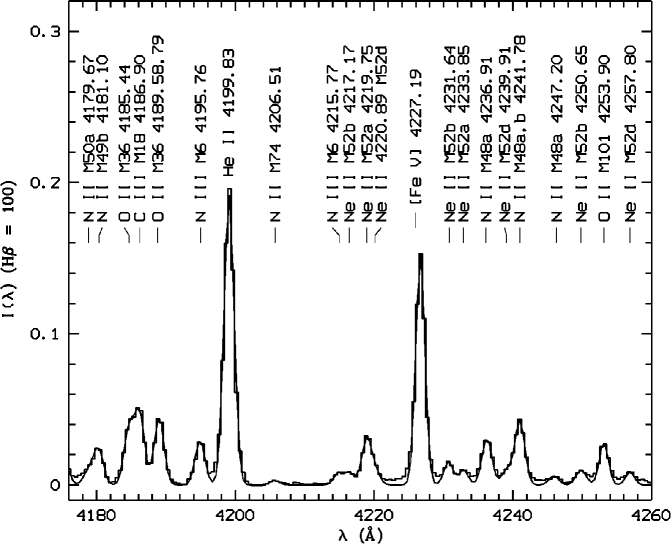
The most prominent permitted transitions of N iii in optical, the M1 4100 (3p 2Po – 3s 2S) and M2 4641 (3d 2D – 3p 2Po) multiplets, are affected by the Bowen fluorescence mechanism (e.g. Bowen bowen1934 1934, bowen1935 1935). The N iii M18 4379.11 (5g 2G – 4f 2Fo) line is amongst the best observed N iii lines in the spectrum of NGC 7009, which are not affected by the fluorescence processes. The intensity ratio of the 4379.11 line and the 4195.76 line, which is the second strongest fine-structure component of the N iii M6 3p′ 2D – 3s′ 2Po multiplet, can be used as a temperature diagnostic. Fig. 25 shows the N iii 4379/4196 ratio as a function of electron temperature. The dominant excitation mechanism of the N iii M18 multiplet is radiative recombination, while the M6 multiplet is mainly excited by dielectronic recombination. The other two fine-structure components of the N iii M6 multiplet, 4200.10 and 4215.77 cannot be used: the former one is blended with the He ii 4199.83 (11g 2G – 4f 2Fo) line, which is more than three times stronger, and the latter one cannot be accurately measured due to weakness (10-4 of the H intensity). Another N iii multiplet, M17 5f 2Fo – 4d 2D 4003, when used in pair with the N iii M6 4195.76 line, may also be a temperature diagnostic, but its radiative recombination coefficients are unknown. The N iii M17 lines are detected in the spectrum of NGC 7009 (Fig. 45).
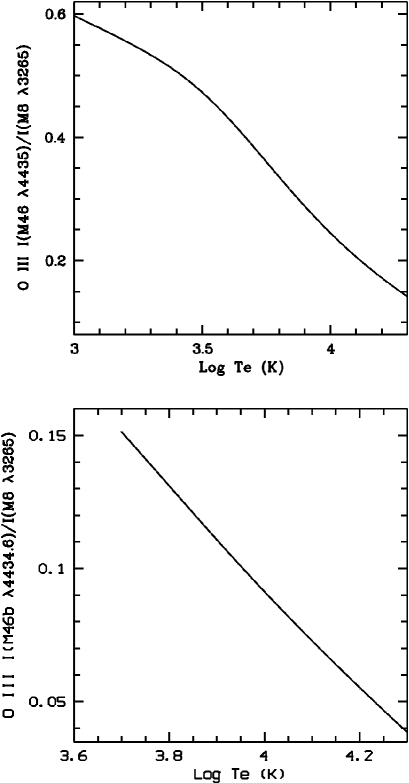
The majority of the O iii triplets of the 3d – 3p and 3p – 3s configurations detected in the spectrum of NGC 7009 are mainly excited by the fluorescence or charge-transfer mechanism (e.g. Liu & Danziger 1993a ; Liu, Danziger & Murdin ldm93 1993). Thus those lines are not suitable for plasma diagnostics or abundance determinations. However, the O iii M8 3d 3Fo – 3p 3D multiplet is unaffected by such mechanisms. The intensity of the strongest component of the O iii M8 multiplet, 3265.32 (3d 3F – 3p 3D3), relative to the best observed O iii 5g – 4f line, can in principle be used as a temperature diagnostic. The O iii M8 multiplet is mainly excited by radiative recombination at temperatures below 5000 K, and the contribution of dielectronic recombination to the total recombination rate catches up with that of the radiative recombination at about 16 000 K (Nussbaumer & Storey ns1984 1984; Péquignot, Petitjean & Boisson ppb1991 1991). The O iii 5g – 4f lines are dominantly excited by radiative recombination. The upper panel of Fig. 26 shows the intensity ratio of the M46b 4435 (5g H[11/2]o – 4f G[9/2]) multiplet, the strongest transition of the 5g – 4f configuration, and the M8 3265.32 line as a function of electron temperature. Péquignot, Petitjean & Boisson ppb1991 (1991) present the radiative recombination coefficients of both the M8 and M46b multiplets of O iii, while Nussbaumer & Storey ns1984 (1984) only give the dielectronic recombination coefficients of M8. The lower panel of Fig. 26 shows the intensity ratio of the 4434.60 (5g H[11/2] – 4f G[9/2]5) line, the strongest fine-structure component of the M46b multiplet, and the M8 3265.32 line as a function of electron temperature. The effective recombination coefficients of the M46b 4434.60 line are adopted from Kisielius & Storey ks1999 (1999), whose calculations for the O iii 5g – 4f recombination spectrum were carried out in the intermediate coupling scheme and valid from 5000 to 20 000 K. Measurement of the 4434.60 line is of large uncertainty due to line blending. The other O iii 5g – 4f lines are not detected in the spectrum of NGC 7009.
2.6 Summary of the ORL diagnostics
We have discussed about the possibility of using various recombination line ratios of heavy element ions to determine electron temperatures and densities. The line ratios are illustrated as a function of temperature or density. For some cases, there is still a lack of adequate effective recombination coefficients or the expected lines are not detected in the spectrum of NGC 7009 due to weakness and/or line blending. The O iii lines of the 5g – 4f configuration are not detected. Fig. 26 is probably applicable once deep spectra with higher resolution are available. The effective recombination coefficients for the C iii, N iii and O iii lines quoted from Nussbaumer & Storey ns1984 (1984) and Péquignot, Petitjean & Boisson ppb1991 (1991) are probably inadequate, which can be inferred from the fact that the observed line ratios are all outside of the diagnostic ranges of Figs. 23 and 25.
The applicability of Figs. 14 and 15 is quite small, given that the N ii M19 lines are close to the O iii 5007 line. The N ii and O ii recombination lines of parentage other than the ground states of the recombining ions are good temperature diagnostics. As shown in Figs. 16 and 21, those line ratios are insensitive to electron density. The electron temperatures derived from the two O ii line ratios (4649/4591 and 4649/4189) in Fig. 21 are consistent with each other, and are close to the temperature value yielded by the C ii 8794/4267 ratio as shown in Fig. 11. Although no N ii lines of parentage other than 2Po are detected in the spectrum of NGC 7009 due to weakness, they are promising diagnostic tools in spectroscopy. The most reliable temperatures derived from the ORLs of heavy element ions are those yielded by the N ii and O ii lines, as shown in Figs. 12 and 17. Currently only the N ii and O ii recombination lines can be used to determine electron density, since the density dependence of the population distributions of the energetically lowest fine-structure levels of the recombining ions have been taken into account in the recombination calculations for those two ions (this effect was also considered by Kisielius & Storey ks1999 1999 for the calculation of the 5g – 4f recombination lines of O iii). Figs. 13, 18 and 20 all show large scatter in electron density for a given line ratio observed in NGC 7009. This is reasonable because the ORL ratios only have very weak density dependence. New treatment of the Ne ii recombination in the intermediate coupling scheme is needed.
3 The optical recombination spectrum of heavy elements
In this section, we present a comprehensive analysis of the most significant permitted transitions of C ii, N ii, O ii, and Ne ii as well as C iii, N iii and O iii detected in the spectrum of NGC 7009 reported in Paper I. The lines are critically examined for potential blending effects and compared to theoretical predictions using the latest atomic data. Unless specified otherwise, all intensities quoted throughout the paper are corrected for interstellar extinction333In Paper I, we derived a mean value of 0.174 for the logarithmic extinction at H, (H), using the observed H i Balmer line ratios H/H and H/H. The predicted H i line ratios in the Case B assumption were adopted from Storey & Hummer sh1995 (1995), with = 10 000 K and = 10 000 cm-3. and in units of (H) = 100, and the theoretical intensities/ratios are predicted assuming an electron temperature of 1000 K as given by the N ii and O ii ORL diagnostics (Figs. 12 and 17). The wavelengths of atomic transitions are adopted from the compilation of laboratory and theoretical values of Hirata & Horaguchi hh1995 (1995). The extinction-corrected flux of H, (H), of NGC 7009 is derived using = + (H), where (H) is the observed H flux ( in logarithm), which is adopted from Cahn, Kaler & Stanghellini cks92 (1992), and (H) is the logarithmic extinction at H, which was derived from the H i Balmer line ratios H/H and H/H (Paper I). The value of (H) we derived for NGC 7009 is 0.174, which agrees with the value (0.17) given by Cahn, Kaler & Stanghellini cks92 (1992), who used the radio/H flux ratio. Thus in NGC 7009 we have (H) = 10-9.63 erg cm-2 s-1.
3.1 The C ii optical recombination spectrum
Several dozen emission lines were identified as the permitted transitions of C ii, with 41 being solid identifications (Paper I). The strongest transitions are presented in the current paper. As an example, we give principles of fits for the multiplets M6 and M28.01 in this section. The other multiplets are presented in Appendix A. The effective recombination coefficients of Davey, Storey & Kisielius davey2000 (2000) are used for ORL analysis.
3.1.1 Multiplet 6, 4f 2Fo – 3d 2D
C ii M6 4267 is the strongest C ii multiplet observed in NGC 7009 (see Fig. 34). The three fine-structure components of this multiplet have close wavelengths: 4267.00, 4267.26 and 4267.26 Å. Single Gaussian profile fitting to the emission feature gives an intensity of 0.880 (normalized to a scale where H = 100), with an uncertainty of less than 5 per cent. Here the contributions from the O ii M53c 4f D[1] – 3d 4P5/2 4263.27 and Ne ii M57c 4f 1[3] – 3d 4F9/2 4267.38 lines are negligible. This intensity value agrees with LSBC, whose observation yields a value of 0.838. The calculation of Bastin (bastin2006 2006, hereafter B06) shows that the Case A effective recombination coefficient for the C ii M6 line differs from that in Case B by 1.5 per cent, and a similar difference is given by Davey, Storey & Kisielius davey2000 (2000), indicating that this transition is case insensitive.
3.1.2 Multiplet 28.01, 3d′ 2Fo – 3p′ 2D
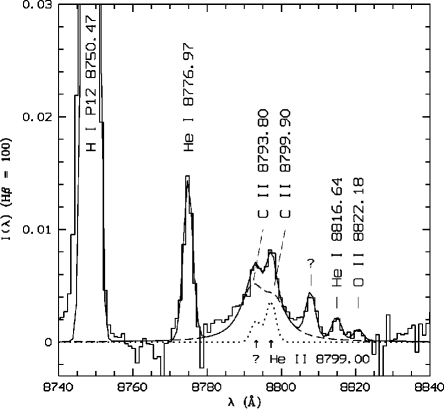
This multiplet is a dielectronic transition, which is a result of cascading from the autoionization state 2s2p(3Po) 3d 2Fo that lies about 0.41 eV above the first ionization threshold to the 2s2p(3Po) 3p 2D state that lies 1.00 eV below the ionization threshold (Moore moore1993 1993). The features of the two fine-structure components, 8793.80 (3d′ 2F – 3p′ 2D5/2) and 8799.90 (3d′ 2F – 3p′ 2D3/2) are very broad (Fig. 27). The wings of the two lines obviously affect the weaker emission features nearby. Detailed analysis of the complex indicates that at least two more emission lines are blended with the two C ii lines: one is the He ii 23p 2Po – 6s 2S 8799.0 line, while the other is unknown. The results of fitting to the features are shown in Fig. 27.
For each of the two C ii M28.01 lines, we used a simulated Lorentz profile with an intrinsic width of 6.86 Å convolved with a Gaussian instrumental profile with a full width at half-maximum (FWHM) of 3.00 Å to fit the observed feature. The convolution of the Lorentz profile and Gaussian gives a Voigt profile with a width of 8.50 Å, which fits the observed features quite well (Fig. 27). The intensity contribution of the blended He ii 8799 line was estimated from the He ii 4f 2Fo – 3d 2D 4686 line and the hydrogenic theory of Storey & Hummer sh1995 (1995). an electron temperature of 10 000 K and a density of 10 000 cm-3 were assumed. After correcting for the contribution from the He ii line, the intensity of the 8799.90 line is 0.0220.003. With the assumption that the relative intensity of the two C ii M28.01 lines are as in the LS coupling, i.e. 1.0 : 0.7, the intensity of the 8793.80 line is 0.032, which is lower than the total intensity of the broad feature at 8793 (see Fig. 27), indicating that there is probably unknown blending. Multiple trial fitting to the profile shows that an emission feature with an observed wavelength of 8793.20 Å best fits the feature, and its intensity is 0.01. The emili444emili is developed by Dr. B. Sharpee et al. and is designed to aid in the identification of weak emission lines, particularly the weak recombination lines seen in high dispersion and high signal-to-noise (S/N) spectra. URL: code (Sharpee et al. sharpee03 2003) identified this probably blended weak line as a [Cr ii] line with a laboratory wavelength of 8795.17 Å. More efforts are needed to verify this identification.
The intensity ratio of the C ii 8793.80 line and the C ii M6 4267 multiplet is 0.036, and that yields an electron temperature of K (Section 2.2 and Fig. 11). As discussed in Section 2.2, this temperature is questionable, due to different excitation mechanisms of the C ii M28.01 8797 and the M6 4267 multiplets. Measurements of the C ii M28.01 lines are inaccurate unless detailed modeling of the autoionization levels of C ii is carried out. Besides, too many skylines in the near-red of the spectrum of NGC 7009 and the relatively poor sky subtraction in this wavelength region also makes accurate measurements of the C ii lines difficult (c.f. Section in Paper I).
3.1.3 Comments on the C ii recombination spectrum
The current effective recombination coefficients used for analysis of the C ii lines are mainly from Davey, Storey & Kisielius davey2000 (2000) and Bastin bastin2006 (2006). The former calculation takes much care in the low temperature case ( 5000 K), while the latter one mainly covers higher temperatures (5000 – 50 000 K) and includes the effects of high temperature dielectronic recombination, which rapidly becomes important above an electron temperature of 15 000 K. Both calculations were carried out in the LS coupling assumption and only for the transitions of the parentage 1S. In the current analysis, we adopt the calculation of Davey, Storey & Kisielius davey2000 (2000), assuming a temperature of 1000 K.
The best observed (i.e. the most accurate) multiplets of C ii in the spectrum of NGC 7009 are M6 (4f 2Fo – 3d 2D) and some transitions that belong to the g – 4f ( 5) array. For the transitions with parentage other than 1S, only the M28.01 (3d′ 2Fo – 3p′ 2D) multiplet is detected, but measurements of this multiplet could be unreliable, as mentioned in Section 3.1.2. The effective dielectronic recombination coefficients of Nussbaumer & Storey ns1984 (1984) and radiative recombination coefficients of Péquignot, Petitjean & Boisson ppb1991 (1991) were used for the analysis of the M28.01 multiplet. A full treatment of the C ii recombination in an appropriate coupling assumption (i.e. intermediate coupling), with transitions between the autoionization levels taken into account, is needed in the future.
3.2 The N ii optical recombination spectrum
In this section, we present intensities of the N ii ORLs detected in the spectrum of NGC 7009, and analyze these lines using the N ii effective recombination coefficients of FSL11. Unless otherwise specified, the theoretical relative intensities of the N ii lines quoted in this section are all based on that calculation. Comparison of the observed and predicted relative intensities of the N ii lines with accurate intensities is made to assess the new atomic data. An electron temperature of 1000 K is assumed throughout the analysis. In this section, spectral fits and discussion of results are only given for the M3 3p 3D – 3s 3Po, M28 3d 3Do – 3p 3P multiplets and the strongest multiplets M39a,b of the 4f – 3d transition array. Discussion of other multiplets of N ii are given in Appendix B.
3.2.1 Multiplet 3, 3p 3D – 3s 3Po
This multiplet is the strongest of N ii in optical. The intensities of the N ii M3 lines are presented in column 5 of Table 1 in unites of = 1.0. Also presented are the theoretical relative intensities in the LS coupling assumption (column 3) and the intermediate coupling (column 4). The theoretical predictions in intermediate coupling are calculated from the N ii effective recombination coefficients of FSL11. Comparisons of the observed and predicted relative intensities are in columns 6 and 7. Results of multi-Gaussian profile fitting to the wavelength range 5650 – 5760 Å are also presented in Fig. 28.
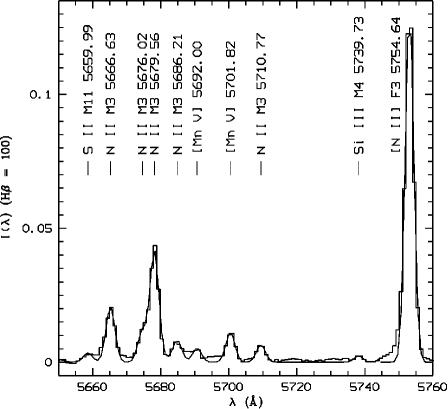
The strongest M3 line, 5679.56, is blended with 5676.02 of the same multiplet (Fig. 28). Two Gaussian profiles with the same width were used to fit them. The intensities of 5679.56 and 5676.02 are 0.1350.007 and 0.0350.004, respectively. Thus the 5676.02/5679.56 ratio is 0.273, which agrees with both theoretical ratios within errors (Table 1). Another two lines, 5666.63 and 5710.77, are free of line blending. The intensity of the 5710.77 line is 0.0200.003, which agrees better with the intermediate coupling (Table 1). The intensity of the 5666.63 line is 0.0650.007, which also agrees better with intermediate coupling (Table 1). Another M3 line 5686.21 is partially blended with a weaker feature, which was identified as Mn v 5692.00 (Fig. 28). The fitted intensity of 5686.21 is 0.0240.005, which seems to agree better with LS coupling (Table 1). However, the intensity of this line is questionable due to weakness. The other M3 line, 5730.65, is not observed in our spectrum.
| Line | ||||||
|---|---|---|---|---|---|---|
| 5666.63 | 2 – 1 | 0.536 | 0.466 | 0.481 | 0.897 | 1.032 |
| 5676.02 | 1 – 0 | 0.238 | 0.215 | 0.273 | 1.147 | 1.271 |
| 5679.56 | 3 – 2 | 1.000 | 1.000 | 1.000 | 1.000 | 1.000 |
| 5686.21 | 1 – 1 | 0.179 | 0.128 | 0.187 | 1.047 | 1.464 |
| 5710.77 | 2 – 2 | 0.179 | 0.167 | 0.151 | 0.844 | 0.902 |
3.2.2 Multiplet 28, 3d 3Do – 3p 3P
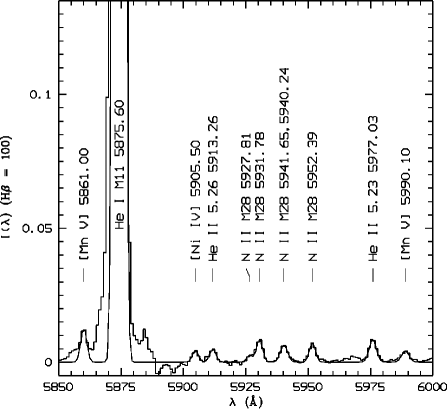
Gaussian profile fitting to M28 5941.65 (3d 3D – 3p 3P2) yields an intensity of 0.0300.004. The intensity contribution from the M28 5940.24 (3d 3D – 3p 3P1) line is negligible. The intensity ratio of 5941.65 and the N ii M3 5679.56 line is 0.228, which is 42 per cent lower than the theoretical ratio.
Another M28 line 5927.81 (3d 3D – 3p 3P0) is blended with M28 5931.78 (3d 3D – 3p 3P1), which coincides in wavelength with the He ii 25h 2Ho – 5g 2G 5931.83 line. Two Gaussian profiles were used to fit the complex, and the intensity of the 5927.81 line is 0.007, with a large uncertainty. The intensity ratio of 5927.81 to the 5941.65 line is 0.250, which agrees with the predicted ratio 0.235. Assuming that the He ii 5931.83 line contributes 55 per cent to the total intensity of the blend at 5932, as estimated from the hydrogenic theory of Storey & Hummer sh1995 (1995), we obtained an intensity of the 5931.78 line which is much higher than the theoretical prediction. Another M28 line 5952.39 (3d 3D – 3p 3P2) is blended with the He ii 24h 2Ho – 5g 2G 5952.93 line. The intensity of the 5952.39 line is much higher than the predicted value. The other M28 line 5960.90 (3d 3D – 3p 3P2) is not observed.
| Line | ||||||
|---|---|---|---|---|---|---|
| 5941.65a | 3 – 2 | 1.000 | 1.000 | 1.000 | 1.000 | 1.000 |
| 5952.39b | 2 – 2 | 0.152 | 0.122 | 0.255 | 1.686 | 2.103 |
| 5931.78c | 2 – 1 | 0.455 | 0.412 | 0.471 | 1.037 | 1.143 |
| 5960.90d | 1 – 2 | 0.010 | 0.009 | – | 0.000 | 0.000 |
| 5927.81 | 1 – 0 | 0.202 | 0.219 | 0.317 | 1.570 | 1.448 |
- a
-
Including the 5940.24 (3d 3D – 3p 3P1) line.
- b
-
Corrected for the contribution from the He ii 5952.93 (24h 2Ho – 5g 2G) line (74 per cent).
- c
-
Corrected for the contribution from the He ii 5931.83 (25h 2Ho – 5g 2G) line (57 per cent).
- d
-
Not detected.
3.2.3 4f – 3d transitions
The 4f – 3d transitions of N ii are located in the blue side of our spectrum (4500 Å) and suffer from line blending. Accurate measurements of most of them are difficult. Table 3 presents the observed and predicted relative intensities of those 4f – 3d lines with the most reliable intensities. Figs. 30 and 31 show some of the N ii lines of the 4f – 3d transition array detected in the spectrum of NGC 7009. The results of multi-Gaussian profile fitting are overplotted. Only the M39a and M39b multiplets are discussed here. Discussion of other 4f – 3d transitions of N ii are presented in Appendix B.8.
Multiplet 39a, 4f G[7/2] – 3d 3Fo:
The 4035.08 (4f G[7/2]3 – 3d 3F) and 4043.53 (4f G[7/2]4 – 3d 3F) lines are shown in Fig. 30. The 4035.08 line is blended with the O ii M50b 4f F[3] – 3d 4F5/2 4035.07 line, which contributes 15 per cent to the total intensity, and the O ii M50b 4f F[3] – 3d 4F5/2 4035.46 line, which is negligible. The 4035 line has an intensity 0.0370.006. Here the contribution from the O ii 4035.07 line has been corrected for. This intensity agrees with the predicted relative intensity. The 4043.53 line is partially blended with the N ii M39b 4f G[9/2]5 – 3d 3F 4041.31 line, which is more than 2 times stronger. The intensity of the 4043.53 line also agrees well with the predicted value. Reliable measurements of the 4044.78 (4f G[7/2]3 – 3d 3F) line are difficult. The other two lines 4056.90 (4f G[7/2]4 – 3d 3F) and 4058.16 (4f G[7/2]3 – 3d 3F) are too weak.
Multiplet 39b, 4f G[9/2] – 3d 3Fo:
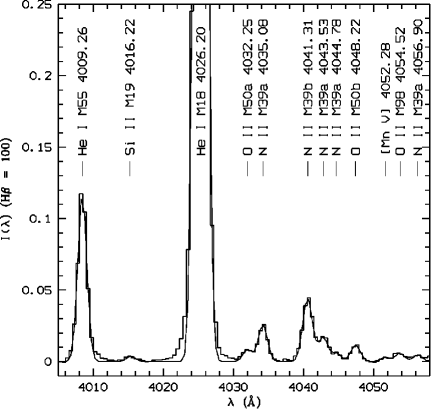
The 4041.31 (4f G[9/2]5 – 3d 3F) line is blended with the O ii M50c 4f F[2] – 3d 4F5/2 4041.28 and O ii M50c 4f F[2] – 3d 4F5/2 4041.95 lines. The two O ii lines contribute only 7 per cent to the total intensity of the blend at 4041. The intensity of the 4041.31 line is 0.0820.008. The intensity ratio of 4041.31 to the N ii M3 5679.56 line is 0.604, which agrees quite well with the predicted ratio 0.598. Another M39b line 4026.08 (4f G[9/2]4 – 3d 3F) is blended with the He i M18 5d 3D – 2p 3Po 4026.20 line. The other M39b line 4039.35 (4f G[9/2]4 – 3d 3F) is not observed.
| Line | ||||
|---|---|---|---|---|
| M39a 4f G[7/2] – 3d 3Fo | ||||
| 4035.08a | 3–2 | 0.477 | 0.540 | 1.132 |
| 4043.53 | 4–3 | 0.436 | 0.432 | 0.992 |
| M39b 4f G[9/2] – 3d 3Fo | ||||
| 4041.31b | 5–4 | 1.000 | 1.000 | 1.000 |
| M43a 4f F[5/2] – 3d 1Do | ||||
| 4176.16c | 3–2 | 0.293 | 0.343 | 1.171 |
| M43b 4f F[7/2] – 3d 1Do | ||||
| 4171.61 | 3–2 | 0.296 | 0.281 | 0.950 |
| M48a 4f F[5/2] – 3d 3Do | ||||
| 4236.91d | 2–1 | 0.539 | 0.669 | 1.241 |
| M48b 4f F[7/2] – 3d 3Do | ||||
| 4241.78e | 4–3 | 0.984 | 0.996 | 1.012 |
| M55a 4f D[5/2] – 3d 3Po | ||||
| 4442.02f | 2–1 | 0.130 | 0.242 | 1.859 |
| M58a 4f G[7/2] – 3d 1Fo | ||||
| 4552.53g | 4–3 | 0.201 | 0.395 | 1.965 |
| M58b 4f G[9/2] – 3d 1Fo | ||||
| 4530.41h | 4–3 | 0.474 | 0.593 | 1.251 |
| M61a 4f D[5/2] – 3d 1Po | ||||
| 4694.64i | 2–1 | 0.147 | 0.222 | 1.510 |
- a
-
Including the contribution from the O ii M50b 4f F[3] – 3d 4F5/2 4035.07 line. Neglecting the O ii M50b 4f F[3] – 3d 4F5/2 4035.46 line.
- b
-
Neglecting the contributions from the O ii M50c 4f F[2] – 3d 4F5/2 4041.28 and O ii M50c 4f F[2] – 3d 4F5/2 4041.95 lines.
- c
-
Including N ii M43a 4f F[5/2]2 – 3d 1D 4175.66.
- d
-
Including N ii M48b 4f F[7/2]3 – 3d 3D 4237.05.
- e
-
Including N ii M48a 4f F[5/2]3 – 3d 3D 4241.78. Neglecting N ii M48a 4f F[5/2]2 – 3d 3D 4241.24 and Ne ii M52c 4f 2[1] – 3d 4D1/2 4242.04.
- f
-
Including Ne ii M60b 4f 1[4] – 3d 2F5/2 4442.69. Neglecting O iii M49b 5g F[3] – 4f D[3]2 4442.02.
- g
-
Including Ne ii M55d 4f 2[2] – 3d 4F3/2 4553.17 and Si iii M2 4p 3P – 4s 3S1 4552.62.
- h
-
Including N iii M3 3p′ 4D1/2 – 3s′ 4P 4530.86.
- i
-
Overestimated.
3.2.4 Comments on the N ii recombination spectrum
The effective recombination coefficients used for the analysis of the N ii recombination spectrum are from FSL11, which is dedicated to low temperatures ( 10 000 K) and is an improvement over all previous calculations for this ion, as described Section 2.1. The best observed N ii lines in our spectrum are M3 (3p 3D – 3s 3Po), M12 (3p 1D – 3s 1Po), and the strongest lines of the 4f – 3d array, e.g. 4041.31 (M39b 4f G[9/2]5 – 3d 3F), 4043.53 (M39a 4f G[7/2]4 – 3d 3F). Those N ii lines have been used for plasma diagnostics (Section 2.3). The fine-structure components of the N ii multiplets M5 (3p 3P – 3s 3Po), M20 (3d 3Do – 3p 3D), M28 (3d 3Do– 3p 3P), and M29 (3d 3Po – 3p 3P) observed in our spectrum are incomplete due to line blending. Those that are detected are also blended with other lines. Although multi-Gaussian profile fitting has been carried out and effective recombination coefficients used to correct for the blended line of other ionic species, the derived intensities of those N ii lines could still be questionable. Grandi grandi1976 (1976) shows that the strongest components of the M3, M5 and M28 multiplets are affected by the fluorescence mechanism in the Orion nebula. However, such effects is probably insignificant in NGC 7009 (C. Morisset, private communication). The 4f – 3d transitions are almost certainly free of fluorescence enhancement because they require such high excitation energy photons that the central star of NGC 7009 cannot afford.
3.3 The O ii optical recombination spectrum
LSBC observed eight multiplets of the 3 – 3 transition arrays and a few dozen 4f – 3d lines of O ii. The effective radiative recombination coefficients for the O ii 3d – 3p and 4f – 3d transitions were calculated under the intermediate coupling scheme, and were used for spectral analysis. For the 3p,– 3s transitions, the effective recombination coefficients of Storey storey1994 (1994), whose calculations were carried out in the LS coupling scheme, were utilized. LSBC confirmed the breakdown of LS coupling in the O ii transitions, especially those of the 4f – 3d configuration. In Paper I, we presented very deep spectrum of NGC 7009. The data quality is higher than that in LSBC. In the current paper, we present the intensities of the O ii ORLs, and analyze the O ii recombination spectrum using the new O ii effective recombination coefficients of PJS. Unless otherwise specified, the theoretical relative intensities of the O ii lines quoted in this section are all based on that calculation. Comparison of the observed and predicted relative intensities of the O ii lines with accurate intensities is made to assess the new atomic data. An electron temperature of 1000 K is assumed throughout the analysis. In this section, spectral fits and discussion of the results are only given for the M1 3p 4Do – 3s 4P, M10 3d 4F – 3p 4Do multiplets and the strongest multiplets M39a,b of the 4f – 3d transition array. Discussion of other multiplets of O ii are given in Appendix C.
3.3.1 Multiplet 1, 3p 4Do – 3s 4P
The M1 multiplet is the strongest amongst all the O ii permitted transitions, and is one of the best observed multiplets. Comparisons of the observed and predicted relative intensities of the M1 fine-structure components are presented in Table 4. The results of multi-Gaussian profile fitting are shown in Fig. 32.
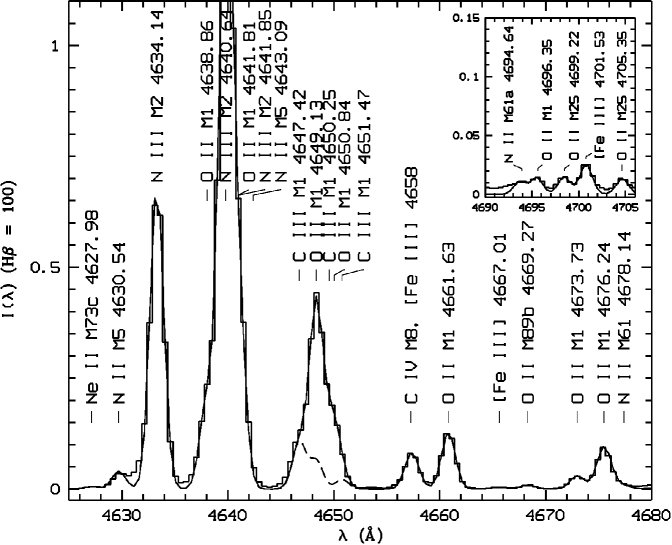
The strongest M1 line 4649.13 is blended with 4650.84 of the same multiplet; also blended are the three lines of C iii M1 3p 3Po – 3s 3S: 4647.42, 4650.25 and 4651.47. Five Gaussian profiles of the same FWHM were used to fit the complex, with the laboratory wavelength differences utilized. The relative intensities of the three C iii M1 lines were assumed to be as in LS coupling, i.e. 5 : 3 : 1, but the relative intensities of the two O ii lines were not constrained. The intensity of the 4649.13 line is 0.6670.030. The intensity of the 4650.84 line is 0.1690.008. The intensity ratio of the 4650.84 and 4649.13 lines agrees with the theoretical ratios predicted in the intermediate coupling, but is slightly higher than the LS coupling value (Table 4). Another three M1 lines, 4661.63, 4673.73 and 4676.24, are free of line blending. The fitted intensities of the three lines agree with the predicted values, except for 4673.73, whose measurement is obviously higher than both predicted values (Table 4). The measurement uncertainties of the three lines are all less than 10 per cent. Such large difference between the observed and predicted intensity of 4673.73 cannot be explained explicitly. 4673.73 coincides in wavelength with C iii M5 3p′ 3P1 – 3s′ 3P 4673.95. However, as discussed in LSBC, a significant contribution from the C iii 4673.95 line was unlikely because another C iii M5 line 4665.86, which is expected to be much stronger than 4673.95, is not observed. 4676.24 is blended with O ii M91 4f G[4] – 3d 2D5/2 4677.07 and N ii M61b 4f D[3/2]2 – 3d 1P 4678.14, but the contributions of these two lines are probably insignificant, as estimated from the new effective recombination coefficients.
Another two M1 lines, 4638.86 and 4641.81, are both blended with two N iii M2 lines 4640.64 and 4641.85, which are excited by the Bowen fluorescence mechanism. Also blended with this feature is N ii M5 3p 3P1 – 3s 3P 4643.09. Taking into account another N iii M2 line 4634.14 and N ii M5 3p 3P2 – 3s 3P 4630.54, we used six Gaussian profiles (the O ii 4641.81 line coincides in wavelength with N iii 4641.85, thus they were treated as a single component) to fit the complex, assuming that all the six components had the same FWHM. The results of the fitting are plotted in Fig. 32. Here the contribution of N iii M2 4641.85 to the total intensity of the blend at 4642 was estimated from N iii M2 4634.14, which is free of line blending. The intensity ratio of the two N iii lines was assumed to be as in pure LS coupling, i.e. 1 : 5, considering the fact that the two lines decay from the same upper level, thus their intensity ratio depends only on the coupling scheme instead of the excitation mechanism. The relative intensity of the two O ii M1 lines were not constrained. The intensity of 4641.81 thus obtained is 0.4370.085. This measurement agrees well with the predicted value in the intermediate coupling (Table 4). The resultant intensity of the 4638.86 line is higher than the theoretical ratios (Table 4), but its intensity could be unreliable due to the strength of the N iii M2 4640.64 line, which is more than 10 times stronger. The C ii M12.01 6d 2D – 4p 2Po lines, 4637.63, 4638.91 and 4639.07, may be also blended in the 4638 feature, but taking them into account makes the task of line deblending more difficult.
The other M1 line 4696.35, which is expected to be the faintest of O ii M1, is observed (the inset in Fig. 32). It coincides in wavelength with O ii M89a 4f D[3] – 3d 2D3/2 4696.35, and is partially blended with another weak feature which was identified as N ii M61a 4f D[5/2]2 – 3d 1P 4694.64. Accurate measurements of 4696.35 are difficult due to weakness. Assuming that the O ii M89a 4696.35 line contributes 38 per cent to total flux of the blend at 4696, as estimated from the new O ii effective recombination coefficients, we obtained an intensity of 0.015 for the M1 4696.35 line, which agrees well with the newly predicted value (Table 4).
| Line | ||||||
|---|---|---|---|---|---|---|
| 4638.86 | 3/2–1/2 | 0.208 | 0.283 | 0.502 | 2.414 | 1.774 |
| 4641.81 | 5/2–3/2 | 0.525 | 0.632 | 0.656 | 1.249 | 1.037 |
| 4649.13 | 7/2–5/2 | 1.000 | 1.000 | 1.000 | 1.000 | 1.000 |
| 4650.84 | 1/2–1/2 | 0.208 | 0.290 | 0.263 | 1.264 | 0.907 |
| 4661.63 | 3/2–3/2 | 0.267 | 0.317 | 0.326 | 1.222 | 1.028 |
| 4673.73 | 1/2–3/2 | 0.042 | 0.051 | 0.078 | 1.857 | 1.535 |
| 4676.24 | 5/2–5/2 | 0.225 | 0.220 | 0.237 | 1.054 | 1.078 |
| 4696.35 | 3/2–5/2 | 0.025 | 0.024 | 0.023 | 0.920 | 0.962 |
3.3.2 Multiplet 10, 3d 4F – 3p 4Do
The observed and predicted relative intensities of O ii M10 lines detected in NGC 7009 are presented in table 5. The emission features of the M10 lines and the results of Gaussian profile fitting are shown in Fig. 33 4069.62 and 4069.89, are blended with [S ii] 3p3 2P – 3p3 4S 4068.60 and the three C iii M16 5g 3G – 4f 3Fo lines: 4067.94, 4068.91 and 4070.26. The blend feature at 4070 is also partially resolved from another O ii M10 line 4072.16. Six Gaussian profiles of the same FWHM were used to fit the complex (4069.62 and 4069.89 were treated as a single component, given their close wavelengths), assuming that the differences of the observed wavelengths were the same as those of the laboratory ones. Assumption was also made that the relative intensities of the three C iii M16 lines were as in pure LS coupling, i.e. 1.00 : 1.31 : 1.71. The 4072.16 line blends with N ii M38b 4f F[7/2]3 – 3d 3F 4073.05 and O ii M48a 4f G[5] – 3d 4F7/2 4071.23. The intensity of the N ii 4073.05 line was assumed to be negligible, and the O ii 4071.23 line contributes about 9 per cent to the total intensity of the blend at 4072. Despite of the assumptions above, no further constraint was set for the relative intensities of the following four features in Gaussian profile fitting: The C iii M16 multiplet, [S ii] 4068.60, the two O ii M10 lines at 4070, and O ii 4072.15. The resultant total intensity of 4069.62, 89 is 0.6350.060. The intensity of the 4072.16 line derived from the fits is 0.5490.029. These intensities agree well with the theoretical values predicted in the intermediate coupling (Table 5).
The total intensity of the C iii M16 4069 multiplet yielded by Gaussian profile fitting is 0.2880.058. The intensity ratio of the C iii M16 multiplet to the C iii M1 4650 multiplet (the measurements of C iii M1 are described in Section 3.3.1) agrees with the predicted ratio within errors. Here the predicted C iii M16/M1 ratio is derived based on the radiative and dielectronic recombination coefficients given by Péquignot, Petitjean & Boisson ppb1991 (1991) and Nussbaumer & Storey ns1984 (1984), respectively. The C iii M1 4650 multiplet is mainly excited by dielectronic recombination, while the C iii M16 4069 multiplet is by radiative recombination (LSBC).
4075.86 is expected to be the strongest in O ii M10 (Table 5). It is blended with [S ii] 3p3 2P – 3p3 4S 4076.35. We used the same technique as LSBC to derive the intensities. The flux contribution of [S ii] 4076.35 to the blend at 4076 was estimated from the measured intensity of [S ii] 4068.60. A five-level atomic model was constructed to calculate the level population of S+, with an appropriate electron temperature and density assumed. The calculated [S ii] 4068.60/4076.35 intensity ratio was 3.04, the same as the ratio given by LSBC. The resultant intensity of the O ii 4075.86 line is 0.6880.070. The intensity ratio of the 4075.86 line and the O ii M1 4661.63 (the measurements of the M1 4661.63 line is given in Section 3.3.1) is 3.164, in close agreement with the predicted ratio 3.004 based on the latest O ii effective recombination coefficients. Here an electron temperature N ii M38a 4f F[5/2]2 – 3d 3F 4076.91 and N ii M38a 4f F[5/2]3 – 3d 3F 4077.40 also blend in the 4076 feature, but their flux contributions were assumed to be negligible.
4078.84 is much weaker, and is close to the blend feature at 4076 (Fig. 33). The intensity of the 4078.84 line derived from Gaussian profile fitting is 0.0890.009. The intensity ratio of 4078.84 to the 4075.86 line agrees well with the predicted ratio in the intermediate coupling (Table 5). The actual measurement uncertainty of this line could be even larger due to the weakness. Another M10 line 4085.11 blends with O ii M48b 4f G[4] – 3d 4F5/2 4083.90 and N ii M38b 4f G[7/2]3 – 3d 3F 4082.89. The O ii 4083.90 contributes about 47 per cent to the total intensity, and the N ii line is probably negligible. After the correction for the blend, the intensity of 4085.11 agrees well with the newly predicted value (Table 5). Measurements of the remaining M10 lines are difficult: 4092.93 (3d 4F7/2 – 3p 4D) is partially blended with N iii M1 3p 2P – 3s 2S1/2 4097.33, which is excited by the Bowen fluorescence mechanism; 4094.14 (3d 4F3/2 – 3p 4D) blends in the N iii 4097.33 line, and 4106.02 (3d 4F5/2 – 3p 4D) is embedded in the wing of H i 4101.
| Line | ||||||
|---|---|---|---|---|---|---|
| 4069.89a | 5/2–3/2 | 0.730 | 0.956 | 0.923 | 1.264 | 0.965 |
| 4072.16b | 7/2–5/2 | 0.686 | 0.807 | 0.798 | 1.163 | 0.989 |
| 4075.86 | 9/2–7/2 | 1.000 | 1.000 | 1.000 | 1.000 | 1.000 |
| 4078.84 | 3/2–3/2 | 0.112 | 0.141 | 0.130 | 1.161 | 0.922 |
| 4085.11c | 5/2–5/2 | 0.146 | 0.162 | 0.165 | 1.129 | 1.018 |
- a
-
Including the contribution from the O ii M10 3d 4F3/2 – 3p 4D 4069.62 line.
- b
-
Corrected for the contribution from the O ii M48a 4f G[5] – 3d 4F7/2 4071.23 line, which is about 9 per cent. Neglecting the N ii M38b 4f G[7/2]3 – 3d 3F 4073.05 line (about 2 per cent).
- c
-
Neglecting N ii M38b 4f G[7/2]3 – 3d 3F 4082.89 (less than 2 per cent).
3.3.3 4f – 3d transitions
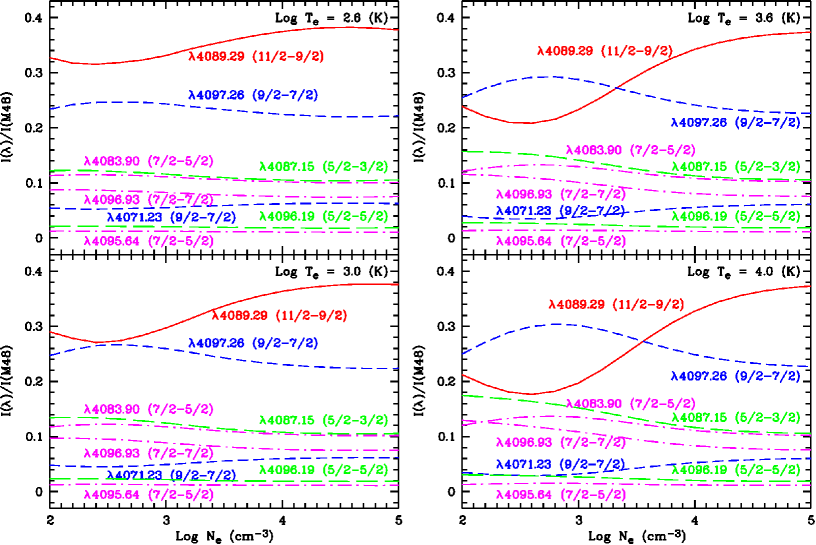
Several dozen transitions of this group were identified and presented in the emission line list of NGC 7009 (Paper I). Table 6 gives the observed and predicted relative intensities of the 4f – 3d lines of O ii with the most reliable measurements. For most cases, the measured intensities agree with both calculations. Here we only present spectral fits and discussion of the M48a 4f G[5]o – 3d 4F multiplet of O ii. Discussion of other multiplets of the O ii 4f – 3d configuration are given in Appendix C.11. Figs. 34 and 35 show some of the detected O ii ORLs from the 4f – 3d configuration. The strongest 4f – 3d line of O ii observed in NGC 7009, 4089.29 (M48a 4f G[5] – 3d 4F9/2), is shown in Fig. 33. A few O ii lines of the 4f – 3d configuration, which are blended with the N ii lines of the same configuration, are shown in Fig. 30.
The 4089.29 (M48a 4f G[5] – 3d 4F9/2) line is blended with the 4088.27 (M48a 4f G[5] – 3d 4F9/2) and the Si iv M1 4p 2P – 4s 2S1/2 4088.86 lines (Fig. 30). The 4088.27 line contributes less than 2 per cent to the total flux of the blend at 4089. The contribution of the Si iv 4088.86 line was estimated from the observed Si iv M1 4p 2P – 4s 2S1/2 4116.10, assuming that the relative intensities of the two S iv M1 lines are as in the pure LS coupling, i.e. 2 : 1. The resultant intensity of the 4089.29 line is 0.2650.013. The intensity ratio of 4089.29 and the O ii M1 4649.13 line is 0.398, which agrees with the new theoretical prediction (0.387) within measurement errors. The other M48a line 4071.23 (4f G[5] – 3d 4F7/2) is blended with the O ii M10 3d 4F7/2 – 3p 4D 4072.16 line (see Section 3.3.2), which is 10 times stronger.
| Line | ||||||
|---|---|---|---|---|---|---|
| LSBC | PJS | LSBC | PJS | |||
| M48a 4f G[5]o – 3d 4F | ||||||
| 4089.29 | 11/2–9/2 | 1.000 | 1.000 | 1.000 | 1.000 | 1.000 |
| M48b 4f G[4]o – 3d 4F | ||||||
| 4083.90 | 7/2–5/2 | 0.285 | 0.316 | 0.326 | 1.141 | 1.032 |
| M48c 4f G[3]o – 3d 4F | ||||||
| 4087.15 | 5/2–3/2 | 0.271 | 0.347 | 0.347 | 1.280 | 1.000 |
| M50a 4f F[4]o – 3d 4F | ||||||
| 4062.94 | 9/2–9/2 | 0.125 | 0.126 | 0.137 | 1.096 | 1.087 |
| M50b 4f F[3]o – 3d 4F | ||||||
| 4048.21 | 7/2–7/2 | 0.063 | 0.068 | 0.076 | 1.206 | 1.120 |
| M53a 4f D[3]o – 3d 4P | ||||||
| 4303.83a | 7/2–5/2 | 0.413 | 0.522 | 0.534 | 1.293 | 1.022 |
| M53b 4f D[2]o – 3d 4P | ||||||
| 4294.78b | 5/2–3/2 | 0.232 | 0.326 | 0.253 | 1.091 | 0.776 |
| 4307.23 | 3/2–1/2 | 0.105 | 0.118 | 0.108 | 1.031 | 0.919 |
| M53c 4f D[1]o – 3d 4P | ||||||
| 4288.82c | 3/2–1/2 | 0.151 | 0.123 | 0.145 | 0.958 | 1.176 |
| M55 4f G[3]o – 3d 4P | ||||||
| 4291.25d | 7/2–5/2 | 0.156 | 0.188 | 0.221 | 1.414 | 1.176 |
| M63a 4f D[3]o – 3d 4D | ||||||
| 4357.25e | 7/2–5/2 | 0.057 | 0.088 | 0.094 | 1.651 | 1.067 |
| M67c 4f F[2]o – 3d 4D | ||||||
| 4282.96f | 5/2–3/2 | 0.154 | 0.168 | 0.185 | 1.200 | 1.101 |
| M76b 4f G[4]o – 3d 2F | ||||||
| 4371.62g | 9/2–7/2 | 0.097 | 0.109 | 0.127 | 1.303 | 1.159 |
| M78a 4f F[4]o – 3d 2F | ||||||
| 4313.44h | 9/2–7/2 | 0.121 | 0.133 | 0.139 | 1.150 | 1.045 |
| M78b 4f F[3]o – 3d 2F | ||||||
| 4285.69 | 7/2–5/2 | 0.189 | 0.264 | 0.229 | 1.208 | 0.869 |
| M86a 4f D[3]o – 3d 2P | ||||||
| 4491.23 | 5/2–3/2 | 0.137 | 0.198 | 0.215 | 1.569 | 1.086 |
| M86b 4f D[2]o – 3d 2P | ||||||
| 4489.49 | 3/2–1/2 | 0.065 | 0.082 | 0.083 | 1.271 | 1.004 |
| M88 4f G[3]o – 3d 2P | ||||||
| 4477.90i | 5/2–3/2 | 0.086 | 0.109 | 0.113 | 1.316 | 1.108 |
| M92a 4f F[4]o – 3d 2D | ||||||
| 4609.44 | 7/2–5/2 | 0.428 | 0.444 | 0.483 | 1.126 | 1.088 |
| M92b 4f F[3]o – 3d 2D | ||||||
| 4602.13j | 5/2–3/2 | 0.171 | 0.194 | 0.195 | 1.139 | 1.003 |
- a
-
Corrected for the contribution from O ii M65a 4f G[5] – 3d 4D7/2 4303.61 (about 12 per cent). Neglecting O ii M53a 4f D[3] – 3d 4P5/2 4304.08 (3 per cent).
- b
-
Including O ii M53b 4f D[2] – 3d 4P3/2 4294.92 (12 per cent).
- c
-
Including O ii M53c 4f D[1] – 3d 4P1/2 4288.82.
- d
-
Including O ii M78c 4f F[2] – 3d 2F5/2 4292.21. Neglecting O ii M55 4f G[3] – 3d 4P5/2 4291.86 and O ii M78c 4f F[2] – 3d 2F5/2 4292.95.
- e
-
Including O ii M63a 4f D[3] – 3d 4D3/2 4357.25. Neglecting O ii M63a 4f D[3] – 3d 4D5/2 4357.52.
- f
-
Including O ii M67c 4f F[2] – 3d 4D5/2 4283.25. Neglecting O ii M78a 4f F[4] – 3d 2F5/2 4282.02.
- g
-
Neglecting O ii M76b 4f G[4] – 3d 2F7/2 4371.24 (less than 2 per cent).
- h
-
Corrected for the contribution from the O ii M78a 4f F[4] – 3d 2F7/2 4312.11 line (33 per cent).
- i
-
Neglecting O iii M45a 5g H[11/2] – 4f G[9/2]5 4477.91 (less than 2 per cent).
- j
-
Corrected for the contribution from N ii M5 3p 3P2 – 3s 3P 4601.48 (26 per cent). Neglecting Ne ii M64d 4f 2[2] – 3d 4P5/2 4600.16.
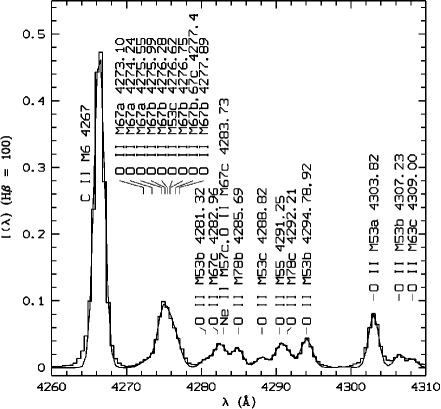
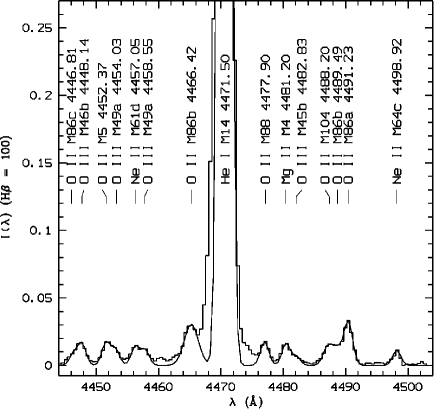
3.3.4 Multiplets with parentage other than 3P
The O ii ORLs from multiplets with parentage other than 3P are detected in NGC 7009, and they include M15, M36, M101 and M105, which were also observed by LSBC. However, the effective recombination coefficients are only available for two of those multiplets (c.f. discussion in Section 2.3). Table 7 presents the line intensities. The intensities observed by LSBC are also listed. The O ii M15 3p′ 2Fo – 3s′ 2D lines 4590.97 and 4596.18 are shown in Fig. 42. The O ii M36 3d′ 2G – 3p′ Fo lines 4185.45 and 4189.79 are shown in Fig. 31.
| Line | Mult. | Transition | Current | LSBC | |
|---|---|---|---|---|---|
| (Å) | PA=0o | PA=45o | |||
| 4590.97 | M15 | (1D)3p 2F – (1D)3s 2D5/2 | 0.087 | 0.0907 | 0.0752 |
| 4596.18a | M15 | (1D)3p 2F – (1D)3s 2D3/2 | 0.062 | 0.0424 | 0.0476 |
| 4185.45 | M36 | (1D)3d 2G7/2 – (1D)3p 2F | 0.070 | 0.0572 | 0.0580 |
| 4189.79b | M36 | (1D)3d 2G9/2 – (1D)3p 2F | 0.083 | 0.0703 | 0.0747 |
| 4253.89c | M101 | (1D)4f H[5] – (1D)3d 1G9/2 | 0.058 | 0.0318: | 0.0249: |
| 4843.37d | M105 | (1D)4f P[1] – (1D)3d 2S1/2 | 0.021 | ||
- a
-
Including O ii M15 (1D)3p 2F – (1D)3s 2D5/2 4595.96.
- b
-
Including O ii M36 (1D)3d 2G7/2 – (1D)3p 2F 4189.59.
- c
-
Including O ii M101 (1D)4f H[5] – (1D)3d 1G9/2 4253.91 and O ii M101 (1D)4f H[5] – (1D)3d 1G7/2 4254.12.
- d
-
Including O ii 4843.37 M105 (1D)4f P[1] – (1D)3d 2S1/2.
3.3.5 Comments on the O ii recombination spectrum
The unpublished effective recombination coefficients of P. J. Storey used in the current analysis of the O ii recombination spectrum are accurate at low temperatures ( 10 000 K). Appropriate assumptions have been made in the calculation, as described in Section 2.1. The O ii recombination spectrum is the richest amongst all the heavy element ions observed in NGC 7009. The best observed multiplets of the 3 – 3 transitions of O ii are M1 (3p 4Do – 3s 4P), M2 (3p 4Po – 3s 4P), M10 (3d 4F – 3p 4Do), M19 (3d 4P – 3p 4Po), M25 (3d 2F – 3p 2Do) and M28 (3d 4P – 3p 4So). Although some fine-structure components of those multiplets are blended with other lines, multi-Gaussian profile fitting gives reliable intensities for most of them. The 4f – 3d lines with the most reliable measurements are presented in Table 6. The O ii multiplets are not affected by any other excitation mechanisms (e.g. fluorescence, charge transfer), and the strongest lines have been used for plasma diagnostics (Section 2.3). Several O ii lines with the parentage 1D are detected, as presented in Table 7. Only the dielectronic recombination coefficients for the M15 and M36 multiplets are available from Nussbaumer & Storey ns1984 (1984). The calculation of PJS does not reach such high energy.
3.4 The Ne ii optical recombination spectrum
Several dozen emission features in the spectrum of NGC 7009 were identified as the Ne ii permitted lines. In this section, we present spectral fits and discussion of the results only for the M2 3p 4Do – 3s 4P, M13 3d 4F – 3p 4Do, M9 3p′ 2Fo – 3s′ 2D, and the M55e 4f 2[5]o – 3d 4F multiplets. Discussion of other multiplets of Ne ii are given in Appendix D. Line intensities measured by LLB01 are used for comparison if available. Predicted intensities that are based on the LS coupling calculations of Kisielius et al. kisielius1998 (1998) are also used for the analysis.
3.4.1 Multiplet 2, 3p 4Do – 3s 4P
This is the strongest multiplet of Ne ii. Fig. 52 shows that 3334.84 (3p 4D – 3s 4P5/2) is affected by the O iii fluorescence line M3 3p 3S1 – 3s 3P 3340.76, which is more than 10 times stronger. The fitted intensity of 3334.84 is 0.428, which is higher than LLB01 (0.345). Given that our observational data are the same as LLB01, such difference is probably due to the different reddening laws used. Besides, measurements of 3334.84 could be overestimated due to the O iii line.
Another line 3355.02 (3p 4D – 3s 4P3/2) blends with He i M8 7p 1P – 2s 1S0 3354.55 (Fig. 50), which contributes 43 per cent to the total intensity, as estimated from the calculations of Benjamin, Skillman & Smits bss99 (1999). The resultant intensity of 3355.02 is 0.2230.045. The intensity ratio 3355.02/3334.84 agrees well with the predicted value. The intensity of another line 3360.60 (3p 4D – 3s 4P1/2) is 0.040, which is unreliable (Fig. 50). The other M2 lines are not observed.
3.4.2 Multiplet 13, 3d 4F – 3p 4Do
Ne ii M13 lines locate in the far-blue and they are difficult to observe due to weakness as well as the relatively poor S/N. Only 3218.19 (3d 4F9/2 – 3p 4D) and 3244.09 (3d 4F9/2 – 3p 4D) are observed, and they are shown in Fig. 36. The fitted intensity of 3218.19 is 0.234, which agrees well with LLB01 (0.229). Here the blended Ne ii M16 3d 4P1/2 – 3p 4D 3217.30 was assumed to be negligible (3 per cent). The intensity ratio of 3218.19 to the Ne ii M2 3334.84 line is 0.546, which agrees with the predicted ratio 0.594. The intensity of the 3244.09 line is 0.074, higher than the measurement of LLB01 (0.0576).
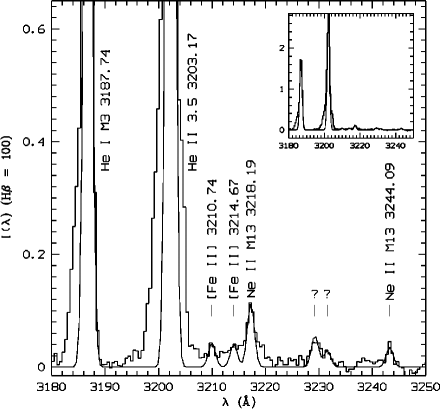
3.4.3 Multiplet 9, 3p′ 2Fo – 3s′ 2D
This is the only Ne ii multiplet of an excited-state parentage (2s22p4 1D) detected in the spectrum of NGC 7009, and shown in Fig. 37. The fitted intensity of 3568.50 (3p′ 2F – 3s′ 2D5/2) is 0.1680.016. The measured total intensity of the other two lines 3574.18, 61 is 0.053, with an uncertainty of about 10 per cent. Thus the intensity ratio (3574.18 + 3574.61)/3568.50 is 0.32, which differs from the LS coupling value 0.75. No measurements of this multiplet are given in LLB01.
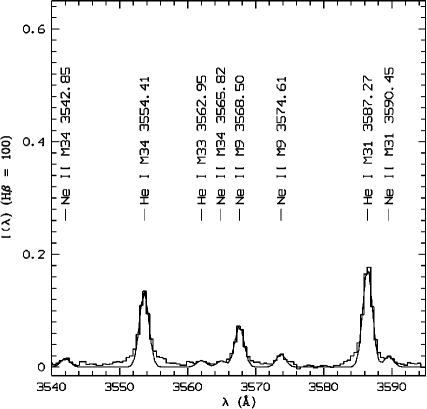
3.4.4 4f – 3d transitions
Several dozen Ne ii ORLs of the 4f – 3d configuration are detected or estimated by deblending techniques (i.e. Gaussian profile fitting). The measured intensities are 10-4 of H or even lower. Table 8 presents the measured and predicted relative intensities of the 4f – 3d transitions with the most reliable measurements. The predicted intensities are based on the preliminary effective recombination coefficients calculated by P. J. Storey (private communication) for a few selected Ne ii 4f – 3d quartet lines. In this section, we only present spectral fits and results for the M55e 4f 2[5]o – 3d 4F multiplet of Ne ii. Discussion of other multiplets of the 4f – 3d configuration are given in Appendix D.13. Some of the Ne ii lines belonging to the M52a 4f 2[4]o – 3d 4D and M52b 4f 2[3]o – 3d 4D multiplets are shown in Fig 31. Fig 44 also shows many Ne ii lines detected in the spectrum of NGC 7009.
The 4391.99 (M55e 4f 2[5] – 3d 4F9/2) line observed in NGC 7009 is shown in Fig. 44. Its intensity is 0.0770.008, which agrees with LLB01: 0.0728 (ESO 1.52 m), 0.0779 (WHT 1996) and 0.0713 (WHT 1997). The contribution from the 4392.00 (4f 2[5] – 3d 4F9/2) line of the same multiplet is negligible. The other M55e line 4409.30 (4f 2[5] – 3d 4F7/2) is blended with the Ne ii 4409.78 (M55b 4f 2[3] – 3d 4F9/2) line, whose intensity is negligible, and the O iii 4408.29 (M46a 5g H[5] – 4f G[4]3) line, which contributes about 10 per cent to the total intensity, as estimated from the effective recombination coefficients of Kisielius & Storey ks1999 (1999). The resultant intensity of the 4409.30 line is 0.060, which agrees with LLB01: 0.0631 (ESO 1.52 m), 0.0615 (WHT 1996) and 0.0624 (WHT 1997). The intensity ratio 4409.30/4391.99 observed in NGC 7009 is 20 per cent higher than the predicted value (Table 8).
| Line | ||||
|---|---|---|---|---|
| M55e 4f 2[5]o – 3d 4F | ||||
| 4391.99a | 11/2–9/2 | 1.000 | 1.000 | 1.000 |
| 4409.30b | 9/2–7/2 | 0.665 | 0.812 | 1.221 |
| M52a 4f 2[4]o – 3d 4D | ||||
| 4219.75c | 9/2–7/2 | 0.555 | 0.831 | 1.497 |
| 4233.85 | 7/2–5/2 | 0.139 | 0.227 | 1.631 |
| M52b 4f 2[3]o – 3d 4D | ||||
| 4231.64d | 7/2–5/2 | 0.131 | 0.370 | 2.811 |
| 4250.65 | 5/2–3/2 | 0.088 | 0.216 | 2.461 |
| M57b 4f 1[4]o – 3d 4F | ||||
| 4397.99 | 7/2–5/2 | 0.346 | 0.325 | 0.941 |
| M60c 4f 1[3]o – 3d 2F | ||||
| 4428.64e | 7/2–5/2 | 0.437 | 0.591 | 1.353 |
| M61a 4f 2[4]o – 3d 2D | ||||
| 4430.94f | 7/2–5/2 | 0.283 | 0.452 | 1.598 |
| M61d 4f 2[2]o – 3d 2D | ||||
| 4457.05g | 5/2–3/2 | 0.098 | 0.361 | 3.662 |
| M65 4f 0[3]o – 3d 4P | ||||
| 4413.22h | 7/2–5/2 | 0.239 | 0.376 | 1.574 |
| M66c 4f 1[3]o – 3d 4P | ||||
| 4421.39 | 5/2–3/2 | 0.089 | 0.113 | 1.263 |
- a
-
Neglecting Ne ii M55e 4f 2[5] – 3d 4F9/2 4392.00.
- b
-
Corrected for the contribution from the O iii M46a 5g H[5] – 4f G[4]3 4408.29 line (10 per cent). Neglecting Ne ii M55b 4f 2[3] – 3d 4F9/2 4409.78.
- c
-
Including Ne ii M52d 4f 2[2] – 3d 4D5/2 4220.89. Neglecting Ne ii M52a 4f 2[4] – 3d 4D7/2 4219.37.
- d
-
Including Ne ii M52b 4f 2[3] – 3d 4D5/2 4231.53.
- e
-
Including Ne ii M61b 4f 2[3] – 3d 2D5/2 4428.52. Neglecting Ne ii M60c 4f 1[3] – 3d 2F5/2 4428.52 and Ne ii M61b 4f 2[3] – 3d 2D5/2 4428.41.
- f
-
Including Ne ii M57a 4f 1[2] – 3d 4F3/2 4430.90 and Ne ii M55a 4f 2[4] – 3d 4F7/2 4430.06. Neglecting Ne ii M57a 4f 1[2] – 3d 4F3/2 4431.11.
- g
-
Neglecting Ne ii M61d 4f 2[2] – 3d 2D3/2 4457.24 and Ne ii M66c 4f 1[3] – 3d 4P5/2 4457.24. Including Ne ii M66c 4f 1[3] – 3d 4P5/2 4457.36.
- h
-
Neglecting Ne ii M65 4f 0[3] – 3d 4P5/2 4413.11. Including Ne ii M57c 4f 1[3] – 3d 4F3/2 4413.11.
3.4.5 Comments on the Ne ii recombination spectrum
The Ne ii effective recombination coefficients currently used are mainly from Kisielius et al. kisielius1998 (1998). This calculation is carried out for the transitions of 2. Although some effective recombination coefficients for the Ne ii 4f – 3d transitions are available (P. J. Storey, unpublished), only a few selected Ne ii lines are calculated, and the results are quite preliminary. The best observed Ne ii multiplets of the 3 – 3 transitions is M2 (3p 4Do – 3s 4P). For the Ne ii multiplets, M12 (3d 4D – 3p 4Do), M13 (3d 4F – 3p 4Do), M20 (3d 2F – 3p 2Do), M21 (3d 2D – 3p 2Do), M28 (3d 2P – 3p 2So) and M34 (3d 4P – 3p 4So), only the strongest fine-structure components are observed, and the weaker components are either blended with other lines or not detected. Measurements of the M1 (3p 4Po – 3s 4P), M5 (3p 2Do – 3s 2P) and M6 (3p 2So – 3s 2P) lines are of large uncertainties due to line blending. The M9 (3p′ 2Fo – 3s′ 2D) multiplet is the only Ne ii transition observed in out spectrum of parentage other than 3P. The effective recombination coefficients for this multiplet are available from Kisielius et al. kisielius1998 (1998), which are probably unreliable considering that the calculation is in the LS coupling assumption. The possibility of using the Ne ii lines to determine electron temperatures is discussed in Section 2.4. In NGC 7009, the effects of the fluorescence mechanism on the Ne ii M1 and M2 multiplets are probably not important. Thus those lines could be safe for plasma diagnostics and abundance determinations.
3.5 The C iii permitted lines
More than 20 lines in NGC 7009 were identified as C iii permitted transitions (Paper I); some identifications could be questionable. In this section, we only introduce three multiplets: M1 3p 3Po – 3s 3S, M16 5g 3G – 4f 3Fo and M18 5g 1G – 4f 1Fo. The three C iii M1 lines, 4647.42, 4650.25 and 4651.47, are blended with the O ii M1 (3p 4Do – 3s 4P) lines 4649.13 and 4650.84, as shown in Fig. 32. Techniques used to obtain the total intensity of the C iii M1 multiplet are illustrated in Section 3.3.1. The intensity ratio of the three lines was assumed to be as in the LS coupling, i.e. 1 : 3 : 5. The total intensity is 0.303, which is accurate to 20 per cent. This intensity agrees with the measurements of LSBC: 0.274 (PA = 45o) and 0.438 (PA = 0o).
The C iii M16 lines 4067.94, 4068.91 and 4070.26 are blended with the [S ii] 4068 (3p3 2P – 4S) and two O ii M10 (3d 4F – 3p 4Do) lines 4069.62 and 4069.89, as shown in Fig. 33. Details of deriving the total intensity of the C iii M16 multiplet are given in Section 3.3.2. The intensity ratio of the three C iii M16 lines was also assumed to be as in the LS coupling, i.e. 1.00 : 1.31 : 1.71. The total intensity is 0.288, with a large uncertainty (40 per cent). The intensity ratio of the C iii M16 4069 and the C iii M1 4650 multiplets is 0.952. The predicted ratio of the two C iii multiplets is 0.922, which is calculated from the radiative and dielectronic recombination coefficients of Péquignot, Petitjean & Boisson ppb1991 (1991) and Nussbaumer & Storey ns1984 (1984), respectively.
The C iii M18 4186.90 (5g 1G4 – 4f 1F) line is blended with the O ii M36 4185.44 (3d′ 2G7/2 – 3p′ 2F) line, as shown in Fig. 31. Multi-Gaussian fits yield an intensity of 0.0890.018 for the 4186.90 line. This intensity agrees with those given by LSBC: 0.0533 (PA = 45o) and 0.102 (PA = 0o). The intensity ratio of the C iii M18 4187 and the C iii M1 4650 multiplets is 0.293, which agrees with the predicted ratio (0.331) within errors.
3.6 The N iii permitted lines
More than 30 lines were identified as the N iii permitted transitions, including multiplets M1 and M2, which are mainly excited by the Bowen fluorescence mechanism. Transitions from the states with excited parentage (i.e. other than 1S) are detected. Most N iii lines suffer from line blending. In this section, we only present intensity measurements and discussion for the M3 3p′ 4D – 3s′ 4Po and M18 5g 2G – 4f 2Fo multiplets. Discussion of other multiplets of N iii is given in Appendix E.
3.6.1 Multiplet 3, 3p′ 4D – 3s′ 4Po
4510.91 (3p′ 4D5/2 – 3s′ 4P and 3p′ 4D3/2 – 3s′ 4P) blends with [K iv] 3p4 1S0 – 3p4 1D2 4510.92, whose intensity contribution is unknown. Another M3 line 4514.86 (3p′ 4D7/2 – 3s′ 4P) is partially resolved from Ne ii M58a 4f 2[4] – 3d 2F7/2 4517.83 (Fig. 38). Several Ne ii ORLs, M58b 4514.88, M64d 4516.66 and M58a 4517.83, are also blended in the complex, which makes line measurements very difficult. Another line 4518.15 (3p′ 4D1/2 – 3s′ 4P) blends with the Ne ii M58a 4517.83 line, which probably dominates the total intensity.
Another two lines 4523.58 (3p′ 4D3/2 – 3s′ 4P) and 4547.30 (3p′ 4D3/2 – 3s′ 4P) decay from the same upper level, thus their intensity ratio depends only on the coupling scheme. The measured line ratio 4547.30/4523.58 is 0.119, which is slightly higher than the LS coupling value 0.094. Measurements of the 4547.30 line could be of large error due to weakness (Fig. 38). Another M3 line 4534.58 (3p′ 4D5/2 – 3s′ 4P) blends with O iii M48 5g G[4] – 4f D[3]3 4534.31 and Ne ii M55b 4f 2[3] – 3d 4F5/2 4534.64 as well as another three Ne ii lines M55b 4534.52, M55c 4535.37, and M55c 4535.57, whose intensity contribution could be negligible. The other line 4530.86 (3p′ 4D1/2 – 3s′ 4P) blends with N ii M58b 4f 2[5]4 – 3d 1F 4530.41, which is probably more than 3 times stronger.
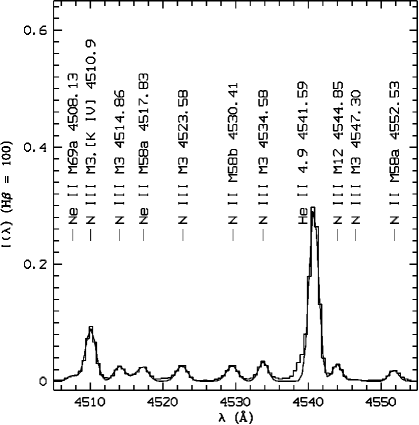
3.6.2 Multiplet 18, 5g 2G – 4f 2Fo
4379.11 (5g 2G9/2 – 4f 2F and 5g 2G7/2 – 4f 2F) is detected in Fig. 43. Gaussian profile fitting gives an intensity of 0.367, with an uncertainty of less than 10 per cent. Measurements for this line given by LSBC are 0.312 (PA = 45o) and 0.397 (PA = 0o). 4379.11 blends with Ne ii M60b 4f 1[4] – 3d 2F7/2 4379.55, which contributes about 10 per cent to the total intensity, and Ne ii M60b 4f 1[4] – 3d 2F7/2 4379.40 and O iii M39c 5g G[5] – 4f F[4]4 4379.58, both of which were assumed to be negligible. This line is used to derive N3+/H+ abundance ratio.
3.7 The O iii permitted lines
In Paper I, about two dozen O iii permitted transitions from the 3 – 3 configuration were identified, including multiplets M2 3p 3D – 3s 3Po, M3 3p 3S – 3s 3Po, M4 3p 3P – 3s 3Po, M12 3d 3Po – 3p 3S and M15 3d 3Po – 3p 3P, which are mainly excited by the Bowen fluorescence or charge-transfer (Liu & Danziger 1993a ). All the O iii 5g – 4f lines are blended with other emission features. In this section, we only present emission line measurements of the M8 3d 3Fo – 3p 3D and M15 3d 3Po – 3p 3P multiplets. Measurement results of other O iii multiplets are given in Appendix F. Discussion of the O iii fluorescence lines is in Section 3.7.4.
3.7.1 Multiplet 8, 3d 3Fo – 3p 3D
Only 3260.85 (3d 3F – 3p 3D2) and 3265.32 (3d 3F – 3p 3D3) are observed (Fig. 39). Measurements of the two lines could be of relatively large error due to poor S/N in the far blue of the spectrum. However, this multiplet cannot be excited by either the Bowen fluorescence or charge transfer, and the two lines are still used to determine the O3+/H+ abundance ratio.
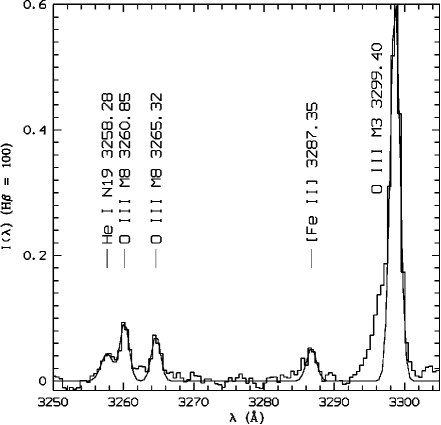
3.7.2 Multiplet 15, 3d 3Po – 3p 3P
Fig. 40 shows the O iii M15 lines detected in the spectrum of NGC 7009. Single-Gaussian profile fitting yields an intensity of 11.575 for the 3444.06 line, with an uncertainty of about 3 per cent. The intensity contribution from the blended He i M7 3447.59 (6p 1P – 2s 1S0) line is only 2 per cent. Another M15 line 3428.62 is blended with the 3430.57 line of the same multiplet, which is marginally resolved in Fig. 40. Two Gaussian profiles with the same FWHM were used to fit the feature, and the resultant intensities of the 3428.62 and the 3430.57 lines are 1.409 and 0.319, respectively, both with uncertainties of less than 10 per cent.
Another M15 line 3415.26 is partially resolved from the Ne ii M21 3416.91 (3d 2D5/2 – 3p 2D) line; the other two M15 lines, 3405.71 and 3408.12 are also detected in the spectrum. The three O iv M2 3d 2D – 3p 2Po lines, 3403.52, 3411.69 and 3413.64, are blended among the above three O iii M15 lines, as is shown in Fig. 40. Multi-Gaussian profile fitting was carried out for the complex. The intensity of the 3415.26 line is 0.4150.021. The intensities of the 3405.71 and 3408.12 lines are 0.210 and 0.127, respectively, both with uncertainties of 10 to 15 per cent. Analysis of the measured intensities of the O iv M2 lines are in Section 3.8.
The observed intensity ratio 3428.62/3444.06 is 0.122, lower than the theoretical prediction (0.336) given by Saraph & Seaton ss1980 (1980), who assumed that the relative intensities within the O iii M15 multiplet to be as in LS coupling, but agrees with the intermediate calculations of Kastner et al. kastner1983 (1983). The observed intensity ratio of the three O iii M15 lines 3405.71, 3415.26 and 3430.57, which have the common upper level, is 1 : 2.102 : 1.615. This ratio differs from that in the pure LS coupling, i.e. 1 : 0.75 : 1.25. Discussion of the intensity ratios of the O iii M15 lines is presented in Section 3.7.4.
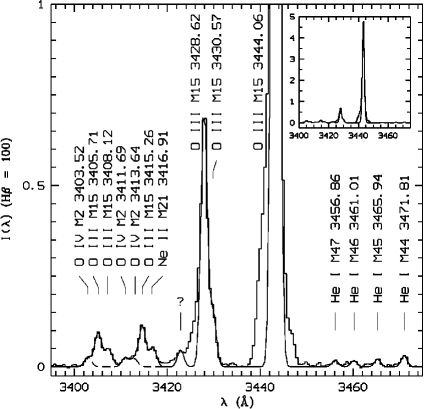
3.7.3 5g – 4f transitions
The O iii permitted transitions of 5g – 4f configuration are in the wavelength range 4300–4600 Å, where numerous ORLs of the singly-ionized ions of C, N, O and Ne are located. The typical intensities of the 5g – 4f lines of O iii are 10-4–105 of H, and accurate measurements of these lines are difficult due to line blending. The strongest O iii line of the 5g – 4f configuration, 4434.60 (M46b 5g H[6] – 4f G[5]5), is marginally detected in the spectrum of NGC 7009, as is shown in Fig. 44. Multi-Gaussian profile fitting yields an intensity of 0.0240.003, from which we derived an O3+/H+ abundance ratio that is higher than that deduced from the O iii M8 3265 (3d 3Fo – 3p 3D) multiplet by a factor of 20. Given the relatively more accurate measurements of the O iii M8 lines (see Section 3.7.1), this much higher O3+/H+ abundance ratio derived from the 4434.60 line is questionable. The effective recombination coefficients calculated by Kisielius & Storey ks1999 (1999) for the 5g – 4f transitions of O iii are utilized to estimate the intensity contributions where necessary.
3.7.4 Fluorescence of the O iii permitted lines
In Table 9 we compare the observed and predicted intensity ratios for several pairs of O iii Bowen fluorescence lines originating from the same upper level. The observed intensity ratios (column 2 of Table 9) are based on the measurements in NGC 7009 described in Section 3.7. The errors are estimated from the measurement errors, including Gaussian profile fit and noise level of the local continuum. The profiles of the strong O iii Bowen lines deviate from the exact Gaussian due to charge transfer effect, thus we used Gaussian profiles to fit these emission lines. The error from Gaussian profile fit is 5 – 10 per cent for strong O iii Bowen lines. These O iii Bowen lines are close to the blue end of the spectrum, the uncertainties due to the poor S/N in this wavelength region are also taken into account. The errors are significant for the two ratios 3791/3755 and 3774/3757, because the flux errors are large for the three relatively weak lines 3791.28 (about 21 per cent), 3757 (about 20 per cent) and 3774 (about 32 per cent), and thus the resulting uncertainties estimated from the error propagation formula are comparable to the ratio values. The observations of Liu & Danziger 1993a for the same object are also presented for comparison.
The radiative transition probabilities of O2+ have been calculated since late 1960s (Nussbaumer nussbaumer1969 1969), and later by Saraph & Seaton ss1980 (1980) and Luo et al. luo1989 (1989). In these approaches LS coupling was assumed. Calculations of the O2+ transition probabilities with the scheme of intermediate coupling are presented by Kastner et al. kastner1983 (1983) and Kastner & Bhatia kb1990 (1990) for some improved values for cascading from the 2p3d 3P level. Fischer fischer1994 (1994) carried out a non-relativistic configuration interaction calculation with relativistic correction and showed obvious improvement over the previous work. Simultaneously, a full relativistic configuration interaction calculation of Tong et al. tong1994 (1994) gave predicted O iii Bowen line ratios which were further improvement, especially for the 3133/3444 ratio. Their results are in agreement with observed ratios within the accuracy of observations. A more recent variational Breit-Pauli calculation was done by Tachiev & Fischer tff2001 (2001) for the carbon-like sequence. The current measurements agree better with the intermediate coupling values.
| Line Ratio | Current obs. | LD93a | SS80b | KBB83c | FF94d | TZLL94e | TFF01f |
|---|---|---|---|---|---|---|---|
| 3133/3444 | 3.2610.071 | 3.1400.440 | 3.610 | 4.450 | 3.170 | 3.290 | 3.342 |
| 3299/3341 | 0.2520.117 | 0.2850.022 | 0.201 | 0.228 | 0.264 | 0.260 | 0.268 |
| 3312/3341 | 0.6980.086 | 0.6510.048 | 0.606 | 0.656 | 0.728 | 0.717 | 0.736 |
| 3428/3444 | 0.1220.027 | 0.2040.023 | 0.336 | 0.164 | 0.150 | 0.149 | 0.154 |
| 3791/3755 | 0.2710.213 | 0.2320.037 | 0.330 | 0.309 | 0.296 | 0.301 | 0.299 |
| 3774/3757 | 0.5390.379 | 0.5690.127 | 0.750 | 0.715 | 0.708 | 0.701 | 0.704 |
3.8 The O iv permitted lines
Measurements of the O iv lines, 3403.52, 3411.69 and 3413.64 of the M2 3d 2D – 3p 3Po multiplet are of large uncertainty due to weakness and line blending (Fig. 40). The intensity of the 3411.69 line derived from multi-Gaussian profile fitting is 0.0570.014. The intensity ratio of the other two O iv M2 lines 3403.52 and 3413.64, which share the same upper level 2D3/2, is 1.318. This intensity ratio is significantly lower than the value in the LS coupling assumption, i.e. 5.0. So far the only effective recombination coefficients available for the O iv lines are the radiative recombination coefficients given by Péquignot, Petitjean & Boisson ppb1991 (1991) and the dielectronic recombination coefficients given by Nussbaumer & Storey ns1984 (1984). Both calculations were carried out in the LS coupling scheme. The O iv M2 lines are the only lines detected for this ion in the spectrum of NGC 7009, but are not used in abundance determinations.
4 Ionic and elemental abundances
In this section, we present the ionic abundances of helium and heavy elements derived from ORLs. For heavy element ions, the electron temperatures deduced from the N ii and O ii recombination line ratios are assumed (Section 2.3). For He+/H+, a value of 5100 K as deduced from the He i 7281/6678 ratio is adopted. For He++/H+, an electron temperature of 10 000 K, roughly the value deduced from the 5694 Å discontinuity of the He ii recombination continuum spectrum, is assumed. The average electron temperature derived from the various optical CEL ratios is 10 000 K (Paper I), and is used to determine the forbidden line abundances. Given that the electron densities derived from the N ii and O ii ORLs are close to those from the optical CELs, and that emissivities of the heavy element ORLs are only marginally sensitive to electron density, we have assumed a constant density of 4300 cm-3 throughout the abundance determinations.
4.1 Ionic abundances from ORLs
Ionic abundances of He, C, N, O, Ne, Mg and Si are derived in this Section, using the extinction-corrected fluxes of ORLs given in Paper I. A critical analysis of the C ii, N ii, O ii and Ne ii permitted lines detected in the spectrum of NGC 7009 is presented in Section 3, and is used to guide the determinations of ORL abundances of heavy element ions. Again, the new effective recombination coefficients for the N ii and O ii recombination spectrum are utilized.
4.1.1 He+/H+ and He2+/H+
Numerous calculations have been dedicated to the recombination spectrum of He i (e.g. Mathis mathis57 1957; Burgess & Seaton 1960a , 1960b ; Pottasch pottasch62 1962; Robbins robbins68 1968, robbins70 1970; Robbins & Robinson rr71 1971; Brocklehurst b72 1972; Almog & Netzer an89 1989; Smits smits91 1991, smits96 1996; Benjamin, Skillman & Smits bss99 1999, bss02 2002; Porter et al. porter05 2005; Bauman et al. bauman05 2005). The recombination-cascade spectrum of He i, with no collision taken into account, was first computed by Brocklehurst b72 (1972). A better treatment of emissivities from He i in nebular environment is that of Smits smits96 (1996), who used more accurate calculations of radiative transition rates and photoionization cross-sections, and corrected an error in Brocklehurst b72 (1972). Benjamin, Skillman & Smits bss99 (1999) combined the detailed He i recombination model of Smits smits96 (1996) with the collisional transitions of Sawey & Berrington sb93 (1993) and calculated more accurate He i recombination line emissivities that include the effects of collisional excitation from both the 2s 3S and 2s 1S levels. Benjamin, Skillman & Smits bss02 (2002) studied the effects of the optical depth of the 2s 3S metastable level on the He si̧ line intensities. The availability of these improved atomic data has made it possible to obtain secure measurements of the ionic and elemental abundances of helium, given high-quality spectroscopic data. Zhang et al. 2005a developed the nebular plasma diagnostics based on the He i ORLs, using the theoretical emissivities of He i lines provided by Benjamin, Skillman & Smits bss99 (1999). In Paper I, we derived electron temperatures from He i line ratios using the method of Zhang et al. 2005a . In order to keep consistency, we derived ionic and elemental abundances of helium in this Section, using the atomic data of Benjamin, Skillman & Smits bss99 (1999) and assuming the temperature to be that yielded by the He i lines (5000 K).
Ionic and elemental abundances of helium relative to hydrogen derived from the He i and He ii ORLs are presented in Table 10. The adopted He+/H+ ratio (0.099) is an average of the values derived from the He i 4471, 5876 and 6678 lines with weights of 1 : 3 : 1, roughly proportional to their intrinsic intensities (Benjamin, Skillman & Smits bss99 1999). Here the effective recombination coefficients were adopted from Benjamin, Skillman & Smits bss99 1999. Case A recombination was assumed for the triplet lines and Case B for the singlet. An electron temperature of 5000 K, as derived from the He i 7281/6678 ratio, and a density of 10 000 cm-3 were assumed. Under this physical condition, the effective recombination coefficient for the 4471 line given by Benjamin, Skillman & Smits bss99 1999 is 6 per cent higher than that of Brocklehurst b72 (1972). This difference is 7 per cent when the temperature increases to 10 000 K. The differences between the calculations of Benjamin, Skillman & Smits bss99 1999 and Brocklehurst b72 (1972) for the other two He i lines are less than 2 per cent at 5100 K. The 4471 line suffers most from line blending among the three He i lines: It is blended with two O ii M86c lines 4469.46 and 4469.48, three O iii lines M49c 4471.02, 4475.17 and M45b 4476.11, and one Ne ii line M61b 4468.91. Both wings of the 4471 line are also affected by weak features (Fig. 35). All the blending brings an uncertainty of 10 per cent to the intensity of the 4471 line. The 4471 line intensity adopted in the current analysis has been corrected for the contributions from the blended lines listed above, using the effective recombination coefficients available for the O ii and O iii lines. The intensity of the He i 6678 line has also been corrected for the contribution from the blended He ii 6683.20 (13h 2Ho – 5g 2G) line, which brings an uncertainty of about 3 per cent. The measurement uncertainty of the He i 5876 line is less than 2 per cent.
The He+/H+ abundances listed in Table 10 agree with each other reasonably well, except for those yielded by the triplet line 7065 (3s 3S – 2p 3Po) and the singlet line 5016 (3p 1Po – 2s 1S). The former one is more than two times higher than the average abundance, while the latter is nearly half of the value. The abnormally high abundance value is probably due to the enhanced 7065 line as a result of self-absorption from the metastable 2s 3S level. By comparing the observed intensities of the He i singlet lines of the s 1S– 2p 1Po, p 1Po – 2s 1S and d 1D – 2p 1Po series, relative to the 4922 (4d 1D2 – 2p 1P) line, with the theoretical predictions (c.f. Section in Paper I), we concluded that the singlet transitions of He i in NGC 7009 are close to the Case B assumption. Departure from Case B of the He i singlet lines as a result of the He i Lyman photons being destroyed by photoionization of neutral hydrogen and/or absorption by dust grains (Liu et al. 2001b ) is unlikely to be significant. Thus the low ionic abundance yielded by the 5016 line in Table 10 is mainly due to self-absorption from the metastable 2s 1S level. The 5016 line is blending with the N ii M19 3d 3F – 3p 3D2 5016.39, whose contribution is negligible ( 1.0 per cent).
The He2+/H+ abundance ratios were derived from two He ii lines 3203 (5f 2Fo – 3d 2D) and 4686 (4f 2Fo – 3d 2D). The effective recombination coefficients of the two lines were adopted from the hydrogenic calculation of Storey & Hummer sh1995 (1995). Although the electron temperature (11 000 K) derived from the discontinuity at 5694 Å of the He ii recombination continuum is of large uncertainty due to weakness of the jump, we assumed an electron temperature of 10 000 K when deriving the He2+/H+ abundance ratio. The total elemental abundance of helium relative to hydrogen is 0.112, which is calculated from He/H = He+/H+ + He2+/H+. This agrees well with the value of 0.109 given by LSBC.
Several He i recombination line series have been observed in our spectrum, and relative intensities of these lines are presented in Table 11. Also presented in the Table are the theoretical predictions given by Benjamin, Skillman & Smits bss99 (1999), Brocklehurst b72 (1972), and Smits smits96 (1996). Case A was assumed for the triplet lines and Case B for the singlet. The observed intensities of the d 3D – 2p 3Po and d 1D – 2p 1Po series of He i, relative to the 4471 line, agree well with those predicted by recombination theory. The obvious weakness of the p 1Po – 2s 1S series, compared with theoretical intensities, is caused by self-absorption from the metastable 2s 1S level. Such self-absorption should at the same time lead to the enhancement of the s 1S – 2p 1Po series. However, what we observed as shown in Table 11 are opposite: The 7281 line seems weaker than the recent prediction. The 3889 (3p 3Po – 2s 3S) line is affected by self-absorption. Enhancement of the s 3S – 2p 3Po series, in particular the 7065 line, is clearly observed. Similar patterns in the relative intensities of the He i lines are also observed in NGC 6153 (Liu et al. liu2000 2000), M 1-42 and M 2-36 (Liu et al. 2001b ).
| Hei+/H+ | Line | Abundance |
|---|---|---|
| (Å) | ||
| Triplet lines | ||
| He+/H+ | He i 3187.74 | 0.094 |
| He+/H+ | He i 3888.64 | 0.089 |
| He+/H+ | He i 4026.20 | 0.103 |
| He+/H+ | He i 4471.50 | 0.098 |
| He+/H+ | He i 5875.60 | 0.103 |
| He+/H+ | He i 7065.71 | 0.267 |
| Singlet lines | ||
| He+/H+ | He i 4921.93 | 0.099 |
| He+/H+ | He i 5015.68 | 0.065 |
| He+/H+ | He i 6678.15 | 0.095 |
| He+/H+ | He i 7281.35 | 0.090 |
| He+/H+ | Mean | 0.099 |
| He2+/H+ | He ii 4685.68 | 0.013 |
| He2+/H+ | He ii 3203.17 | 0.012 |
| He/H | 0.112 |
| (Å) | BSS99 | B72 | S96 | ||
|---|---|---|---|---|---|
| s 1S – 2p 1Po series | |||||
| 3935.91 | 8 | 0.002 | 0.0024 | ||
| 4023.99 | 7 | 0.005 | 0.0037 | ||
| 4437.55 | 5 | 0.014 | 0.013 | 0.0124 | |
| 5047.74 | 4 | 0.033 | 0.031 | 0.030 | |
| 7281.35 | 3 | 0.106 | 0.118 | 0.108 | 0.113 |
| p 1Po – 2s 1S series | |||||
| 3354.55 | 7 | 0.036 | 0.034 | ||
| 3447.59 | 6 | 0.042 | 0.054 | ||
| 3613.64 | 5 | 0.060 | 0.094 | 0.097 | |
| 5015.68a | 3 | 0.312 | 0.498 | 0.512 | 0.486 |
| d 1D – 2p 1Po series | |||||
| 3926.53 | 8 | 0.029 | 0.027 | ||
| 4009.26 | 7 | 0.049 | 0.041 | ||
| 4143.76 | 6 | 0.059 | 0.068 | ||
| 4387.93 | 5 | 0.125 | 0.120 | 0.124 | 0.120 |
| 4921.93 | 4 | 0.245 | 0.269 | 0.275 | 0.269 |
| 6678.15b | 3 | 0.770 | 0.849 | 0.866 | 0.847 |
| s 3S – 2p 3Po series | |||||
| 3599.32 | 9 | 0.005 | 0.0033 | ||
| 3732.88 | 7 | 0.007 | 0.0076 | ||
| 4120.99 | 5 | 0.054 | 0.028 | 0.0260 | |
| 4713.20 | 4 | 0.123 | 0.076 | 0.0649 | 0.075 |
| 7065.71 | 3 | 0.912 | 0.398 | 0.243 | 0.356 |
| p 3Po – 2s 3S series | |||||
| 3187.74 | 4 | 0.742 | 0.748 | 0.747 | 0.748 |
| 3888.64c | 3 | 1.714 | 1.891 | 1.895 | 1.865 |
| d 3D – 2p 3Po series | |||||
| 3456.86 | 19 | 0.006 | 0.0077 | ||
| 3461.01 | 18 | 0.008 | 0.0089 | ||
| 3465.94 | 17 | 0.009 | 0.0105 | ||
| 3471.81 | 16 | 0.011 | 0.0126 | ||
| 3478.97 | 15 | 0.018 | 0.0153 | ||
| 3487.72 | 14 | 0.021 | 0.0187 | ||
| 3498.64 | 13 | 0.026 | 0.0234 | ||
| 3512.51 | 12 | 0.034 | 0.0297 | ||
| 3530.49 | 11 | 0.040 | 0.0385 | ||
| 3554.41 | 10 | 0.055 | 0.0513 | ||
| 3587.27 | 9 | 0.073 | 0.0707 | ||
| 3634.23 | 8 | 0.112 | 0.101 | ||
| 3705.00 | 7 | 0.187 | 0.154 | ||
| 3819.60 | 6 | 0.275 | 0.251 | ||
| 4026.20 | 5 | 0.504 | 0.452 | 0.459 | 0.451 |
| 4471.50 | 4 | 1.000 | 1.000 | 1.000 | 1.000 |
| 5875.60 | 3 | 3.018 | 2.916 | 3.010 | 2.952 |
- a
-
Slightly overestimated due to the saturated [O iii] 5007 line.
- b
-
Corrected for the contribution from the He ii 6683.20 (13h 2Ho – 5g 2G) line.
- c
-
Corrected for the contribution from the H i H8 3889 line.
4.1.2 C2+/H+ abundances from ORLs
The C2+/H+ abundance ratios derived from the 3 – 3 and 4f – 3d transitions as well as from the g – 4f transition array are presented in Table 12. The effective recombination coefficients of Davey, Storey & Kisielius davey2000 (2000) were used. Their calculation was carried out from 500 to 20 000 K. As described earlier, an electron temperature of 1000 K deduced from the N ii and O ii ORLs and probably prevalent in the postulated “cold” component where the ORLs of heavy elements arise (Liu et al. liu2000 2000), was assumed in the calculations. Transitions between doublet states were assumed to be in Case B given the ground term C ii 2Po. For those doublet transitions whose Case B effective recombination coefficients are not available in Davey, Storey & Kisielius davey2000 (2000), the more recent calculations of Bastin bastin2006 (2006) were adopted. Bastin bastin2006 (2006) calculated the effective recombination coefficients for doublet transitions in both Case A and B from 5000 to 50 000 K. Accurately extrapolating the effective recombination coefficients of Bastin bastin2006 (2006) to 1000 K is difficult because the recombination coefficients are not exactly a linear function of electron temperature. The H i Balmer jump temperature 6500 K and a density of 4300 cm-3 were assumed when we derived the C2+/H+ abundance using the coefficients of Bastin bastin2006 (2006).
The C2+/H+ abundance ratio derived from the C ii 4267 line is 5.50710-4. In the calculation of Davey, Storey & Kisielius davey2000 (2000), the Case A effective recombination coefficient for the C ii 4267 line differs from Case B by only 0.8 per cent. If a temperature of 10 000 K is assumed, the C2+/H+ ratio derived will increase to 8.43210-4, which then agrees with the abundance given by LSBC. At 10 000 K, the effective recombination coefficient for the C ii 4267 line given by Davey, Storey & Kisielius davey2000 (2000) differs from that of Bastin bastin2006 (2006) by only 1.4 per cent in Case B, and 1.8 per cent in Case A. Thus we expect that the C2+/H+ ratio derived from the coefficients of Bastin bastin2006 (2006) should agree with LSBC.
In Table 12, the C2+/H+ abundance ratios derived from the three g 2G – 4f 2Fo lines (M17.02 9903, M17.04 6462, and M17.06 5342) and the M16.04 6f 2Fo – 4d 2D 6151 line are based on the Case B effective recombination coefficients of Bastin bastin2006 (2006). The abundance ratios all agree with those given by LSBC. The Case B effective recombination coefficients for the C ii g 2G – 4f 2Fo ( = 5, 6 and 7) transitions calculated by Bastin bastin2006 (2006) are almost identical to the Case A values at 6500 K; for the M16.04 6f 2Fo – 4d 2D 6151 transition, the effective recombination coefficients of the two cases differ by only 2 per cent. The C ii M4 4s 2S – 3p 2Po 3920 multiplet was not given by Davey, Storey & Kisielius davey2000 (2000), and the Case B recombination coefficient of Bastin bastin2006 (2006) was used. The derived C2+/H+ abundance ratio agrees with those derived from the three g – 4f transitions. The adopted C2+/H+ abundance ratio in the current paper is 6.86510-4, which is an average of the abundances derived from the transitions in Table 12.
| Line | Mult. | C2+/H+ | |
|---|---|---|---|
| (Å) | (10-4) | ||
| 4f 2Fo – 3d 2D | M6 | ||
| 4267 | 0.875 | 5.507 | |
| 4s 2S – 3p 2Po | M4 | ||
| 3918.98 | 0.015 | ||
| 3920.69 | 0.033 | ||
| sum | 0.048 | 8.370a | |
| 3d 2D – 3p 2Po | M3 | ||
| 7231.32 | 0.127 | ||
| 7236.42b | 0.262 | ||
| sum | 0.437 | 3.198 | |
| 5g 2G – 4f 2Fo | M17.02 | ||
| 9903.46 | 0.200 | 8.197a | |
| 6g 2G – 4f 2Fo | M17.04 | ||
| 6461.95 | 0.087 | 8.275a | |
| 7g 2G – 4f 2Fo | M17.06 | ||
| 5342.40 | 0.037 | 6.771a | |
| 6f 2Fo – 4d 2D | M16.04 | ||
| 6151.43 | 0.034 | 7.734a |
- a
-
Based on the C ii effective recombination coefficients of B06. An electron temperature of 6500 K, as derived from the H i Balmer jump, and a density of 4300 cm-3, as derived from the CEL ratios (Paper I), are assumed.
- b
-
Including the C ii M3 7237.17 line.
4.1.3 N2+/H+ abundances from ORLs
The N2+/H+ abundance ratios derived from the N ii ORLs detected in the spectrum of NGC 7009, with the most reliable measurements, are presented in Table 13. The M3 multiplet of the 3p – 3s configuration is the best observed amongst all the 3 – 3 transitions. The N ii effective recombination coefficients of Kisielius & Storey ks2002 (2002) are used when we derive the N2+/H+ abundance ratios from the total intensity of an N ii multiplet, which is a sum of line intensities of all the fine-structure components. If some components are missing from a multiplet, i.e., not detected due to weakness or line blending, the total intensity of that multiplet is then calculated by assuming the relative intensities of the fine-structure components are as in LS coupling. The most recent N ii effective recombination coefficients calculated by FSL11 are used when we derive the N2+/H+ abundances from the fine-structure components of each N ii multiplet. The Case B recombination was assumed for the triplets and Case A for the singlets. An electron temperature of 1000 K and a density of 4300 cm-3 were assumed throughout the abundance determinations. Under such physical condition, the effective recombination coefficient for H adopted is 1.8610-13 cm3 s-1, which is calculated from the hydrogenic theory of Storey & Hummer sh1995 (1995).
The M3 3p 3D – 3s 3Po 5680 multiplet is the strongest N ii permitted transition. At = 1000 K, the LS coupling effective recombination coefficient of N ii M3 5680 multiplet calculated by Kisielius & Storey ks2002 (2002) is case-insensitive, with the Case B value being only 20 per cent higher than that for Case A. In the calculation of FSL11, the Case B effective recombination coefficient for the 5679.56 line, which is the strongest component of the N ii M3 multiplet, is 27 per cent higher than in Case A. The Case B effective recombination coefficients for another two N ii M3 lines, 5666.63 and 5676.02, are higher than their corresponding Case A values by 28 and 24 per cent, respectively. The Case B coefficients of the other N ii M3 lines are about 24 to 28 per cent higher than for Case A. In Table 13, the N2+/H+ abundance ratios derived from the N ii M3 5680 multiplet lines almost agree with the value derived from the total intensity of this multiplet. The N ii singlet line 3p 1D – 3s 1Po 3995 is case-insensitive, with its Case B effective recombination coefficient being only 3.6 per cent higher than for Case A. The calculation of FSL11 shows that the Case B effective recombination coefficient for the 3995 line is higher than the Case A value by about 5 per cent at 1000 K.
The M5 3p 3P – 3s 3Po, M20 3d 3Do – 3p 3D, M28 3d 3Do – 3p 3P and M29 3d 3Po – 3p 3P multiplets of N ii are all case-sensitive. The Case B effective recombination coefficient for the M5 3p 3P – 3s 3Po 4623 multiplet calculated by Kisielius & Storey ks2002 (2002) is higher than in Case A by a factor of 9. FSL11 shows that the Case B effective recombination coefficient for the 4630.54 line, which is the strongest component of the N ii M5 multiplet, is higher than for Case A by a factor of 8. The Case B effective recombination coefficients for another two N ii M5 lines, 4601.48 and 4621.39, are 8 – 9 per cent higher than in Case A. For the weakest lines in the N ii M5 multiplet (the 4607.16, 4613.87 and 4643.09 lines), their Case B effective recombination coefficients do not differ much from the Case A values. In Table 13, the N2+/H+ abundance ratios derived from the N ii M5 components in the Case B assumption agree with those yielded by the case-insensitive N ii M3 5680 lines, which signifies Case B is a better assumption for the N ii M5 multiplet.
Kisielius & Storey ks2002 2002 shows that the Case B effective recombination coefficients for the N ii M20 3d 3Do – 3p 3D 4794, M28 3d 3Do – 3p 3P 5939 and M29 3d 3Po – 3p 3P 5479 multiplets are higher than those for Case A by a factor of 52, 51 and 25, respectively. FSL11 reveals that the Case B effective recombination coefficients for the strongest fine-structure components in the above three multiplets are 48, 49 and 16 times higher than those for Case A, at a given temperature of 1000 K. Given such large differences between the two cases, the N2+/H+ abundance ratios derived from the three N ii multiplets (Table 13) suggest that Case B is a better assumption for the 3 – 3 transitions of N ii.
N2+/H+ abundances are also derived from the 4f – 3d transitions, which are case-insensitive. The Case B effective recombination coefficient for M39b 4f G[9/2]5 – 3d 3F 4041.31, the strongest 4f – 3d transition of N ii, differs from the Case A value by only 0.25 per cent (FSL11). The N2+/H+ abundance derived from the 4041.31 line agrees well with that from N ii M39a 4f G[7/2]4 – 3d 3F 4043.53. Most of the other N ii 4f – 3d transitions in Table 13 yield abundances close to those from the 4041.31 and 4043.53 lines, except for M39b 4f G[9/2]4 – 3d 3F 4039.35, which gives an abnormally high abundance value. We attribute this to the large measurement error due to weakness of this line. N ii M58a 4f G[7/2]4 – 3d 1F 4552.53 also yields a relatively high abundance value, which could be due to the blended Si iii M2 4p 3P – 4s 3S1 4552.62 and Ne ii M55d 4f 2[2] – 3d 4F3/2 4553.17 lines. The intensity of the N ii M61a 4f D[5/2]2 – 3d 1P 4694.64 line is probably overestimated due to unknown blend, which can be noticed from the profile of the feature. The three lines 4039.35, 4552.53 and 4694.64 are excluded from calculating the total intensity and the average abundance ratio. The N2+/H+ abundances derived from the 4041.31, 4043.53 lines agree with those from the N ii M3 5666.63, 5679.56 lines. The N ii M3 5676.02 line yields a relatively high abundance. Measurements of this line could be unreliable due to the blended 5679.56 line, which is 4 times stronger (Fig. 28). The relatively low S/N’s at this wavelength region also affect the measurements.
It has been known for decades that the N ii permitted lines from the low-lying 3d – 3p and 3p – 3s triplet arrays, whose upper levels are linked to the ground term 2p2 3P by resonance lines, can be enhanced by fluorescence excitation. Grandi grandi1976 (1976) used photoionization models to study the excitation mechanisms of permitted transitions from common heavy element ions observed in the spectra of the Orion nebula and PNe NGC 7027 and NGC 7662, and found that while the N ii M28 3d 3Do – 3p 3P 5942 multiplet is excited by both recombination and continuum fluorescence of the starlight, emission of the N ii M3 3p 3D – 3s 3Po 5680, M5 3p 3P – 3s 3Po 4630 and M30 4s 3Po – 3p 3P 3838 multiplets are dominated by fluorescence excitation of the N ii 4s 3P level by the He i 1s8p 1p – 1s2 1S0 508.643 resonance line, which coincides in wavelength with the N ii 2p4s 3P – 2p2 3P0 508.668 line. Fluorescence excitation, by line or continuum, however, cannot excite the singlet transitions or transitions from the 3d – 4f configuration. Escalante & Morisset em2005 (2005) analyzed the N ii spectrum of the Orion nebula by using nebular and stellar atmosphere models. Their modeling shows that the intensity of most of the N ii permitted lines in Orion could be explained by fluorescence of the starlight continuum. Recombination of N2+ contributes a minor part of the observed intensities of lines from the 3p and 3d levels connected to the ground state. They confined the effective temperature of the ionizing star to be lower than 38 000 K in order to reproduce the observed line intensities. Our current analysis shows that the N2+/H+ abundances derived from the 3p – 3s transitions agree with those derived from the 4f – 3d recombination lines (the values in boldface in Table 13), which are unlikely to be affected by the fluorescence mechanisms. That indicates fluorescence excitation of the N ii 3p – 3s lines, albeit may still exists, is probably insignificant in NGC 7009. Fluorescence enhancement of the N ii lines by starlight could also be negligible, given the physical condition of NGC 7009 (C. Morisset, private communication). However, physical parameters, e.g., UV radiation field of the central star, optical depth of the resonance transition that connect the ground state 2p2 3P and an excited state (e.g. 2p4s 3Po), column densities of N+ and N2+ ions, etc., are needed in order to estimate the enhancement of the N ii lines due to resonance fluorescence by starlight or by other emission lines. That means consistent modeling of the central star and nebula is needed.
The average N2+/H+ abundance from the 3 – 3 transitions is 3.7010-4, which agrees with the average value (3.7110-4) from the 4f – 3d transitions. Here the N ii transitions (e.g. M29) that yield abnormally high abundances are excluded from averaging. The N2+/H+ abundance derived by co-adding the line intensities of the 4f – 3d transitions is 3.4210-4, which agrees well with the abundance calculated from the total intensity of the M3 multiplet of N ii (the values in boldface in Table 13). The abundances derived from total intensities of the 4f – 3d transitions are preferred over the average values of abundances from individual lines, since strong lines are better detected with smaller (relative) flux uncertainties. We adopt the mean value (3.4510-4) derived by averaging the abundances from the M3 multiplet and the total intensity of the 4f – 3d transitions as the recombination line N2+/H+ abundance of NGC 7009. This value is about 10 per cent higher than 3.1010-4 (slit position angle PA = 45o) given by LSBC, who used the N ii M39b 4041.31 and M39a 4043.53 lines to derive the N2+/H+ abundance of NGC 7009.
| Line | Mult. | N2+/H+ | ||
| (10-4) | ||||
| (Å) | FSL11 | KS02 | ||
| 3 – 3 transitions | ||||
| 5666.63 | M3 | 0.064 | 3.442 | |
| 5676.02 | M3 | 0.036 | 4.075 | |
| 5679.56 | M3 | 0.130 | 3.319 | |
| 5686.21 | M3 | 0.024 | 4.695 | |
| 5710.77 | M3 | 0.020 | 2.886 | |
| M3 3p 3D – 3s 3Po | 0.280 | 3.482 | 3.358 | |
| 4601.48 | M5 | 0.016 | 3.087 | |
| 4621.39a | M5 | 0.020 | 4.423 | |
| 4630.54 | M5 | 0.067 | 3.549 | |
| M5 3p 3P – 3s 3Po | 0.102 | 3.598 | 2.242 | |
| 3994.99 | M12 | 0.033 | 6.655 | |
| M12 3p 1D – 3s 1Po | 0.033 | 6.655 | 6.776 | |
| 4803.29 | M20 | 0.032 | 2.723 | |
| M20 3d 3Do – 3p 3D | 0.078 | 4.412 | 3.464 | |
| 5941.65b | M28 | 0.030 | 1.795 | |
| M28 3d 3Do – 3p 3P | 0.063 | 3.038 | 2.119 | |
| 5480.06c | M29 | 0.012 | 9.409 | |
| M29 3d 3Po – 3p 3P | 0.061 | 14.949 | 7.590 | |
| Average | 3.695 | |||
| 4f – 3d transitions | ||||
| 4035.08 | M39a | 0.035 | 2.926 | |
| 4041.31d | M39b | 0.081 | 3.174 | |
| 4043.53 | M39a | 0.035 | 3.168 | |
| 4171.61 | M43b | 0.023 | 3.033 | |
| 4176.16 | M43a | 0.021 | 3.739 | |
| 4236.91e | M48a | 0.036 | 3.727 | |
| 4241.78f | M48a | 0.093 | 3.689 | |
| 4179.67 | M50a | 0.010 | 3.508 | |
| 4432.74 | M55a | 0.036 | 3.089 | |
| 4442.02 | M55a | 0.011 | 3.204 | |
| 4552.53g | M58a | 0.032 | 6.381 | |
| 4530.41 | M58b | 0.046 | 3.792 | |
| 4678.14 | M61b | 0.012 | 3.049 | |
| 4694.64 | M61a | 0.020 | 5.393 | |
| Sum | 0.466 | 3.419 | ||
| Average | 3.705 | |||
- a
-
Including O ii M92c lines 4f F[2] – 3d 2D5/2 4621.27. Neglecting O ii M92c 4f F[2] – 3d 2D5/2 4622.14.
- b
-
Neglecting the N ii M28 3d 3D – 3p 3P1 5940.24 line, which contributes less than 1 per cent to the total intensity.
- c
-
Including N ii M29 3d 3P – 3p 3P1 5478.10.
- d
-
Corrected for the contribution from the O ii M50c 4f F[2] – 3d 4F5/2 4041.28 line (7 per cent).
- e
-
Corrected for the contribution from the N ii M48b 4f F[7/2]3 – 3d 3D 4237.05 line (30 per cent).
- f
-
Including N ii M48b 4f F[7/2]4 – 3d 3D 4241.78.
- g
-
Including the contribution from the Ne ii M55d 4f 2[2] – 3d 4F3/2 4553.17 line. Neglecting Ne ii M55d 4f 2[2] – 3d 4F3/2 4553.40.
4.1.4 O2+/H+ abundances from ORLs
In the spectrum of NGC 7009, O ii has the most abundant optical recombination spectrum amongst all the heavy element ions detected. The most prominent multiplets of the O ii transitions are presented in Section s 3.3 and C. The spectrum analyzed in the current paper covers very broad wavelength range (3040–11 100 Å) and is among the deepest CCD spectra ever taken for an emission line nebula, and also has higher quality than that published by LSBC. In the wavelength ranges 3040–4048 Å and 3990–4980 Å, where the most prominent recombination lines of O ii are located, our data quality is as good as that of Liu et al. liu2000 (2000) for PN NGC 6153, which was observed using the same instruments mounted on the ESO 1.5 m telescope. The O2+/H+ abundance ratios derived from the O ii ORLs with the most reliable measurements are presented in Tables 14 (the 3d – 3p and 3p – 3s transitions) and 15 (the 4f – 3d transitions). The Case B effective recombination coefficients of O ii calculated by PJS are adopted for the abundance determinations. An electron temperature of 1000 K is assumed. For purpose of comparison, the effective recombination coefficients of Storey storey1994 (1994) for the 3p – 3s transitions, and LSBC for the 3d – 3p and 4f – 3d transitions, are also used. Case B is assumed for the quartet transitions, and Case A for the doublets. An electron temperature of 5000 K is assumed when using the data of Storey storey1994 (1994), whose calculation is valid from 5000 to 20 000 K. Since the calculation of Storey storey1994 (1994) is only spectral term-resolved, we deduce the effective recombination coefficients for each fine-structure component of a multiplet with the assumption that their relative intensities are as in the LS coupling. As in the case of the N ii lines (Section 4.1.3), for each multiplet in Table 14, we calculate the abundance value using the co-added intensities from all fine-structure components observed; for the O ii 4f – 3d transitions in Table 15, we also calculate the abundance after co-adding the intensities of all detected lines.
The O ii M1 3p 4Do – 3s 4P 4650 multiplet is case-insensitive. At 5000 K, the Case B effective recombination coefficient of the M1 4650 multiplet given by Storey storey1994 (1994) is only 3.4 per cent higher than for Case A. Péquignot, Petitjean & Boisson ppb1991 (1991) shows that the difference between the effective radiative recombination coefficients in the two cases for this multiplet is 2.5 per cent. The most recent calculation of PJS reveals that the difference between the effective recombination coefficients in the two cases for the strongest O ii M1 line 4649.13 is less than 5 per cent. The coefficients in the two cases for the other O ii M1 fine-structure lines are of similar order. The O2+/H+ abundances derived from the individual O ii M1 lines agree with each other, except for 4638.86 and 4673.73, which yield very high abundance values. The average O2+/H+ from O ii M1 is 16.210-4, which agrees well with the values derived from the recombination coefficients of Péquignot, Petitjean & Boisson ppb1991 (1991) and Storey storey1994 (1994). The current measurements of the multiplet also agrees with LSBC, who gives 15.310-4 (PA = 0o) and 13.510-4 (PA = 45o).
Of the seven observed 3d – 3p multiplets in Table 14, the intensities of those from the upper terms 2p23d F and 2p23d 4D are almost independent of the assumption of Case A or Case B. The M2 3p 4Po – 3s 4P 4341, M6 3p 2Po – 3s 2P 3967, M10 3d 4F – 3p 4Do 4075, M12 3d 4D – 3p 4Do 3867, M20 3d 4D – 3p 4Po 4111 and M26 3d 2D – 3p 2Do 4385 multiplets of O ii are case-insensitive, with their Case B or Case C555Defined with reference to the O ii recombination spectrum. In Case B, lines terminating on the 2p3 4So term are assumed to be optically thick and no radiative decays are permitted to this state. In Case C, radiative decays to both the 2p3 4So and 2Do terms are excluded. effective recombination coefficients being 2.3–30 per cent higher than those for Case A (Storey storey1994 1994). The O2+/H+ abundance ratios derived from the M1 and M2 multiplets agree with those derived from the 3d – 3p and 4f – 3d transitions, while in LSBC and Liu et al. liu2000 (2000) for NGC 6153, the abundances from those two multiplets are lower by about 40 per cent and a factor of 2. respectively. For Case C to apply to the doublets, it requires transitions to the 2p3 2Do state of the ground configuration to be optically thick, which is unlikely in the physical condition of NGC 7009. Thus the doublets (e.g. the M5 3p 2Do – 3s 2P 4418, M6 3p 2Po – 3s 2P 3967 and M25 3d 2F – 3p 2Do 4704 multiplets) can be regarded as case-insensitive. The M11 3d 4P – 3p 4Do 3903, M19 3d 4P – 3p 4Po 4152 and M28 3d 4P – 3p 4So 4913 multiplets, which have the same upper term that can decay to the 2p3 4So ground state of O ii via resonance transitions, are expected to be very case-sensitive: their Case B effective recombination coefficients are more than 20 times higher than the Case A values.
Table 14 shows that in our current analysis, the O2+/H+ abundance ratios derived from the quartets M10, M12 and M20, all case-insensitive, are systematically higher than those derived from the case-sensitive multiplets M19 and M28, a phenomenon discovered by Liu et al. liu2000 (2000) for NGC 6153. As pointed out by Liu et al. liu2000 (2000), it is possible that there is a small departure from the assumed Case B towards Case A, which would increase the derived abundances for the multiplets that decay from the 2p23d 4P upper term. The three doublets presented in Talbe 14 all yield abundance values that are consistent with those derived from the case-insensitive quartets (M10, M12 and M20), except for the M6 doublets, which yield systematically higher abundances. The O ii M28 lines yield relatively lower abundance ratios, indicating that Case B might not be a good approximation for this multiplet. The O2+/H+ abundance ratios derived from the 4132.80 and 4153.30 line of the M19 multiplet of O ii are obviously lower than the other O ii multiplets. The observed 4156.53 line of M19 is too strong compared to other components of this multiplet, with the derived abundance value being higher than those deduced from other multiplets by nearly a factor of two. That was also observed in NGC 6153 (Liu et al. liu2000 2000) and by LSBC for the same object. No convincing candidates for lines which might be blended with the O ii M19 4156.53 line, and thus cause the discrepancy, were found by LSBC. In NGC 7009, the intensity ratio of the 4156.53 ( = 3/2 – 5/2) and 4132.80 ( = 3/2 – 1/2) lines of M19, which decay from the same upper level, is 1.06, which is about a factor of two lower than the values of 1.7 (slit position PA = 0o) and 2.1 (PA = 45o) found for the same object by LSBC, but agrees with the values of 0.6 (for the minor axis) and 1.1 (for the whole nebula) given by Liu et al. liu2000 (2000) for NGC 6153. The 4132.80 line detected in our spectrum of NGC 7009 has an FWHM of 1.85 Å, which is broader than the 4156.53 line (FWHM1.60 Å). Such a line width of the 4132.80 line might be contributed by line blending, which results in a line ratio that is lower than the previous measurements. Besides, different data quality might also contribute to the discrepancy between LSBC and our current measurements. For the 4156.53 line, we still do not know which feature it is blended with.
In general, the O2+/H+ abundance ratios deduced using the Case B effective recombination coefficients of PJS are lower than those deduced using the radiative recombination coefficients of LSBC, by 30–50 per cent for the 3d – 3p transitions, and by 20–30 per cent for most of the 4f – 3d transitions. The O2+/H+ abundance ratios calculated, by co-adding the line intensities of each multiplet of the 3p – 3s configuration, using the effective recombination coefficients of PJS, do not differ much from those deduced using the coefficients of Storey storey1994 (1994). However, the abundances deduced from each fine-structure components of the 3p – 3s multiplets, using the effective recombination coefficients of PJS, are systematically lower than those deduced using the coefficients of Storey storey1994 (1994). This difference is more obvious for the two doublets M5 and M6, with the abundances deduced based on the coefficients of PJS being lower by about 10 per cent. If we use the Case A effective recombination coefficients of Storey storey1994 (1994), the derived abundances will be lower than those deduced using the data of PJS by a factor of 7. The 4f – 3d transitions are essentially case-insensitive, and the O2+/H+ abundance ratios derived from those lines using the data of PJS agree well. The abundance value calculated by co-adding the 4f – 3d line intensities in Table 14 is 1.33010-3, which agrees with the average value (1.40310-3) of the 3 – 3 transitions. The mean O2+/H+ abundance ratios derived by averaging the values from all 3 – 3 multiplets (excluding the values that are abnormally high) plus the co-added 4f – 3d transitions is 1.41710-3, which is slightly lower than the recombination line abundances given by LSBC: 17.01.010-4 (PA = 45o) and 17.61.710-4 (PA = 0o). This value is adopted as the recombination line O2+/H+ abundance in NGC 7009.
| Line | Mult. | O2+/H+ | ||
|---|---|---|---|---|
| (10-4) | ||||
| (Å) | PJS | LSBC | ||
| 4638.86 | M1 | 0.335 | 25.002 | 33.581 |
| 4641.81 | M1 | 0.437 | 14.549 | 17.355 |
| 4649.13 | M1 | 0.666 | 13.677 | 13.886 |
| 4650.84 | M1 | 0.175 | 12.731 | 17.542 |
| 4661.63 | M1 | 0.217 | 14.490 | 16.946 |
| 4673.73 | M1 | 0.052 | 21.607 | 25.815 |
| 4676.24 | M1 | 0.158 | 15.125 | 14.642 |
| 4696.35 | M1 | 0.015 | 13.528 | 12.510 |
| M1 3p 4Do – 3s 4P | 2.056 | 15.241 | 17.369 | |
| 4317.14 | M2 | 0.091 | 12.821 | 12.383 |
| 4319.63 | M2 | 0.063 | 14.010 | 7.938 |
| 4325.76 | M2 | 0.029 | 17.471 | 19.731 |
| 4336.86 | M2 | 0.053 | 18.008 | 22.536 |
| 4345.56 | M2 | 0.141 | 15.455 | 19.187 |
| 4349.43 | M2 | 0.195 | 15.876 | 10.530 |
| 4366.89 | M2 | 0.085 | 11.471 | 10.710 |
| M2 3p 4Po – 3s 4P | 0.657 | 14.589 | 12.577 | |
| 4414.90 | M5 | 0.100 | 19.665 | 22.885 |
| 4416.97 | M5 | 0.064 | 17.370 | 26.363 |
| 4452.37 | M5 | 0.014 | 20.859 | 28.835 |
| M5 3p 2Do – 3s 2P | 0.178 | 18.855 | 24.440 | |
| 3945.04 | M6 | 0.026 | 56.459 | 61.094 |
| 3954.36 | M6 | 0.030 | 31.310 | 35.245 |
| 3973.26 | M6 | 0.065 | 27.719 | 30.546 |
| 3982.71 | M6 | 0.010 | 20.411 | 23.497 |
| M6 3p 2Po – 3s 2P | 0.131 | 30.785 | 29.451 | |
| 4069.89a | M10 | 0.635 | 16.777 | 23.914 |
| 4072.16b | M10 | 0.549 | 17.051 | 20.461 |
| 4075.86 | M10 | 0.687 | 16.687 | 19.241 |
| 4078.84 | M10 | 0.089 | 15.899 | 11.811 |
| 4085.11 | M10 | 0.107 | 16.746 | 23.176 |
| 4092.93c | M10 | 0.077 | 17.567 | 22.941 |
| M10 3d 4F – 3p 4Do | 2.144 | 16.732 | 20.841 | |
| 3907.45 | M11 | 0.010 | 16.364 | 9.291 |
| M11 3d 4P – 3p 4Do | 0.026d | 15.861 | 8.411 | |
| 3842.82 | M12 | 0.015 | 12.406 | 28.465 |
| 3851.03 | M12 | 0.017 | 12.351 | 19.397 |
| 3882.19e | M12 | 0.053 | 14.929 | 14.462 |
| M12 3d 4D – 3p 4Do | 0.099 | 13.877 | 10.972 | |
| 4129.32 | M19 | 0.032 | 21.489 | 45.444 |
| 4132.80 | M19 | 0.078 | 9.736 | 13.237 |
| 4140.70f | M19 | 0.003 | 45.123 | 23.923 |
| 4153.30 | M19 | 0.112 | 9.596 | 13.302 |
| 4156.53g | M19 | 0.079 | 35.714 | 59.101 |
| 4169.22 | M19 | 0.082 | 17.892 | 28.689 |
| M19 3d 4P – 3p 4Po | 0.386 | 13.760 | 17.267 | |
| 4110.79 | M20 | 0.025 | 14.198 | 9.655 |
| M20 3d 4D – 3p 4Po | 0.259d | 14.162 | 10.973 | |
| Line | Mult. | O2+/H+ | ||
|---|---|---|---|---|
| (10-4) | ||||
| (Å) | PJS | LSBC | ||
| 4699.22 | M25 | 0.024 | 25.809 | 33.771 |
| 4705.35 | M25 | 0.021 | 16.924 | 17.753 |
| M25 3d 2F – 3p 2Do | 0.046h | 20.735 | 24.293 | |
| 4890.86 | M28 | 0.013 | 6.360 | 10.377 |
| 4906.83 | M28 | 0.046 | 10.907 | 17.114 |
| 4924.53 | M28 | 0.074 | 10.609 | 16.190 |
| M28 3d 4P – 3p 4So | 0.133 | 10.049 | 15.311 | |
| Average | 14.032 | 21.896 | ||
- a
-
Including the O ii M10 3d 4F3/2 – 3p 4D 4069.62 line.
- b
-
Corrected for the contribution from the O ii M48a 4f G[5] – 3d 4F7/2 4071.23 line (10 per cent). Neglecting the N ii M38b 4f G[7/2]3 – 3d 3F 4073.05 line (2 per cent).
- c
-
Overestimated due to N iii M1 3p 2P – 3s 2S1/2 4097.33 line which is more than 20 times stronger.
- d
-
Assuming the relative intensities of this multiplet are the predicted values based on the effective recombination coefficients of PJS.
- e
-
Corrected for the contribution from the O ii M11 3d 4P3/2 – 3p 4D 3882.45 line (17 per cent). Neglecting the O ii M12 3d 4D5/2 – 3p 4D 3883.13 line (2 per cent).
- f
-
Overestimated due to the much stronger He i M53 6d 1D2 – 2p 1P 4143.76 line.
- g
-
Neglecting the N ii M50b 4f D[3/2]2 – 3d 3D 4156.39 and the N ii M50b 4f D[2]1 – 3d 3D 4157.01 lines (4 per cent in total).
- h
-
Not including the O ii M25 3d 2F5/2 – 3p 2D 4741.71 line.
| Line | Mult. | O2+/H+ | ||
|---|---|---|---|---|
| (10-4) | ||||
| (Å) | PJS | LSBC | ||
| 4089.29a | M48a | 0.264 | 12.901 | 15.308 |
| 4083.90 | M48b | 0.094 | 13.310 | 19.077 |
| 4087.15b | M48c | 0.091 | 13.675 | 19.461 |
| 4062.94c | M50a | 0.036 | 13.975 | 16.592 |
| 4048.21d | M50b | 0.021 | 14.363 | 19.236 |
| 4303.83e | M53a | 0.120 | 13.844 | 16.847 |
| 4294.78f | M53b | 0.067 | 13.025 | 16.756 |
| 4307.23 | M53b | 0.029 | 12.415 | 16.053 |
| 4288.82g | M53c | 0.026 | 17.477 | 15.659 |
| 4282.96h | M67c | 0.063 | 17.615 | 23.690 |
| 4466.42i | M86b | 0.032 | 12.247 | 20.368 |
| 4489.49 | M86b | 0.022 | 12.958 | 19.542 |
| 4491.23 | M86a | 0.057 | 14.606 | 24.119 |
| 4609.44j | M92a | 0.128 | 13.969 | 17.309 |
| 4602.13k | M92b | 0.052 | 12.938 | 17.628 |
| sum | 1.103 | 13.303 | 17.556 | |
| Average | 13.955 | 18.510 | ||
- a
-
Corrected for the contribution from Si iv M1 4p 2P – 4s 2S1/2 4088.86, which is about 15 per cent. Neglecting O ii M48a 4f G[5] – 3d 4F9/2 4088.27 (less than 2 per cent).
- b
-
Neglecting N ii M38a 4f F[5/2]3 – 3d 3F 4087.30 (about 3 per cent).
- c
-
Including Ne ii M53 4f 0[3] – 3d 4D5/2 4062.97.
- d
-
Neglecting the contribution from O ii M50b 4f F[3] – 3d 4F7/2 4047.80, which is probably 7 per cent.
- e
-
Corrected for the contribution from O ii M65a 4f G[5] – 3d 4D7/2 4303.61, which is about 20 per cent.
- f
-
The contribution from O ii M53b 4f D[2] – 3d 4P3/2 4294.92 to the blend at 4295, which is estimated to be 28 per cent, has been subtracted.
- g
-
A blend of O ii M53c 4f D[1] – 3d 4P1/2 4288.82 and O ii M53c 4f D[1] – 3d 4P1/2 4288.82.
- h
-
Corrected for the contributions from O ii M67c 4f F[2] – 3d 4D3/2 4283.73 (about 35 per cent) and O ii M67c 4f F[2] – 3d 4D5/2 4283.25 (about 6 per cent). Neglecting O ii M78a 4f F[4] – 3d 2F5/2 4282.02 (less than 2 per cent). Including Ne ii M57c 4f 1[3] – 3d 4F7/2 4283.73, whose contribution to the total intensity is unknown due to the lack of atomic data.
- i
-
Corrected for the contribution from O ii M86b 4f D[2] – 3d 2P3/2 4466.59, which is about 20 per cent.
- j
-
Corrected for the contribution from O ii M92c 4f F[2] – 3d 2D3/2 4610.20, which is about 20 per cent.
- k
-
Corrected for the contribution from N ii M5 3p 3P2 – 3s 3P 4601.48, which is about 25 per cent.
4.1.5 Ne2+/H+ abundances from ORLs
Tables 16 and 17 present the recombination line Ne2+/H+ abundances derived from the 3 – 3 and 4f – 3d transitions, respectively. For the 3d – 3p and 3p – 3s transitions, the effective recombination coefficients calculated in the LS coupling assumption by Kisielius et al. kisielius1998 (1998) are adopted. Case A is assumed for the quartet transitions and Case B for the doublets. The calculation of Kisielius et al. kisielius1998 (1998) is valid from 1000 to 20 000 K, and four density cases, 102, 104, 105 and 106 cm-3, were calculated. We assumed an electron density of 104 cm-3 and a temperature of 1000 K in the abundance determinations. For purpose of comparison, also presented in Tables 16 and 17 are the recombination line Ne2+/H+ abundances derived by LLB01, who used the same CCD spectrum as analyzed in the current paper but assumed an electron temperature of 7100 K, as derived from the Balmer discontinuity. In general, the Ne2+/H+ abundance ratios derived from the 3d – 3p and 3p – 3s transitions in the current work are lower than those given by LLB01. This is mainly due to the different temperatures adopted. For the 4f – 3d transitions, the abundances derived by us are systematically lower than those given by LLB01 by about 13 per cent, except the strongest lines of this transition array, e.g. 4391.99 (M55e 4f 2[5] – 3d 4F9/2) and 4409.30 (M55e 4f 2[5] – 3d 4F7/2), which yield close Ne2+/H+ abundance ratios from the two analyses. The difference between the abundances given by the two analyses are partially contributed by the different extinctions used: The logarithmic extinction at H, (H), derived by LLB01 is 0.07, while ours is 0.174 (Paper I).
The Ne ii M21 3d 2D5/2 – 3p 2D 3416.91 line yields relatively higher abundance, probably due to a blend of the Ne ii M19 3d 4F7/2 – 3p 2D 3417.69 line. The nearby O iii Bowen fluorescence line M15 3d 3P – 3p 3P1 3415.26 also affects the measurement of the 3416.91 line (Fig. 40). The Ne ii lines of the M9 3p′ 2Fo – 3s′ 2D multiplet, 3568.50 and 3574.61 are detected in the spectrum of NGC 7009 (Fig. 37). The Ne2+/H+ abundance derived from this multiplet is much higher than yielded by other multiplets. Similar results are also observed by LLB01 and in another two PNe, M 1-42 and M 2-36 (Liu et al. 2001b ). LLB01 pointed out that the high abundance yielded by M9 is possibly due to the underestimated effective recombination coefficients for this multiplet. The 3p 4D – 3s 4P3/2 3355.02 line of multiplet M2 is blended with the He i M8 7p 1P – 2s 1S0 3354.55 line, and is also partially blended with the [Cl iii] 3p3 2P – 3p3 4S 3353.17 line, as shown in Fig. 50. The intensity of the [Cl iii] line was obtained from line fitting with two Gaussian profiles. The intensity contribution from the He i line was corrected for, as LLB01 did, using the observed intensity of the He i M6 5p 1P – 2s 1S0 3613.64 line, assuming the line ratio (3354.55)/(3613.64) = 0.35 (in Case B assumption), as predicted by Brocklehurst b72 (1972). Here an electron temperature of 5000 K, as derived from the He i line ratios (Paper I), and a density of 10 000 cm-3 were assumed. The correction for the He i line amounts to 26 per cent, close to the result of LLB01 (30 per cent). The reason that we use the He i 3613.64 line, instead of the He i M48 4d 1D2 – 2p 1P 4921.93 line, to correct for the intensity contribution from the He i 3354.55 line is that given the small wavelength span between the 3354.55, 3613.64 lines, measurements of their intensity ratio are much less sensitive to any uncertainties in reddening corrections and flux calibration.
The Ne ii 4f – 3d recombination lines in Table 17 are those whose preliminary effective recombination coefficients are available (P. J. Storey, private communication). The Ne2+/H+ abundances derived from the 4f – 3d transitions are systematically higher than those derived from the 3 – 3 transitions by about 50 per cent. The difference between the abundances derived from the 3 – 3 and 4f – 3d transitions is mainly due to the inadequacy of the Ne ii effective recombination coefficients. The average Ne2+/H+ abundance from the 4f – 3d transitions is 8.510-4, about 0.15 dex higher than the average value deduced from the individual lines of the 3 – 3 transition array. Here the two abnormally high abundances yielded by the Ne ii M52b 4250.65 (4f 2[3] – 3d 4D3/2) and M61d 4457.05 (4f 2[2] – 3d 2D3/2) lines are excluded from averaging. We adopt the abundance value 8.4210-4, which is calculated by co-adding the intensities of the 4f – 3d transitions, as the recombination line Ne2+/H+ abundance of NGC 7009. The two Ne ii lines 4250.65 and 4457.05 that yield abnormally high abundances are excluded from the abundance calculation.
| Line | Mult. | Ne2+/H+ | ||
|---|---|---|---|---|
| (10-4) | ||||
| (Å) | Current | LLB01 | ||
| 3694.21 | M1 | 0.254 | 7.932 | 8.97 |
| 3709.62 | M1 | 0.105 | 8.290 | 8.49 |
| 3777.14 | M1 | 0.048 | 3.859 | 3.54 |
| M1 3p 4Po – 3s 4P | 0.686 | 7.544 | 7.45 | |
| 3334.84 | M2 | 0.414 | 5.847 | 5.14 |
| 3344.40 | M2 | 0.129 | 8.805 | |
| 3355.02a | M2 | 0.195 | 5.278 | 5.89 |
| M2 3p 4Do – 3s 4P | 1.035 | 5.850 | 5.39 | |
| 3713.08 | M5 | 0.297 | 6.141 | |
| M5 3p 2Do – 3s 2P | 0.495 | 6.141 | ||
| 3481.93 | M6 | 0.043 | 4.795 | 5.52 |
| M6 3p 2So – 3s 2P | 0.066 | 4.795 | 5.52 | |
| 3047.56 | M8 | 0.120 | 7.720 | |
| M8 3d 4D – 3p 4Po | 0.571 | 7.692 | ||
| 3329.16 | M12 | 0.051 | 7.67 | |
| 3357.82 | M12 | 0.020 | ||
| 3362.94 | M12 | 0.026 | ||
| 3374.06 | M12 | 0.014 | ||
| 3390.55 | M12 | 0.016 | ||
| M12 3d 4D – 3p 4Do | 0.149 | 8.051 | 7.67 | |
| 3218.19 | M13 | 0.227 | 4.836 | 5.45 |
| 3244.09 | M13 | 0.072 | 2.253 | 2.02 |
| M13 3d 4F – 3p 4Do | 0.636 | 4.840 | 3.68 | |
| 3367.22 | M20 | 0.102 | 2.820 | 3.38 |
| M20 3d 2F – 3p 2Do | 0.179 | 2.832 | 3.38 | |
| 3416.91b | M21 | 0.075 | 11.818 | 13.00 |
| 3453.07 | M21 | 0.018 | 4.448 | 4.25 |
| M21 3d 2D – 3p 2Do | 0.050 | 3.529 | 4.25 | |
| 3542.85 | M34 | 0.030 | 2.89 | |
| 3565.82 | M34 | 0.024 | ||
| 3594.16 | M34 | 0.011 | ||
| M34 3d 4P – 3p 4So | 0.065 | 3.006 | 3.05 | |
| 3568.50 | M9 | 0.168 | ||
| 3574.61c | M9 | 0.053 | ||
| M9 3p′ 2Fo – 3s′ 2D | 0.221 | 36.125 | ||
| Average | 6.040 | |||
- a
-
Corrected for the contribution from the He i M8 7p 1P – 2s 1S0 3354.55 line.
- b
-
Probably overestimated due to Ne ii M19 3d 4F7/2 – 3p 2D 3417.69. Excluded from calculating the average Ne2+/H+ abundance ratio.
- c
-
Including the Ne ii M9 3p′ 2F – 3s′ 2D5/2 3574.18 line.
| Line | Mult. | Ne2+/H+ | ||
|---|---|---|---|---|
| (10-4) | ||||
| (Å) | Current | LLB01 | ||
| 4391.99a | M55e | 0.072 | 7.451 | 7.53 |
| 4409.30 | M55e | 0.058 | 9.039 | 9.80 |
| 4219.75b | M52a | 0.049 | 9.135 | 12.60 |
| 4233.85 | M52a | 0.011 | 8.230 | 11.40 |
| 4231.64 | M52b | 0.009 | 7.084 | 19.20 |
| 4250.65c | M52b | 0.016 | 18.853 | 19.90 |
| 4397.99 | M57b | 0.024 | 7.174 | 6.56 |
| 4379.55d | M60b | 0.050 | 8.367 | |
| 4428.64e | M60c | 0.037 | 8.775 | 11.50 |
| 4430.94f | M61a | 0.025 | 9.158 | 12.10 |
| 4457.05c,g | M61d | 0.026 | 27.305 | 26.30 |
| 4413.22h | M65 | 0.021 | 9.099 | 12.90 |
| 4421.39 | M66c | 0.008 | 9.723 | |
| Sum | 0.364i | 8.425 | 9.93 | |
| Average | 8.476 | 9.77 | ||
- a
-
Neglecting the contribution from Ne ii M55e 4f 2[5] – 3d 4F9/2 4392.00.
- b
-
Neglecting the contribution from Ne ii M52a 4f 2[4] – 3d 4D7/2 4219.37.
- c
-
Not included in calculating the total intensity or the average abundance value.
- d
-
Neglecting the contribution from Ne ii M60b 4f 1[4] – 3d 2F7/2 4379.40.
- e
-
Neglecting the contribution from Ne ii M60c 4f 1[3] – 3d 2F5/2 4428.52.
- f
-
The contribution from Ne ii M57a 4f 1[2] – 3d 4F3/2 4430.90, which is about 30 per cent, has been subtracted. The contribution from Ne ii M57a 4f 1[2] – 3d 4F3/2 4431.11 is negligible.
- g
-
Including the contribution from the three Ne ii lines, M66c 4f 1[3] – 3d 4P5/2 4457.24, M61d 4f 2[2] – 3d 2D3/2 4457.24 and M66c 4f 1[3] – 3d 4P5/2 4457.36.
- h
-
Including the contribution from Ne ii M57c 4f 1[3] – 3d 4F3/2 4413.11. Neglecting Ne ii M65 4f 0[3] – 3d 4P5/2 4413.11.
- i
-
Excluding Ne ii M52b 4f 2[3] – 3d 4D3/2 4250.65 and Ne ii M61d 4f 2[2] – 3d 2D3/2 4457.05.
4.1.6 ORL abundances of other ions
Table 18 presents the recombination line C3+/H+, C4+/H+, N3+/H+, O3+/H+, and O4+/H+ abundances. The C3+/H+ abundance ratios are derived from the M1 4650, M16 4069 and M18 4187 multiplets. The abundances from the three multiplets agree with each other, and the adopted C3+/H+ ratio in NGC 7009 is an average from them. The C4+/H+ abundance ratio 2.2010-5 is derived from the C iv M8 4658 line, which is slightly contaminated by [Fe iii] 4658. This abundance agrees with those given by LSBC: 0.23910-4 (PA = 45o) and 0.18210-4 (PA = 0o).
The N3+/H+ abundance ratio is derived from N iii M18 4379. The N iii M17 lines, 3998.63 and 4003.58,72 are observed, but only the effective dielectronic recombination coefficients for this multiplet are available (Nussbaumer & Storey ns1984 1984). If we adopt the dielectronic data, the derived N3+/H+ abundance from the M17 multiplet will be more than one order of magnitude higher than that from the N iii M18 4379 line (Table 18). This indicates that the excitation of the N ii M17 lines is probably dominated by radiative recombination. We adopt the N3+/H+ ratio (1.3110-4) derived from the N ii M18 4379 line as the abundance in NGC 7009. This N3+/H+ abundance agrees with those given by LSBC who also used the 4379 line: 1.3410-4 (PA = 45o) and 1.7110-4 (PA = 0o). We observed the N iii M1 and M2 lines, which are excited by the secondary Bowen fluorescence mechanism. Also detected in the spectra of NGC 7009 are the N iii transitions with the 3Po parentage: M3 3p′ 4D – 3s′ 4Po, M6 3p′ 2D – 3s′ 2Po and M9 3d′ 4Fo – 3p′ 4D. Analyses of these lines are in Section 3.6.
Some strong O iii lines from the 3 – 3 arrays are excited by the fluorescence mechanism or radiative charge-transfer reaction of O3+ and H0 (Liu & Danziger 1993a ; Liu, Danziger & Murdin ldm93 1993). The O iii M14 3d 3Do – 3p 3P 3713 lines cannot be excited by fluorescence or charge-transfer reaction, but is likely to be excited only by recombination and therefore a useful abundance indicator for O3+/H+. Unfortunately, no recombination coefficients are available for this multiplet. The O iii M8 3d 3Fo – 3p 3D 3265 lines originate from radiative and dielectronic recombination (Liu & Danziger 1993a ), and the effective dielectronic and radiative recombination coefficients for this multiplet are available from Nussbaumer & Storey ns1984 (1984) and Péquignot, Petitjean & Boisson ppb1991 (1991), respectively. Thus the O3+/H+ abundances are derived from two of the O iii M8 lines 3260.85 and 3265.32, which are observed in NGC 7009 (Fig. 39). Another M8 line 3267.20 is blended with the 3265.32 line, which is expected to be the strongest in M8, but its contribution is probably negligible. The O3+/H+ abundance ratio derived from O iii M8 is about 6.610-5 (Table 18).
A very faint O iv line M2 3d 2D5/2 – 3p 2P 3411.69 is also observed to partially blended with O iii M15 3415.26 (Fig. 40). Another M2 line 3413.64 is blended in between. The other line 3403.52 is blended with O iii M15 3405.71 (Fig. 40), and its accurate measurements are difficult. Multi-Gaussian profile fits give an intensity of 0.0514 for the 3411.69 line, and 0.0567 for the 3413.64 line, both have an uncertainty of more than 20 per cent (Table in Paper I). The intensity ratio of the two lines differ from the pure LS coupling ratio, i.e. 9 : 1. We use 3411.69 to derive the O4+/H+ abundance ratio because its measurement is probably more reliable. Here the effective radiative and dielectronic recombination coefficients from Péquignot, Petitjean & Boisson ppb1991 (1991) and Nussbaumer & Storey ns1984 (1984), respectively, are used.
| Line | Mult. | C3+/H+ | |
| (Å) | (10-4) | ||
| 4647.42 | M1 | 0.170 | |
| 4650.25 | M1 | 0.100 | |
| 4651.47 | M1 | 0.034 | |
| M1 3p 3Po – 3s 3S | 0.304 | 1.659 | |
| 4067.94 | M16 | 0.071 | |
| 4068.91 | M16 | 0.093 | |
| 4070.26 | M16 | 0.120 | |
| M16 5g 3G – 4f 3Fo | 0.284 | 1.472 | |
| M18 5g 1G – 4f 1Fo | 4186.90 | 0.088 | 1.309 |
| Wavelength | Mult. | C4+/H+ | |
| (Å) | (10-4) | ||
| M8 6h 2Ho – 5g 2G | 4658.30a | 0.147 | 0.220 |
| Wavelength | Mult. | N3+/H+ | |
| (Å) | (10-4) | ||
| 3998.63 | M17 | 0.025 | |
| 4003.58b | M17 | 0.040 | |
| M17 5f 2Fo – 4d 2D | 0.065 | 12.390 | |
| M18 5g 2G – 4f 2Fo | 4379.11 | 0.310 | 1.313 |
| Wavelength | Mult. | O3+/H+ | |
| (Å) | (10-4) | ||
| 3260.85 | M8 | 0.179 | |
| 3265.32 | M8 | 0.139 | |
| M8 3d 3Fo – 3p 3D | 0.324 | 0.659 | |
| Wavelength | Mult. | O4+/H+ | |
| (Å) | (10-4) | ||
| 3411.69c | M2 | 0.057 | |
| M2 3d 2D – 3p 2Po | 0.114 | 0.158 |
- a
-
Including [Fe iii] 4658.05.
- b
-
Including N iii M17 4003.72 (5f 2F – 4d 2D5/2).
- c
-
Could be of large uncertainty due to line blending.
The adopted C, N, O and Ne ionic abundances from optical recombination lines are summarized in Table 19. They are mostly averaged from the abundance ratios that are calculated by co-adding the line intensities of individual multiplets (or transition arrays). Atomic data references used for the ORL analysis are listed in Table 21.
| Ion | Abundances | |
|---|---|---|
| (10-4) | [Xi+/H+]+12 | |
| C2+/H+ | 6.865 | 8.796 |
| C3+/H+ | 1.480 | 8.170 |
| C4+/H+ | 0.220 | 7.342 |
| N2+/H+ | 3.450 | 8.538 |
| N3+/H+ | 1.313 | 8.118 |
| O2+/H+ | 14.176 | 9.152 |
| O3+/H+ | 0.659 | 7.819 |
| O4+/H+ | 0.158 | 7.198 |
| Ne2+/H+ | 8.425 | 8.926 |
Several permitted lines emitted by silicon ions were observed or deblended (Paper I). As the first and the second ionization potentials of atomic silicon are 8.15 and 16.35 eV, respectively, we expect that the main ionization stages of silicon are doubly and triply ionized, while the amount of Si+ is assumed to be negligible and Si4+ should exist but is of much lower abundance compared to Si2+ and Si3+.
The Si3+/H+ abundance ratios derived from Si iii M2 and M5 lines are presented in Table 20. The Si iv M1 4116.10 line is also observed (Fig. 47), which means that 4088.86 of the same multiplet should also exist. Since only the effective dielectronic recombination coefficients for a few selected Si iii transitions are available from Nussbaumer & Storey ns1986 (1986), we only present the Si3+/H+ abundance ratios. The averaged Si3+/H+ ratio is 6.0410-6.
The Mg ii M4 4481 line is observed (Fig. 35), and the Mg2+/H+ abundance derived is presented in Table 20. Since the ionization potentials of neutral Mg0 and Mg2+ are 7.65 and 80.14 eV, respectively, we assume that magnesium in NGC 7009 is mainly doubly ionized. Unfortunately no effective recombination coefficients for Mg ii lines are available. Given the similarity between the atomic structure of Mg ii and C ii, we assumed that the effective recombination coefficient of the Mg ii M4 4f 2Fo – 3d 2D 4481 line is equal to, or at least is close to, that of the C ii M6 4f 2Fo – 3d 2D 4267 transition. The effective recombination coefficient (in Case B) for the C ii 4267 line is adopted from Bastin bastin2006 (2006), with the assumption of = 10 000 K and = 10 000 cm-3. The calculation of Davey, Storey & Kisielius davey2000 (2000) differs from that of Bastin bastin2006 (2006) by 1.5 per cent for the C ii 4267 line. The Mg2+/H+ abundance derived from the 4481 line is 3.1810-5.
| Line | Mult. | Si3+/H+ | |
|---|---|---|---|
| (Å) | (10-5) | ||
| 4552.62 | M2 | 0.0175 | |
| 4567.82 | M2 | 0.0114 | |
| 4574.76 | M2 | 0.0041 | |
| M2 4p 3Po – 4s 3S | 0.0325 | 0.770 | |
| 3806.54 | M5 | 0.022 | |
| M5 4d 3D – 4p 3Po | 0.0396 | 0.438 | |
| Wavelength | Mult. | Mg2+/H+ | |
| (Å) | (10-5) | ||
| 4481.20a | M4 | 0.0303 | |
| M4 4f 2Fo – 3d 2D | 0.0309 | 3.179 |
- a
-
We assume that the Mg ii 4f – 3d 4481 line has an effective recombination coefficient equal to that of the C ii 4f – 3d 4267 line, given the similarity between the atomic structure of Mg ii and C ii.
| ion | ORLs | |
|---|---|---|
| Effec.recomb. coefficients | Comments | |
| H i | Storey & Hummer sh1995 (1995) | Case B |
| He i | Benjamin, Skillman & Smits bss99 (1999) | Case B; singlets |
| Brocklehurst b72 (1972) | Case A; triplets | |
| He ii | Storey & Hummer sh1995 (1995) | Case B |
| C i | Escalante & Victor ev1990 (1990) | Case A; singlets |
| Escalante & Victor ev1990 (1990) | Case B; triplets | |
| C ii | Davey, Storey & Kisielius davey2000 (2000) | Case B |
| C iii | Péquignot, Petitjean & Boisson ppb1991 (1991) | Case A |
| Nussbaumer & Storey ns1984 (1984) | Dielectronic recombination | |
| C iv | Péquignot, Petitjean & Boisson ppb1991 (1991) | Case A |
| N i | Péquignot, Petitjean & Boisson ppb1991 (1991) | Case A; doublets |
| Péquignot, Petitjean & Boisson ppb1991 (1991) | Case B; quartets | |
| N ii | FSL11 | Case B |
| N iii | Péquignot, Petitjean & Boisson ppb1991 (1991) | Case A |
| Nussbaumer & Storey ns1984 (1984) | Dielectronic recombination | |
| O i | Péquignot, Petitjean & Boisson ppb1991 (1991) | Case A |
| O ii | P. J. Storey (PJS, private communication) | Case B |
| O iii | Péquignot, Petitjean & Boisson ppb1991 (1991) | Case A |
| O iv | Péquignot, Petitjean & Boisson ppb1991 (1991) | Case A |
| Nussbaumer & Storey ns1984 (1984) | Dielectronic recombination | |
| Ne ii | Kisielius et al. kisielius1998 (1998) | Case B; doublets |
| Storey (unpublished) | Case A; quartets | |
| Nussbaumer & Storey ns1987 (1987) | Dielectronic recombination | |
| Mg ii | Davey, Storey & Kisielius davey2000 (2000)a | Case B |
| Si ii | Nussbaumer & Storey ns1986 (1986) | Dielectronic recombination |
| Si iii | Nussbaumer & Storey ns1986 (1986) | Dielectronic recombination |
- a
-
Given the similarity between the atomic structure of Mg ii and C ii, we have assumed that the Mg ii M4 4f 2Fo – 3d 2D 4481 line has an effective recombination coefficient equal to that of the C ii M6 4f 2Fo – 3d 2D 4267 line (Zhang et al. 2005b ).
4.2 Ionic abundances from CELs
4.2.1 Ionic abundances from the optical CELs
The ionic abundances derived from optical CELs detected in the spectrum of NGC 7009 are presented in Table 22. An electron temperature of 10 000 K, which is an average from different CEL diagnostic ratios (Paper I), and a constant density of 4300 cm-3, an average derived from a variety of optical CEL ratios, are assumed throughout the abundance determinations. In addition to the ionic abundances of N, O and Ne, abundances are also derived for the ions of F, Mg, Si, S, Cl, Ar from the CELs detected in the spectrum of NGC 7009. The atomic data references used for CEL analysis are listed in Table 23.
| Lines | Xi+/H+ | Abundances | |||
|---|---|---|---|---|---|
| Ions | Lines (Å) | Xi+/H+ | [Xi+/H+]+12 | ||
| C i | 9824.13,9850.26 | 0.035 | C0/H+ | 8.48310-9 | 3.929 |
| N i | 5197.90,5200.26 | 0.091 | N0/H+ | 8.43510-8 | 4.926 |
| O i | 6300.30,6363.78 | 0.740 | O0/H+ | 8.39510-7 | 5.924 |
| N ii | 5754.64 | 0.390 | N+/H+ | 2.87610-6 | 6.459 |
| N ii | 6548.04,6583.46 | 20.600 | N+/H+ | 2.72510-6 | 6.435 |
| O ii | 3726.03,3728.81 | 19.971 | O+/H+ | 8.77910-6 | 6.943 |
| O ii | 7319.99,7330.73 | 2.300 | O+/H+ | 1.99610-5 | 7.300 |
| O iii | 4363.21 | 7.300 | O2+/H+ | 2.43510-4 | 8.387 |
| O iii | 4931.23 | 0.120 | O2+/H+ | 2.45510-4 | 8.390 |
| O iii | 4958.91,5006.84 | 1550.753 | O2+/H+ | 3.23110-4 | 8.509 |
| F ii | 4789.45 | 0.017 | F+/F+ | 2.57910-8 | 4.411 |
| F iv | 4059.90 | 0.012 | F3+/F+ | 4.38710-9 | 3.642 |
| Ne iii | 3342.50 | 0.755 | Ne2+/H+ | 3.07910-4 | 8.488 |
| Ne iii | 3868.76 | 118.837 | Ne2+/H+ | 1.29610-4 | 7.928 |
| Ne iii | 4012.01 | 0.014 | Ne2+/H+ | 2.16110-4 | 8.335 |
| Ne iv | 4724.17,4725.67 | 0.042 | Ne3+/H+ | 1.50110-5 | 7.176 |
| Ne iv | 4714.17,4715.66 | 0.067 | Ne3+/H+ | 3.84510-5 | 7.585 |
| S ii | 4068.60,4076.35 | 0.960 | S+/H+ | 1.08510-7 | 5.035 |
| S ii | 6716.44,6730.82 | 3.700 | S+/H+ | 1.19210-7 | 5.076 |
| S iii | 3721.69 | 1.045 | S2+/H+ | 2.78110-6 | 6.444 |
| S iii | 6312.10 | 1.400 | S2+/H+ | 2.26510-6 | 6.355 |
| S iii | 9068.60,9530.60 | 64.000 | S2+/H+ | 1.96510-6 | 6.293 |
| Cl ii | 6161.84 | 0.006 | Cl+/H+ | 3.43410-8 | 4.536 |
| Cl ii | 8578.69,9123.60 | 0.075 | Cl+/H+ | 4.99410-9 | 3.698 |
| Cl iii | 3353.17 | 0.076 | Cl2+/H+ | 1.38810-7 | 5.142 |
| Cl iii | 5517.72,5537.89 | 1.000 | Cl2+/H+ | 5.51310-8 | 4.741 |
| Cl iii | 8480.85 | 0.020 | Cl2+/H+ | 8.31910-8 | 4.920 |
| Cl iv | 5323.28 | 0.012 | Cl3+/H+ | 2.52510-8 | 4.402 |
| Cl iv | 7530.80,8045.63 | 0.990 | Cl3+/H+ | 5.47510-8 | 4.738 |
| Ar iii | 3109.17 | 0.175 | Ar2+/H+ | 5.95610-7 | 5.775 |
| Ar iii | 5191.82 | 0.100 | Ar2+/H+ | 8.58410-7 | 5.934 |
| Ar iii | 7135.80,7751.10 | 18.300 | Ar2+/H+ | 1.02710-6 | 6.012 |
| Ar iv | 4711.37,4740.17 | 7.600 | Ar3+/H+ | 5.59210-7 | 5.748 |
| Ar iv | 7237.40,7262.76 | 0.372 | Ar3+/H+ | 2.71310-6 | 6.433 |
| Ar v | 6435.10,7005.67 | 0.065 | Ar4+/H+ | 6.65410-9 | 3.823 |
| K iv | 6101.83,6795.10 | 0.196 | K3+/H+ | 1.14610-8 | 4.059 |
| ion | CELs | |
|---|---|---|
| Transition probabilities | Collision strengths | |
| C ii | Nussbaumer & Storey 1981a | Blum & Pradhan bp1992 (1992) |
| C iii | Keenan et al. keenan1992 (1992) | Keenan et al. keenan1992 (1992) |
| Fleming et al. fleming1996 (1996) | ||
| C iv | Wiese et al. wiese1966 (1966) | Gau & Henry gh1977 (1977) |
| N i | Zeippen zeippen1982 (1982) | Berrington & Burke bb1981 (1981) |
| N ii | Nussbaumer & Rusca nr1979 (1979) | Stafford et al. stafford1994 (1994) |
| O i | Baluja & Zeippen bz1988 (1988) | Berrington berrington1988 (1988) |
| Berrington & Burke bb1981 (1981) | ||
| O ii | Zeippen zeippen1982 (1982) | Pradhan pradhan1976 (1976) |
| O iii | Nussbaumer & Storey 1981b | Aggarwal aggarwal1983 (1983) |
| F ii | Baluja & Zeippen bz1988 (1988) | Butler & Zeippen bz1994 (1994) |
| F iv | Fischer & Saha fs1985 (1985) | Lennon & Burke lb1994 (1994) |
| Ne ii | Mendoza mendoza1983 (1983) | Bayes et al. bayes1985 (1985) |
| Ne iii | Mendoza mendoza1983 (1983) | Butler & Zeippen bz1994 (1994) |
| Ne iv | Zeippen zeippen1982 (1982) | Giles giles1981 (1981) |
| Ne v | Fischer & Saha fs1985 (1985) | Lennon & Burke lb1994 (1994) |
| S ii | Mendoza & Zeippen 1982b | Keenan et al. keenan1996 (1996) |
| Keenan et al. keenan1993 (1993) | ||
| S iii | Mendoza & Zeippen 1982a | Mendoza mendoza1983 (1983) |
| S iv | Storey (unpublished) | Saraph & Storey ss1999 (1999) |
| Cl ii | Mendoza mendoza1983 (1983) | Mendoza mendoza1983 (1983) |
| Cl iii | Mendoza mendoza1983 (1983) | Mendoza mendoza1983 (1983) |
| Cl iv | Mendoza & Zeippen 1982b | Butler & Zeippen bz1989 (1989) |
| Ar ii | Pelan & Berrington pb1995 (1995) | Vujnovic & Wiese vw1992 (1992) |
| Ar iii | Mendoza & Zeippen mz1983 (1983) | Johnson & Kingston jk1990 (1990) |
| Ar iv | Mendoza & Zeippen 1982b | Zeippen et al. zeippen1987 (1987) |
| Ar v | Mendoza & Zeippen 1982a | Mendoza mendoza1983 (1983) |
| Fe iii | Nahar & Pradhan np1996 (1996) | Zhang zhang1996 (1996) |
| Fe iv | Garstang garstang1958 (1958) | Zhang & Pradhan zp1997 (1997) |
| Fischer & Rubin fr2004 (2004) | ||
| Fe v | Berrington berrington1995 (1995) | |
| Fe vi | Nussbaumer & Storey ns1978 (1978) | Nussbaumer & Storey ns1978 (1978) |
| Fe vii | Nussbaumer & Storey 1982a | Keenan & Norrington kn1987 (1987) |
| Berrington et al. berrington2000 (2000) | ||
4.2.2 Ionic abundances from the IR and UV CELs
NGC 7009 has been observed in wavelength range other than optical: the IUE Short Wavelength Prime (SWP) and Long Wavelength Redundant (LWR) observations by Perinotto & Benvenuti pb1981 (1981), the IRAS Low Resolution Spectrometer (LRS) observations by Pottasch et al. pottasch1986 (1986), the ISO Short Wavelength Spectrometer (SWS) and Long Wavelength Spectrometer (LWS) observations by Liu et al. 2001a , and the Kuiper Airborne Observatory (KAO) observations by Rubin et al. rubin1997 (1997). Ionic abundances derived from ten near- to far-infrared lines and seven ultraviolet lines are presented in Table 24.
The dereddened and normalized intensities of three infrared lines, the [Ne ii] 12.8m and the [Ne iii] 15.5 and 36.0m, are adopted from LLB01. The Ne+/H+ abundance ratio is derived from the [Ne ii] 12.8m line, assuming a temperature of 10 020 K and a density of 4300 cm-3. The derived Ne+/H+ ratio is 1.3210-5, which agrees with 1.3810-5 given by LLB01, as is expected. The critical densities of the [Ne iii] 3P1 and 3P0 levels are 2.1105 and 3.1104 cm-3 (at = 10 000 K; Osterbrock & Ferland of2006 2006), respectively, much larger than the average electron density. The Ne2+/H+ abundance ratios deduced from the [Ne iii] 15.5 and 36m lines are 1.6710-4 and 1.4810-4, respectively. The two ratio values agree with each other within errors. We adopt a value of 1.6510-4, which is derived from the sum of the intensities of the two [Ne iii] infrared (IR) fine-structure lines, as the Ne2+/H+ ratio in NGC 7009. It agrees with the value of 1.6310-4 given by LLB01. An electron temperature of K and a density of 3930 cm-3 were assumed in LLB01.
The observed line fluxes, in units of erg cm-2 s-1, of the [N iii] 57m and the [O iii] 52 and 88m fine-structure lines are adopted from Liu et al. 2001a . These fluxes were normalized using the observed total H flux, 10-9.63 erg cm-2 s-1. The extinction of the three IR lines, as pointed out by Liu et al. 2001a , should be negligible. Since the critical density of the [N iii] 2P level is 1.5103 cm-3, comparable to the density of NGC 7009, we have assumed a density of cm-3, deduced from the [O iii] 52m/88m line ratio, in deriving the N2+/H+ abundance ratio from the [N iii] 57m line. Here an electron temperature of 10 020 K is again assumed. The derived N2+/H+ ratio is 4.9710-5, in close agreement with 4.9110-5 given by Liu et al. 2001a .
The O2+/H+ abundance ratios derived from the [O iii] 52 and 88m lines are 2.7910-4 and 2.7610-4, respectively. Here an electron temperature of 9800 K derived from the [O iii] 4959/4363 ratio, and a density of 1260 cm-3 derived from the [O iii] 52m/88m ratio, were assumed. Given that the critical densities of the [O iii] 3P1 and 3P2 fine-structure levels are 5.1102 and 3.6103 cm-3, respectively (Osterbrock & Ferland of2006 2006), the density value of 1260 cm-3 for the O iii IR-line abundances is appropriate. We adopt a value of 2.9910-4, which is derived from the sum of the two [O iii] IR lines, as the O2+/H+ abundance ratio in NGC 7009. This abundance ratio agrees well with the value of 2.9610-4 given by Liu et al. 2001a .
The flux of the [O iv] 25.9m line were estimated from the ([O iv] 25.9m)/([S iii] 18.7m) flux ratio given by Rubin et al. rubin1997 (1997), who obtained far-IR observations of the PNe NGC 7009, NGC 7027 and NGC 6210 with the Kuiper Airborne Observatory (KAO). The ISO SWS observations by X.-W. Liu (unpublished) during the ISO Orbit in 1996 gives the ([O iv] 25.9m)/([S iii] 18.7m) ratio that differs from that of Rubin et al. rubin1997 (1997) by more than 30 per cent. The O4+/H+ abundance ratio derived from the above two observations are given in Table 24. Here the flux of the [S iii] 18.7m line was adopted from Pottasch et al. pottasch1986 (1986).
The IRAS fluxes (in units of erg cm-2 s-1) of the [Ne v] 14.3m, the [S iii] 18.7m and the [S iv] 10.52m lines, as well as the total flux of H, are adopted from Pottasch et al. pottasch1986 (1986). The Ne4+/H+ abundance ratio derived from the [Ne v] 14.3m line is 6.1110-7. Here an electron temperature of 10 020 K is assumed. The critical densities for the [Ne v] 3P1 and 3P2 fine-structure levels are 6.2103 and 3.5104 cm (Osterbrock & Ferland of2006 2006), respectively. Thus the electron density of 1260 cm-3 from the [O iii] 52m/88m ratio is again assumed. If we adopt a density value of 4300 cm-3, the derived Ne4+/H+ abundance ratio slightly increases to 6.8710-7.
The S2+/H+ abundance ratio derived from the [S iii] 18.7m line is 8.3610-7. Here an electron temperature of 10 020 K and a density of 1260 cm-3 are assumed. Since the critical densities of the [S iii] 3P1 and 3P2 fine-structure levels are 1.98103 and 1.54104 cm-3, respectively, a density of 1260 cm-3 is reasonable. If we increase the density value to 4300 cm-3, the S2+/H+ ratio derived then increases to 9.9310. The S3+/H+ abundance ratio derived from the [S iv] 10.52m line is 7.3410-6. The same temperature is assumed.
The observed fluxes (in unit of erg cm-2 s-1) for the seven ultraviolet (UV) lines in Table 24 are adopted from Perinotto & Benvenuti pb1981 (1981). The fluxes are normalized using their H flux, which should be multiplied by a factor 0.48, the fraction of the H flux entering into the IUE slot in position of SWP and LWR images. Using the logarithmic reddening constant = 0.174 derived in Paper I and the extinction curve of Howarth howarth1983 (1983), we derived the dereddened intensities of those UV lines. The ionic abundances are presented in Table 24. Here an electron temperature of 10 020 K and a density of 4300 cm-3 are assumed in the abundance calculations.
| Ions | Lines | Xi+/H+ | (Xi+/H+)+12 | Ref. | ||
| IR Lines | ||||||
| N iii | 57 m | 24.315 | N2+/H+ | 4.97410-5 | 8.065 | (1) |
| O iii | 52 m | 165.940 | O2+/H+ | 2.79210-4 | 8.446 | (1) |
| O iii | 88 m | 55.029 | O2+/H+ | 2.76210-4 | 8.441 | (1) |
| O iv | 25.9 m | 20.291.10 | O3+/H+ | 1.27510-5 | 7.105 | (2)a |
| O iv | 25.9 m | 14.160.76 | O3+/H+ | 8.89310-6 | 6.950 | (2)b |
| Ne ii | 12.8 m | 9.93.0 | Ne+/H+ | 1.32210-5 | 7.121 | (3) |
| Ne iii | 15.5 m | 25012 | Ne+/H+ | 1.66710-4 | 8.222 | (3) |
| Ne iii | 36.0 m | 18.01.8 | Ne2+/H+ | 1.47710-4 | 8.169 | (3) |
| Ne v | 14.3 m | 8.696 | Ne4+/H+ | 6.10710-7 | 5.786 | (4) |
| S iii | 18.7 m | 7.826 | S2+/H+ | 8.35610-7 | 5.922 | (4) |
| S iv | 10.52 m | 230.434 | S3+/H+ | 7.34210-6 | 6.866 | (4) |
| UV Lines (Å) | ||||||
| C ii | 2326 | 3.821 | C+/H+ | 4.55510-6 | 5.629 | (5) |
| C iii | 1908 | 44.832 | C2+/H+ | 1.30810-4 | 8.117 | (5) |
| N iii | 1751 | 6.959 | N2+/H+ | 5.53510-5 | 7.743 | (5) |
| N iv | 1486 | 6.197 | N3+/H+ | 6.15110-5 | 7.789 | (5) |
| O iii | 1663 | 4.313 | O2+/H+ | 2.38710-4 | 8.378 | (5) |
| O iv | 1403 | 0.705 | O3+/H+ | 3.97710-5 | 7.600 | (5) |
| Ne iv | 2424 | 7.789 | Ne3+/H+ | 1.89510-5 | 7.278 | (5) |
- (1)
-
The observed flux is from Liu et al. 2001a .
- (2)a
-
The observed flux is estimated from the flux ratio ([O iv] 25.9m)/([S iii] 18.7m) adopted from the ISO/LWS observations during ISO 344 Orbit in 1996 (Liu et al., unpublished), using the [S iii] 18.7m flux adopted from Pottasch et al. pottasch1986 (1986).
- (2)b
- (3)
-
The observed flux is from LLB01.
- (4)
-
The observed flux is from Pottasch et al. pottasch1986 (1986).
- (5)
-
The observed flux is from Perinotto & Benvenuti pb1981 (1981).
4.3 Comparison of the ORL and CEL abundances
4.3.1 Ionic abundances
In Fig. 41, the ionic abundances of C, N, O and Ne derived from ORLs are compared with the corresponding values derived from the optical, UV and far-IR CELs. Here the ionic abundances of C, N, O and Ne derived from ORLs are from Table 19, and the ionic abundances derived from CELs are from Tables 22 (optical) and 24 (UV and IR). The IR fine-structure line fluxes are adopted from the recent ISO observations (Liu et al. 2001a ). We also make use of the IR line fluxes from observations of IRAS in the literature. The UV line fluxes from the IUE observations are dereddened using the extinction derived in Paper I, and they are used to derive ionic abundances for highly ionized heavy elemental ions. The recombination line C2+/H+, N2+/H+, O2+/H+ and Ne2+/H+ abundances are all higher than the abundance ratios derived from CELs by nearly a factor of 5 (i.e. ADF5), in agreement with what was observed by LSBC (for C, N and O) and LLB01 (for Ne). However, the ADF differs from 5 when the abundances derived from UV CELs are used: The N3+/H+ abundance derived from ORL is higher than the value derived from the N iv 1486 UV line by a factor of 2. The recombination line O3+/H+ abundance is higher than the abundance derived from the O iv 1403 UV line by only 65 per cent. This is probably mainly due to systematic difference in flux calibrations, given that the UV data are adopted from the early IUE observations of Perinotto & Benvenuti pb1981 (1981). The ADF value of O3+ is close to 5 when the abundance derived from the [O iv] 25.9m IR line is used.
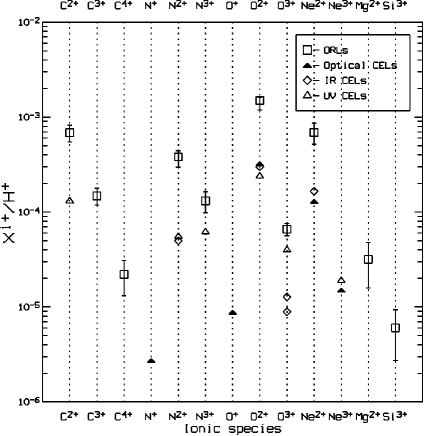
4.3.2 Total elemental abundances
Elemental abundances derived from ORLs and CELs are compared in Table 25. Abundance errors (numbers in brackets) are estimated from measurement uncertainties, which is calculated by quadratically adding line flux errors from Gaussian profile fitting and the systematic uncertainties in line measurements e.g. subtraction of the continuum. Uncertainties introduced by ionization correction method, i.e. the ionization correction factors (’s), are not taken into account in error estimate. Also given in this table are the solar abundances from Asplund et al. asplund09 (2009) and average abundances of the Galactic disc and bulge PNe from literature. The C/H, N/H, O/H and Ne/H elemental abundances derived from ORLs are higher than the corresponding values derived from CELs by a factor of 5.4, 6.9, 4.7 and 5.3, respectively. This result is similar to LSBC, who derived ADF values of 6.1, 4.1 and 4.7 for C, N and O respectively in NGC 7009. The Ne abundance discrepancy derived by LLB01 is about 4. In the analyses of LSBC, the elemental abundances of C and N derived from CELs were adopted from the earlier observations of Barker barker1983 (1983), who first discussed the large discrepancy between the C2+/H+ abundances derived from the C ii 4267 recombination line and from the UV CEL C iii 1907, 1909.
Whenever available, the ionization correction factors (’s) given by Kingsburg & Barlow kb1994 (1994) were used. In Section 4.2.2, we have derived 16 ionic abundances from UV and IR data available from the literature (Table 24). These ionic abundances can be used as an aid to derive total elemental abundances. When they are not necessary, we can use them to check the elemental abundance values derived from ’s, by adding these UV and IR abundances with the optical abundance ratios in Table 22 and compare with the ionization corrected total abundances.
The forbidden line O/H abundance ratio was calculated from the O+/H+ ratio derived from the [O ii] 3726 and 3729 lines666Recombination excitation of the [O ii] 3726, 3729 doublet is neglected. Given the small ionic concentration of O+, compared to O2+, the errors introduced to the total O/H elemental abundances deduced below, both from CELs and from ORLs, should be negligible. and the O2+/H+ ratio derived from the [O iii] 4959 and 5007 lines, correcting for the unseen O3+ in optical using
| (1) |
From the He+ and He2+ abundances given in Table 10, we have = 1.086. Thus derived O/H ratio is 3.60310-4, close to the value 3.71610-4, which is derived by combining the O ions from UV, IR and optical lines, O/H = O+/H+ + O2+/H+ + O3+/H+. Here the O3+/H+ is derived from the O iv 1403 UV line (Section 4.2.2).
The recombination line abundance O+/H+ is not available, thus in order to make use of the above equation, we assume that the recombination line O+/O2+ ratio is the same as that derived from the CELs. Given the small ionic concentration of O+ (less than 10 per cent in NGC 7009), the errors introduced should be negligible. The O2+/H+, O3+/H+ and O4+/H+ abundance ratios derived from ORLs are available from Table 19. The recombination line O/H abundance ratio thus derived is 1.66710-3.
Both C2+/H+ and C3+/H+ abundance ratios have been derived from ORLs and are presented in Table 19. The C4+/H+ abundance ratio has also been derived from the C iv M8 4658.30 line, but probably is not acceptable because it blends with [Fe iii] 4658.05. The unseen C+/H+ are corrected for using the equation of LSBC,
| (2) |
and
| (3) |
The ionic abundances of O+ and O2+ in the above equation are assumed to be those derived from the forbidden line measurements. In NGC 7009, most of the carbon should exist in the form of C2+ and C3+, and the correction required for unobserved C+ and C4+ is quite small. The Equation 3 gives = 1.07. Thus derived recombination line C/H abundance ratio is 8.93210-4, which is only 3 per cent lower than the value given by LSBC.
For the collisionally excited lines, C+/H+ and C2+/H+ are derived from UV lines (Table 24). We assume C3+/C2+ = 0.216, as given by the ORL abundance ratios. Thus the CEL ratio of carbon is C/H = C+/H+ + C2+/H+ + C3+/H+, which is 1.63610-4.
Recombination line abundances are available for the N2+/H+ and N3+/H+ ratios (Table 19) but not for N+/H+. The latter is available from the collisionally excited [N ii] 6548 and 6584 lines. The N2+/H+ ratio derived from the UV collisionally excited N iii 1751 line is about 10 per cent higher than that deduced from the [N iii] 57 m far-IR fine-structure line (Table 24). Given the weakness of the 1751 and the relative new observations of the 75 m line, we adopt the N2+/H+ abundance ratio derived from the far-IR line. N2+/H+ from the 57 m and N+/H+ from the 6548 and 6584 lines yield N+/N2+ = 0.0548. We assume that this is also valid for corresponding abundances derived from ORLs. The N iv optical recombination lines are not clearly detected in the spectrum of NGC 7009, but the we detected the O iv M2 3d 2D – 3p 2Po 3412 line, and the O4+/H+ abundance ratio is derived from it (Table 18). Given the ionization potential of N3+ (77.472 eV) is the same to that of O3+ (77.4 eV), we assume N4+/N = O4+/O. Thus the total recombination line N/H abundance is given by
| (4) |
To obtain the forbidden-line N/H abundance, we correct for the unseen N3+/H+ assuming N3+/N2+ = 0.380, as given by ORLs. so that
| (5) |
The total CEL N/H abundance thus derived is 7.0110-5. Here the N4+/H+ is neglected, given its very low abundance, if we assume that the N4+/N2+ ratio from CELs is the same as that given by the ORL values. If we take into account the N3+/H+ abundance ratio derived from the UV N iv 1486 line (Table 24), the total CEL abundance ratio is then N/H = N+/H+ + N2+/H+ + N3+/H+ = 1.14010-4, which is 64 per cent higher than the value derived by the ionization correction Equation 5. Since the recent IR data should be more reliable, we adopt the ratio derived from Equation 5.
Ne+/H+, Ne2+/H+ and Ne3+/H+ ionic abundances are available from IR (Table 24) and optical CELs (Table 22). For the Ne2+/H+ ratio, we adopt the abundance derived from the [Ne iii] 3868777Another [Ne iii] nebular line 3967 is saturated in the higher resolution spectrum, and is not saturated but blended with the H i 3970 line in the low-resolution spectrum. optical line, which is only about 21 per cent lower than that derived from the ISO SWS observation of the [Ne iii] 15.5+36 m IR fine-structure lines. For the Ne3+/H+ ratio, we adopt the value derived from the [Ne iv] 4724.17 and 4725.67 optical lines. From the IUE observation by Perinotto & Benvenuti pb1981 (1981), we also derived the Ne3+/H+ abundance ratio from their observed Ne iv 2422 and 2424 lines (Table 24), which is 26 per cent higher than that from optical. Thus the CEL Ne/H ratio obtained from the equation
| (6) |
is 1.57810-4 (Table 25). This is only 9 per cent lower than the Ne/H ratio derived by LLB01.
Only the Ne2+/H+ ratio is available from ORLs. The Ne+/Ne2+ ratio from CELs is 0.102, with and Ne3+/Ne2+ from optical CELs is 0.116. Assuming these ionization ratios from CELs are the same as given by ORLs, we obtain a recombination line Ne/H abundance ratio value of 8.39810-4 by using
| (7) |
This ratio value is 21 per cent higher than that given by LLB01.
CELs emitted by [F ii] and [F iv] ions are detected, with the F+/H+ and F3+/H+ abundance ratios derived from the [F ii] 4789 and [F iv] 4060 lines respectively (Table 22). O+ has ionization potential comparable to F+ and Ne3+ has that comparable to F3+. Zhang & Liu zl2005 (2005) suggested that F/O = F2+/O2+ for low-excitation PNe, and F/O = (F3+/Ne3+)(Ne/O) for high-excitation PNe. Here we adopt the assumption of Zhang & Liu zl2005 (2005). Given that NGC 7009 is a medium excitation PN, we derive the Ne2+/H+ abundance ratio from the equation
| (8) |
The derived F/H abundance ratio is 2.92310-7. The F4+/H+ should be negligible because the ionization potential of F3+ is 87 eV, which is too high. No recombination line from the fluorine ions are detected.
For the elements heavier than Ne, we detected CELs emitted by S, Cl, Ar and K ions (Table 22), and ORLs by Si and Mg ions (Table 20). Considering that the first ionization potential of silicon atom is only 8.2 eV, and the ionization potential of Si4+ is 166.8 eV, which is a huge jump from that of Si3+, 45 eV, we assume that the S+/H+ abundance is negligible, and the main ionization stages of Si in NGC 7009 are Si2+, Si3+ and Si4+. Several Si iii multiplets and the Si iv multiplet V1 are detected from NGC 7009. Only effective dielectronic recombination coefficients for Si iii multiplets are available from Nussbaumer & Storey ns1984 (1984), thus only the S3+/H+ abundance ratio from S iii ORLs is derived. The S3+/H+ ratio is derived from the Si iii multiplets M2 4p 3Po – 4s 3S and M5 4d 3D – 4p 3Po (Table 20). Since the ionization potential of S+ (16.3 eV) is close to that of F (17.4 eV), and the ionization potential of Si3+ (45 eV) is comparable to that of N2+ (47.4 eV), we assume the relation: Si2+/Si = F+/F = O+/O, and Si4+/Si = N3+/N. Thus the total Si/H abundance ratio from ORLs can be derived from the equation
| (9) |
The Si/H abundance ratio thus derived is 8.27810-6. In Equation 9, the O+/O ratio is from optical CELs, and the N3+/N ratio is from ORLs.
The Mg2+/H+ abundance ratio is derived from the Mg ii M4 4f 2Fo – 3d 2D 4481 line. The ionization potentials of Mg0 and Mg2+ are 7.65 eV and 80.1 eV, respectively, thus we assume that magnesium in NGC 7009 are mainly doubly ionized, and Mg+ and Mg3+ are negligible. No effective recombination coefficients for Mg ii lines are available. Given the similarity between the atomic structure of Mg ii and C ii, we assume that the Mg ii 4481 line has an effective recombination coefficient equal to that of C ii M6 4267. Thus we have Mg/H = Mg2+/H+.
For S, we have S+/H+ derived from the [S ii] 6716 and 6731 optical lines, S2+/H+ derived from the [S iii] 6312 optical line. The S2+/H+ is also available from the [S iii] 18.7 m IR line. S3+/H+ is derived from the [S iv] 10.5m far-IR fine-structure line, which was adopted from the IRAS observations by Pottasch et al. pottasch1986 (1986). We use the S2+/H+ ratio derived from the 6312 line. S4+ is not observed. Since S3+ has an ionization potential of 47.3 eV, very close to the value of 47.4 eV for N2+, we assume that S4+/S = N3+/N. The N3+/N ratio is from ORLs. Thus the S/H ratio is obtained from
| (10) |
The derived S/H ratio is 1.29910-5. If we adopt the S2+/H+ ratio derived from the [S iii] 18.7 m IR line, then the S/H ratio is 1.1010-5, about 15 per cent lower than the case when we adopt the optical value.
The Cl+/H+, Cl2+/H+, and Cl3+/H+ abundances are derived from optical CELs (Table 22). Given that the ionization potential of Cl3+ (53.5 eV)is similar to that of He+ (54.4 eV), and that the ionization potential of Cl4+ (67.7 eV) is comparable to that of Ne2+ (63.5 eV), we assumed Cl4+/Cl = He2+/He = 0.013/0.112 = 0.116 and Cl5+/Cl = Ne3+/Ne = 0.095. Here the Ne3+/Ne ratio is from the CEL abundances. Thus the Cl/H abundance ratio can be obtained from the equation
| (11) |
The derived total Cl/H abundance is 1.92710-7.
Ar2+/H+ is derived from the [Ar iii] 7136 and 7751 lines, Ar3+/H+ is from [Ar iv] 4711 and 4740, and Ar4+/H+ is from the [Ar v] 6435 and 7006 lines (Table 22). The unseen Ar+ is corrected for assuming Ar+/Ar = N+/N, where the N+/N is derived from optical CELs. The total Ar/H ratio can be obtained using
| (12) |
The finally derived Ar/H abundance ratio is 2.57010-6.
We have derived the K3+/H+ abundance ratio from the [K iv] 6102 and 6795 lines. A very faint feature, which might be the [K v] 4163 line is detected in the spectrum of NGC 7009, but we could not confirm that. K+ is probably negligible in NGC 7009, judging from the very low ionization potential of K. Since the ionization potential of K+ (31.6 eV) is comparable to that of N+ (29.6 eV), and ionization potential of K3+ (60.9 eV) is comparable to that of F2+ (62.7 eV), we assume K2+/K = N2+/N and K4+/K = F3+/F. Here the N2+/N ratio is from the ORLs, and the F3+/F ratio is from CELs. We use the following equation to correct for the unseen K2+ and K4+ ions,
| (13) |
The derived the total K/H abundance ratio is 4.24210-8.
| Element | X/H | [X/H]+12 | TLWa | TLWb | KB94c | Solard | ||||
|---|---|---|---|---|---|---|---|---|---|---|
| ORLs | CELs | ORLs | CELs | ORLs | CELs | ORLs | CELs | |||
| He | 0.112 | 11.049 | 11.02 | 11.06 | 11.06 | 10.93 | ||||
| C | 8.93(0.45)10-4 | 1.64(0.33)10-4 | 8.95 | 8.21 | 9.09 | 8.52 | 9.03 | 8.56 | 8.74 | 8.43 |
| N | 4.92(0.20)10-4 | 7.14(0.35)10-5 | 8.69 | 7.85 | 8.94 | 8.17 | 9.14 | 8.34 | 8.38 | 7.83 |
| O | 1.67(0.06)10-3 | 3.60(0.07)10-4 | 9.22 | 8.56 | 9.22 | 8.60 | 9.32 | 8.70 | 8.66 | 8.69 |
| F | 2.92(0.58)10-7 | 5.47 | 4.56 | |||||||
| Ne | 8.40(0.42)10-4 | 1.58(0.08)10-4 | 8.92 | 8.20 | 9.06 | 7.99 | 9.07 | 8.13 | 8.06 | 7.93 |
| Mge | 3.18(0.16)10-5 | 7.50 | 7.56 | 7.71 | 7.60 | |||||
| Sif | 8.28(0.80)10-6 | 6.92 | 7.51 | |||||||
| S | 1.30(0.11)10-5 | 7.11 | 6.84 | 7.05 | 6.99 | 7.12 | ||||
| Cl | 1.93(0.21)10-7 | 5.28 | 5.35 | 5.29 | 5.50 | |||||
| Ar | 2.57(0.38)10-6 | 6.41 | 6.20 | 6.34 | 6.51 | 6.40 | ||||
| Kg | 4.24(0.84)10-8 | 4.63 | 5.03 | |||||||
- a
- b
- c
- d
-
Solar values from Asplund et al. asplund09 (2009).
- e
-
Mg+/H+ and Mg3+/H+ are neglected in calculating the total ORL abundance.
- f
-
Si+/H+ is neglected in calculating the total ORL abundance.
- g
-
K+/H+ and K4+/H+ are neglected in calculating the total CEL abundance.
5 Discussion
Average elemental abundances for the Galactic disc and bulge PNe taken from Kingsburg & Barlow kb1994 (1994) and Exter, Barlow & Walton exter04 (2004) are presented in Table 25 for purpose of comparison. Also presented in this table are the average abundances for 23 Galactic bulge PNe of Wang & Liu wl2007 (2007) plus two bulge PNe M 1-42 and M 2-36 studied by Liu et al. 2001b , and 58 Galactic disc PNe selected from Tsamis et al. (tsamis2003 2003, tsamis2004 2004), Liu et al. (2004a , b) and Wesson et al. wlb2005 (2005). The helium abundance derived from the current analyses agrees well with the average value of the 58 disc sample, but 0.12 dex higher than the most recent solar value (Asplund et al. asplund09 2009). The recombination line C/H abundance 8.95 derived for NGC 7009 also agrees with the average value (9.03) of the disc sample, but 0.14 dex lower than the 23 bulge sample of Wang & Liu wl2007 (2007). The forbidden-line C/H abundance for NGC 7009 is lower than all the values quoted from literature. The elemental N/H abundance derived from CELs for NGC 7009 agrees well with the the Sun, but lower than all other average values. Our recombination line N/H abundance is lower than the average values of the bulge and dsic samples compiled by Wang & Liu wl2007 (2007), but is higher than the average value of the sample from Kingsburg & Barlow kb1994 (1994) plus Exter, Barlow & Walton exter04 (2004). The forbidden-line O/H abundance for NGC 7009 is 0.13 dex low than the solar value, and lower than the average value of the disc sample of Wang & Liu wl2007 (2007) by the same amount. Our C/O abundance ratio derived from CELs is 0.96, slightly lower than all other ratios from literature, indicating that NGC 7009 might be enriched in oxygen, which is consistent with the fact that the spectrum of NGC 7009 is obviously rich in oxygen emission lines. The forbidden-line neon abundance of NGC 7009 is 0.27 dex () higher than the solar value, and agrees with the average value (8.13) of the disc sample of Wang & Liu wl2007 (2007). The forbidden-line Ne/O ratio observed in NGC 7009 is higher than the solar ratio by a factor of 2.5. However, Wang & Liu wl2008 (2008) suggests that the solar Ne/O ratio of Asplund, Grevesse & Sauval asplund05 (2005) be revised upwards by 0.22 dex, i.e. increased to 0.37. Similarly high forbidden-line Ne/O ratio (0.34–0.36) is also found in NGC 6153 by Liu et al. liu2000 (2000). The sulfur and argon abundances of NGC 7009 both agree with the solar values. The Mg/H abundance of NGC 7009 agrees with the average abundance of the bulge PNe sample of Wang & Liu wl2007 (2007), and is 0.1 dex lower than the solar value.
Elemental abundances derived from ORLs and CELs observed in NGC 7009 are presented in Table 25. By using the IR and UV observed line fluxes from the literature and correcting for extinction, we are able to derive elemental abundances of C, N, O, and Ne relative to hydrogen from both ORLs and CELs. The resultant ORL abundances of the above four elements are all higher than the abundance ratios derived from CELs, by a factor of 5–7. After deep spectroscopic observations of the ORLs detected in the spectrum of NGC 7009 by LSBC (for C, N and O) and LLB01 (for Ne), those heavy-element abundance discrepancy problems are again studied quantitatively, using the deepest CCD spectrum ever taken for a gaseous nebula and the new effective recombination coefficients calculated for the N ii and O ii recombination spectra under the nebular conditions in the intermediate coupling scheme. The analyses of the spectrum are carried out in a very consistent manner, i.e. an electron temperature of 1000 K as derived from the N ii and O ii ORL ratios is assumed throughout analyses of the heavy-element ORLs, while a temperature of about 10 000 K as yielded by CELs is assumed in calculating the CEL abundances. In the previous deep spectroscopy of NGC 7009 by LSBC, the electron temperature (10 000 K) derived from the [O iii] nebular-to-auroral line ratio was adopted in calculating the ORL abundances. In the analyses of the neon abundance in NGC 7009 by LLB01, the electron temperature (7100 K) derived from the H i Balmer jump was used to calculate the recombination line neon abundance. Liu et al. liu2000 (2000) assumed a temperature of 9100 K, as derived from the [O iii] CEL ratio, in calculating the recombination line abundances for the C, N, O and Ne ions in NGC 6153. In the analyses of Galactic bulge PNe M 1-42 and M 2-36, Liu et al. 2001b used the H i Balmer jump temperature (3560 K for M 1-42 and 5900 K for M 2-36) to derived the recombination line abundances. However, the recombination line abundances derived in the studies mentioned above are questionable, given that the temperatures assumed are not derived from the heavy-element ORLs. The effective recombination coefficients of the permitted transitions of heavy element ions, which are mainly excited by radiative recombination, usually decrease as the electron temperature increases, except for the dielectronic transitions (with high-lying parent), whose effective recombination coefficients increases as the temperature increases. When we use the recombination lines that are mainly excited by radiative recombination, such as those used by LSBC and LLB01, to calculate the ionic abundances of C, N, O and Ne, using the forbidden line temperature e.g. ([O iii]) or the H i Balmer jump temperature will result in overestimated recombination line abundances, because those two temperatures are both much higher than the temperatures yielded by the heavy element ORLs as revealed in the current analyses as well as many previous studies (e.g. Liu liu2011 2011 for a recent review). Here we take the O ii recombination lines as examples. When the electron temperature increases from 1000 to 10 000 K, the effective recombination coefficient for the O ii M1 4649.13 line decreases by a factor of 7.5 (PJS), and the effective recombination coefficient for H decreases by a factor of 6 (Storey & Hummer sh1995 1995), as a consequence the O2+/H+ ionic abundance, which is calculated from the ratio of the effective recombination coefficients of the two lines (H)/(4649), will increase by 22 per cent.
The ADFs observed in NGC 7009, although moderate compared with those found in PNe NGC 6153 (ADF10, Liu et al. liu2000 2000), M 1-42 (ADF20, Liu et al. 2001b ), NGC 1501 (ADF30, Ercolano et al. ercolano04 2004) and Hf 2-2 (ADF70, Liu et al. lbzbs06 2006), is high compared with most of the other Milky Way PNe so far spectroscopically studied (ADFs1.6–3.2). Ever since the observation of an ADF value of about from the deep spectroscopy of NGC 7009 by LSBC, it has been wondered that possible systematic effects in the classic plasma analysis procedure based on CEL measurements might cause the observed discrepancies, if inaccuracies in the effective recombination coefficients or contamination of the recombination lines by processes such as stellar continuum resonance fluorescence as the origins of the discrepancies can be ruled out. After observations of the [O iii] 4931/4959 line ratio in seven Milky Way PNe and the Orion Nebula by Mathis & Liu ml1999 (1999), the measurement errors in CELs as the culprit has also been ruled out. Clearly the temperature and abundance discrepancies are real, and the two categories of emission lines probably arise from regions with different physical conditions. A detailed study of NGC 6153 by Liu et al. liu2000 (2000) yielded an ADF of about 10 for that object and, based on the empirical composite models, Liu et al. liu2000 (2000) proposed a bi-abundance nebular model as a possible explanation to such high abundance discrepancy.
Ever since the detection of a Balmer jump temperature as low as 3560 K for M 1-42, 5660 K lower than the [O iii] forbidden line temperature for the same nebula (Liu et al. 2001b ), it has become increasingly clear that PNe, at least those exhibiting large ADFs, must contain another component of previously unknown ionized gas. This component of gas mainly emits ORLs yet is essentially invisible in strong CELs because the electron temperature prevailing in the component is too low to excite any UV or optical CELs. The low temperature condition in that component is probably due to the much enhanced cooling by the IR fine-structure lines of the heavy element ions, which is a consequence of of a very high metallicity (i.e. H-deficient). This physical idea is supported by detailed photoionization modeling of Péquignot et al. pequignot03 (2003) and Tylenda tylenda03 (2003) and also by direct measurements of the average electron temperatures under which various types of emission lines are emitted (c.f. Liu liu2003 2003, 2006a , b and liu2011 2011 for reviews; Zhang et al. zhang2004 2004 for the plasma diagnostics based on the H i recombination spectrum and Zhang et al. 2005a for the plasma diagnostics based on the He i recombination spectrum). The discovery of a dramatically high ADF value of 70 and the remarkably low Balmer jump temperature (900 K) in PN Hf 2-2 by Liu et al. 2006a strengthens the validity of the bi-abundance nebular model. In order to reproduce the multi-waveband spectroscopic and imaging observations of NGC 6153 and investigate the nature and origin of the H-deficient inclusions, Yuan et al. yuan2011 (2011) constructed three-dimensional photoionization models, using the Monte Carlo photoionization code MOCASSIN developed by Ercolano et al. ercolano03 (2003). Modeling of NGC 6153 showed that chemically homogeneous models yielded small electron temperature fluctuations and failed to reproduce the strengths of the ORLs of heavy element ions. In contrast, bi-abundance models incorporating a small amount of metal-rich inclusions (1.3 per cent of the total nebular mass) are able to match all the observations within measurement uncertainties. The metal-rich inclusions, cooled down in a very low temperature (800 K) by ionic IR fine-structure lines, dominate the emission of heavy-element ORLs, but contribute almost nil to the emission of most CELs. The current analyses of the optical recombination spectrum of NGC 7009 are carried out under the context of the bi-abundance nebular model, and the results of plasma diagnostics based on various types of emission lines and abundance determinations are consistent with that context: the temperature sequence ([O iii]) (H i BJ) (He i) (N ii & O ii ORLs) is consistent with predictions from the bi-abundance model; the C2+/H+, N2+/H+, O2+/H+ and Ne2+/H+ ionic abundances derived from ORLs, using the new effective recombination coefficients and the electron temperature yielded by the N ii and O ii ORLs, are systematically higher, by about a factor of 5, than the corresponding abundances derived from CELs. It has been shown from optical observations that the ADF varies with position in several high-ADF PNe and is highest close to the central star. The “cold” inclusions should be cooled via the IR fine-structure lines of heavy element ions. Thus it is interesting to see if the IR fine-structure line fluxes relative to optical/UV CELs peak where the ADF peaks in PNe with large ADFs. Recently, Herschel and Hubble observations of NGC 7009 have been carried out and the results show that within the first 5 arcsec from the central star of NGC 7009, the [O iii] 88m/5007 flux ratio seems to increase towards center (R. H. Rubin, private communication). With the very deep spectrum and the high-quality atomic data now available, we can derive more precise physical properties e.g. total mass, spatial distribution of the “cold”, metal-rich inclusions in NGC 7009 through three-dimensional photoionization modeling.
Given that the ADFs found in PNe are all larger than unity, the metal-rich (H-deficient) inclusions are probably a real feature of PNe. However, the the presence of those “cold” inclusions is not predicted by the current theories of stellar evolution. Iben, Kaler & Truran iben83 (1983) proposed that an evolved star undergoing a very late helium flash (the so-called ’born-again’ PNe) may harbour H-deficient material, such as the H-deficient knots detected in the two ’born-again’ PNe Abell 30 and Abell 58. Wesson, Liu & Barlow wlb2003 (2003) and Wesson et al. wesson08 (2008) found that the H-deficient knots in Abell 30 and Abell 58 are O-rich, in contradiction with the expectation of the ’born-again’ scenario. The ADFs are found to be high in the PNe with Wolf-Rayet central stars, and that can be explained by the scenario of a single post-asymptotic giant branch (post-AGB) star experiencing a list helium shell flash, but not all PNe with large ADFs have an H-deficient central star, such as the case of NGC 7009 studied in the current paper. García-Rojas, Peña & Peimbert garcia09 (2009) observed the faint ORLs in Galactic PNe with [WC] nucleus and found the results that argue against the presence of H-deficient knots coming from a late thermal pulse event. De Marco demarco08 (2008) suggested a binary scenario to explain the observations that are in contradiction with the theory of the single post-AGB evolution. In this respect, it is interesting to note that Abell 58 have experienced a nova-like outburst (Clayton & De Marco cd97 1997). Lutz et al. lutz98 (1998) has also found the central star of Hf 2-2, a PN with the largest ADF value (70, Liu et al. 2006a ) ever found for an emission line nebulae, to be a close binary system. An alternative scenario of the origin of the H-deficient inclusions is that they evolve from metal-rich planetary material, such as icy planetesimals left over from the debris of planetary system of the progenitor star of the PN (Liu liu2003 2003, 2006a ). Both high spectral- and spatial-resolution observations in the future, in combination with detailed three-dimensional photoionization modeling as has been carried out for NGC 6153 (Yuan et al. yuan2011 2011), will help to reveal the possible astrophysical origins of the H-deficient inclusions in NGC 7009.
6 Summary and conclusions
Nearly two decades after the first analysis of the O ii optical recombination spectrum of the bright PN NGC 7009 (LSBC), once again we focus on the rich ORLs of heavy element ions detected in very deep CCD spectrum of the same object. Thanks to much advance in observational techniques, which enables accurate detection of the weak ORLs of heavy element ions, and the steady improvements in atomic data, especially the recombination theories of heavy element ions in the physical conditions of photoionized nebulae, we are now clear that the long-standing dichotomy between nebular plasma diagnostics and abundance determinations using CELs on the one hand and ORLs on the other, are real rather than cause by, e.g., observational uncertainties or errors in atomic data. Unremitting efforts in nebular research of the past 40 years gradually lead to new understanding of the problems in nebular astrophysics. Various mechanisms (e.g. temperature fluctuations and/or density inhomogeneities, abundance inhomogeneities, non-Maxwell-Boltzmann equilibrium electrons e.g. the -distribution of electron energies) have been proposed to explain the discrepancies in plasma diagnostics and abundance determinations, and debate over these mechanisms are still going on.
In the context of bi-abundance nebular model postulated by Liu et al. liu2000 (2000), we present a comprehensive and critical analysis of the rich optical recombination spectrum of NGC 7009. Transitions from individual multiplets of heavy element ions, e.g. C ii, N ii, O ii and Ne ii, are checked carefully for line blending, and accurate dereddened line fluxes of the most prominent transitions of those ions are obtained through multi-Gaussian profile fitting. In addition to the accurate observations of ORLs, we have finished new calculations of the effective recombination coefficients for the N ii recombination spectrum. The new effective recombination coefficients for the nebular O ii lines calculated by P. J. Storey (unpublished) help to enlarge our current atomic dataset for nebular recombination line study. Both calculations were carried out in the intermediate coupling scheme, and have taken into account the density-dependence of the relative populations of the ground fine-structure levels of recombining ions (i.e. N2+ 2P and 2P for N ii, and O2+ 3P0, 3P1 and 3P2 for O ii). The new effective recombination coefficients of N ii and O ii are of high quality and make nebular density diagnostics using the ORLs of heavy element ions possible for the first time.
The observed relative intensities of ORLs are compared with theoretical predictions that are based on the new effective recombination coefficients. At a given electron temperature ( = 1000 K) as yielded by the ORL ratios of N ii and O ii, the predicted relative intensities of ORLs agree with the observed values. Plasma diagnostics based on the best observed N ii and O ii ORLs (i.e. the (M3 5679)/(M39b 4041) ratio of N ii and the (M1 4649)/(M48a 4089) ratio of O ii) both yield electron temperatures close to 1000 K, which is lower than those derived from the CEL ratios by nearly one order of magnitude. The low temperatures yielded by the N ii and O ii ORLs indicate that the recombination lines of heavy element ions originate from very cold regions. The electron temperatures derived from the intensity ratios of the O ii high-excitation recombination lines M15 4591 and M36 4189, which are formed from recombination of excited-state parent (i.e. O2+ 2p2 1D), relative to the O ii M1 4649 line agree with eath other (3600 K), and is consistent with the fact that very cold (1000 K) inclusions probably exist in the nebula. The electron temperature (3000 K) yielded by the C ii (M28.01 8794)/(M6 4267) dielectronic-to-radiative recombination line ratio also agrees with the conjecture of very cold inclusions. The C2+/H+, N2+/H+, O2+/H+ and Ne2+/H+ ionic abundance ratios derived from ORLs, using the new effective recombination coefficients of N ii and O ii, are consistently higher than the corresponding values derived from CELs, by about a factor of 5. An electron temperature of 1000 K, which is yielded by the best observed N ii and O ii recombination line ratios and as a consequence presumably represents the physical condition prevailing in the regions where the heavy element ORLs arise, has been assumed throughout the recombination-line abundance determinations. The results of plasma diagnostics and abundance determinations for NGC 7009 points to the existence of “cold”, metal-rich inclusions in NGC 7009, and is thus consistent with the context of the current spectral analyses, i.e. the bi-abundance nebular model.
Recombination line analysis for NGC 7009 helps to assess the new atomic data. The agreement between the observed and predicted relative intensities of the N ii and O ii ORLs indicates that the current calculations of the recombination spectra of those two ionic species well represent the physical processes, i.e. radiative and dielectronic recombination, under nebular conditions. Our nebular analysis also shows that the recombination lines of different multiplets, or different -resolved fine-structure components of a multiplet yield consistent ionic abundances (e.g. N2+/H+ and O2+/H+). This is another evidence that the new effective recombination coefficients are reliable. However, the Ne2+/H+ abundance ratio derived from the total intensity of the 4f – 3d transitions is higher, by nearly 0.2 dex, than the average value derived from the multiplets of the 3 – 3 configuration. That indicates new calculations of the effective recombination coefficients for the Ne ii lines are needed.
Acknowledgements
We thank Dr. P. J. Storey for making the effective recombination coefficients for the O ii lines and the Ne ii 4f – 3d transitions available prior to publication. We thank Dr. R. H. Rubin for fruitful discussions. We would also like to thank Dr. O. De Marco for her valuable comments and suggestions which have greatly improved the quality of this paper. This work is supported by the Natural Science Foundation of China (No. 10933001).
References
- (1) Aggarwal, K. M., 1983, ApJS, 52, 387
- (2) Asplund, M., Grevesse, N., Sauval, A. J., 2005, in Barnes, T. G. III, Bash, F. N., eds, ASP Conf. Ser. Vol. 336, Cosmic Abundances as Records of Stellar Evolution and Nucleosynthesis. Astron. Soc. Pac., San Francisco, p. 25
- (3) Asplund, M., Grevesse, N., Sauval, A. J., Scott, P., 2009, ARA&A, 47, 481
- (4) Aller, L. H., Kaler, J. B., 1964, ApJ, 139, 1074
- (5) Almog, Y., Netzer, H., 1989, MNRAS, 238, 57
- (6) Baluja, K. L., Zeippen, C. J., 1988, J. Phys. B: At. Mol. Opt. Phys., 21, 1455
- (7) Barker, T., 1983, ApJ, 267, 630
- (8) Barker, T., 1991, ApJ, 371, 217
- (9) Bastin, R. J., 2006, Ph.D. Thesis. University College London (B06)
- (10) Burgess, A., Seaton, M. J., 1960a, MNRAS, 120, 121
- (11) Burgess, A., Seaton, M. J., 1960b, MNRAS, 121, 471
- (12) Barlow, M. J., Storey, P. J., 1993, in Weinberger, R., Acker, A., eds, Proc. IAU Symp. 155, Planetary Nebulae. Kluwer, Dordrecht, p. 92
- (13) Bauman, R. P., Porter, R. L., Ferland, G. J., MacAdam, K. B., 2005, ApJ, 628, 541
- (14) Bayes, F. A., Saraph, H. E., Seaton, M. J., 1985, MNRAS, 215, 85
- (15) Benjamin, R. A., Skillman, E. D., Smits, D. P., 1999, ApJ, 514, 307
- (16) Benjamin, R. A., Skillman, E. D., Smits, D. P., 2002, ApJ, 569, 288
- (17) Berrington, K. A., 1988, J. Phys. B: At. Mol. Opt. Phys., 21, 1083
- (18) Berrington, K. A., 1995, A&AS, 109, 193
- (19) Berrington, K. A., Burke, P. G., 1981, Planetary and Space Science, 29, 377
- (20) Berrington, K. A., Nakazaki, S., Norrington, P. H., 2000, A&AS, 142, 313
- (21) Berrington, K. A., Seaton, M. J., 1985, J. Phys. B: At. Mol. Phys., 18, 2587
- (22) Bowen, I. S., 1934, PASP, 46, 146
- (23) Bowen, I. S., 1935, ApJ, 81, 1
- (24) Blum, R. D., Pradhan, A. K., 1992, ApJS, 80, 425
- (25) Brocklehurst, M., 1972, MNRAS, 157, 211
- (26) Butler, K., Zeippen, C. J., 1989, A&A, 208, 337
- (27) Butler, K., Zeippen, C. J., 1994, A&AS, 108, 1
- (28) Cahn, J. H., Kaler, J. B., Stanghellini, L., 1992, A&AS, 94, 399
- (29) Clayton, G. C., De Marco, O., 1997, AJ, 114, 2679
- (30) Clegg, R. E. S., Harrington, J. P., Barlow, M. J., Walsh, J. R., 1987, ApJ, 314, 551
- (31) Cunto, W., Mendoza, W., Ochsenbein, F., Zeippen, C. J., 1993, A&A, 275, L5
- (32) Davey, A. R., Storey, P. J., Kisielius, R., 2000, A&AS, 142, 85
- (33) De Marco, O., 2008, in Werner, K., Rauch, T., eds, ASP Conf. Ser., Vol. 391, Hydrogen-Deficient Stars, Astron. Soc. Pac., San Francisco, p. 209
- (34) De Marco, O., Storey, P. J., Barlow, M. J., 1998, MNRAS, 297, 999
- (35) Exter, K. M., Barlow, M. J., Walton, N. A., 2004, MNRAS, 349, 1291
- (36) Escalante, V., Morisset, C., 2005, MNRAS, 361, 813
- (37) Escalante, V., Victor, G. A., 1990, ApJS, 73, 513
- (38) Ercolano, B., Barlow, M. J., Storey, P. J., Liu, X.-W., 2003, MNRAS, 340, 1136
- (39) Ercolano, B., Wesson, R., Zhang, Y., Barlow, M. J., De Marco, O., Rauch, T., Liu, X.-W., 2004, MNRAS, 354, 558
- (40) Fang, X., Liu, X.-W., 2011, MNRAS, 415, 181 (Paper I)
- (41) Fang, X., Storey, P. J., Liu, X.-W., 2011, A&A, 530, A18 (FSL11)
- (42) Ferland, G. J., 2003, Annu. Rev. Astron. Astrophys., 41, 517
- (43) Froese Fischer, C., 1994, Phys. Scri., 49, 323
- (44) Froese Fischer, C., Rubin, R. H. 2004, MNRAS, 355, 461
- (45) Froese Fischer, C., Saha, H. P., 1985, Phys. Scr., 32, 181
- (46) Fleming, J., Bell, K. L., Hibbert, A., Vaeck, N., Godefroid, M. R., 1996, MNRAS, 279, 1289
- (47) French, H. B., 1983, ApJ, 273, 214
- (48) Garstang, R. H., 1958, MNRAS, 118, 572
- (49) Garnett, D. R., Dinerstein, H. L., 2001, ApJ, 558, 145
- (50) Gau, J. N., Henry, R. J. W., 1977, Phys. Rev. A, 16, 986
- (51) Giles, K., 1981, MNRAS, 195, 63
- (52) Grandi, S. A., 1976, ApJ, 206, 658
- (53) García-Rojas, J., Peña, M., Peimbert, A., 2009, A&A, 496, 139
- (54) Hummer, D. G., Storey, P. J., 1987, MNRAS, 224, 801
- (55) Howarth, I. D., 1983, MNRAS, 203, 301
- (56) Hummer, D. G., Berrington, K. A., Eissner, W., Pradhan, A. K., Saraph, H. E., Tully, J. A., 1993, A&A, 279, 298
- (57) Hirata, R., Horaguchi, T., 1995, Atomic Spectral Line List
- (58) Iben, I., Kaler, J. B., Truran, J. W., 1983, ApJ, 264, 605
- (59) Johnson, C. T., Kingston, A. E., 1990, J. Phys. B, 23, 3393
- (60) Kaler, J. B., 1986, ApJ, 308, 322
- (61) Kastner, S. O., Behring, W. E., Bhatia, A. K., 1983, ApJS, 53, 129
- (62) Kastner, S. O., Bhatia, A. K., 1990, ApJ, 362, 745
- (63) Keenan, F. P., Aller, L. H., Bell, K. L., Hyung, S., McKenna, F. C., Ramsbottom, C. A., 1996, MNRAS, 281, 1073
- (64) Keenan, F. P., Feibelman, W. A., Berrington, K. A., 1992, ApJ, 389, 443
- (65) Keenan, F. P., Hibbert, A., Ojha, P. C., Conlon, E. S., 1993, Phys. Scr., 48, 129
- (66) Keenan, F. P., Norrington, P. H., 1987, A&A, 181, 370
- (67) Kisielius, R., Storey, P. J., 1999, A&AS, 137, 157
- (68) Kisielius, R., Storey, P. J., 2002, A&A, 387, 1135
- (69) Kisielius, R., Storey, P. J., Davey, A. R., Neale, L. T., 1998, A&AS, 133, 257
- (70) Kingsburg, R. L., Barlow, M. J., 1994, MNRAS, 271, 257
- (71) Lennon, D. J., Burke, V. M., 1994, A&AS, 103. 273
- (72) Liu, X.-W., 2003, in Kwok, S., Dopita, M., Sutherland, R. eds, IAU Symposium 209, Planetary Nebulae: Their Evolution and Role in the Universe. Astron. Soc. Pac., San Francisco p. 339
- (73) Liu, X.-W., Danziger, I. J., 1993a, MNRAS, 261, 465
- (74) Liu, X.-W., Danziger, I. J., 1993b, MNRAS, 263, 256
- (75) Liu, X.-W., Danziger, I. J., Murdin, P., 1993, MNRAS, 262, 699
- (76) Liu, X.-W., Barlow, M. J., Cohen, M., Danziger, I. J., Luo, S.-G., Baluteau, J. P., Cox, P., Emery, R. J., Lim, T., Péquignot, D., 2001a, MNRAS, 323, 343
- (77) Liu, X.-W., Luo, S.-G., Barlow, M. J., Danziger, I. J., Storey, P. J., 2001b, MNRAS, 327, 141
- (78) Liu, X.-W., 2006a, in Barlow, M. J., Méndez, R. H., eds, IAU Symposium 234, Planetary Nebulae in our Galaxy and Beyond, Cambridge University Press, p. 219
- (79) Liu, X.-W., 2006b, in Walsh, J., Stanghellini, L., Douglas, N., eds, Proceedings of the ESO Workshop on Planetary Nebulae beyond the Milky Way. Springer-Verlag, Berlin, p. 169
- (80) Liu, X.-W., 2011, in York, D. G., Gingerich, O., Zhang, S.-N., Harper, C. L., eds, New Vision 400: Engaging Big Questions in Astronomy and Cosmology Four Hundred Years after the Invention of the Telescope. CRC Press, p. 103
- (81) Liu, X.-W., Barlow, M. J., Zhang, Y., Bastin, R. J., Storey, P. J., 2006, MNRAS, 368, 1959
- (82) Liu, X.-W., Storey, P. J., Barlow, M. J., Clegg, R. E. S., 1995, MNRAS, 272, 369 (LSBC)
- (83) Liu, X.-W., Storey, P. J., Barlow, M. J., Danziger, I. J., Cohen, M., Bryce, M., 2000, MNRAS, 312, 585
- (84) Liu, Y., Liu, X.-W., Luo, S.-G., Barlow, M. J., 2004a, MNRAS, 353, 1231
- (85) Liu, Y., Liu, X.-W., Barlow, M. J., Luo, S.-G., 2004b, MNRAS, 353, 1251
- (86) Luo, D., Pradhan, A. K., Saraph, H. E., Storey, P. J., Yu, Y., 1989, J. Phys. B: At. Mol. Opt. Phys., 22, 389
- (87) Luo, S.-G., Liu, X.-W., Barlow, M. J., 2001, MNRAS,326, 1049 (LLB01)
- (88) Lutz, J., et al., 1998, AAS, 192, 5309
- (89) Mathis, J. S., 1957, ApJ, 125, 318
- (90) Mathis, J. S., Liu, X.-W., 1999, ApJ, 521, 212
- (91) McNabb, I. A., Fang, X., Liu, X.-W., Bastin, R. J., Storey, P. J., 2012, MNRAS, accepted
- (92) Mendoza, C. 1983, in IAU Symp. 103, Planetary Nebulae, ed. Flower, D., Reidel, Dordrecht, p.143
- (93) Mendoza, C., Zeippen, C. J., 1982a, MNRAS, 199, 1025
- (94) Mendoza, C., Zeippen, C. J., 1982b, MNRAS, 198, 127
- (95) Mendoza, C., Zeippen, C. J., 1983, MNRAS, 202, 981
- (96) Moore, C. E., 1993, In Tables of Spectra of Hydrogen, Carbon, Nitrogen, and Oxygen Atoms and Ions. Edited by Gallagher, J. w., CRC Press, Boca Raton, FL
- (97) Nahar, S. N., 1995, ApJS, 101, 423
- (98) Nicholls, D. C., Dopita, M. A., Sutherland, R. S., 2012, ApJ, 752, 148
- (99) Nahar, S. N., Pradhan, A. K., 1996, A&AS, 119, 509
- (100) Nussbaumer, H., 1969, Astrophys. Lett, 4, 183
- (101) Nussbaumer, H., Rusca, C., 1979, A&A, 72, 129
- (102) Nussbaumer, H., Storey, P. J., 1978, A&A, 70, 37
- (103) Nussbaumer, H., Storey, P. J., 1981a, A&A, 96, 91
- (104) Nussbaumer, H., Storey, P. J., 1981b, A&A, 99, 177
- (105) Nussbaumer, H., Storey, P. J., 1982, A&A, 113, 21
- (106) Nussbaumer, H., Storey, P. J., 1983, A&A, 126, 75
- (107) Nussbaumer, H., Storey, P. J., 1984, A&AS, 56, 293
- (108) Nussbaumer, H., Storey, P. J., 1986, A&AS, 64, 545
- (109) Nussbaumer, H., Storey, P. J., 1987, A&AS, 69, 123
- (110) Osterbrock, D. E., Ferland, G. J. (2006). Astrophysics of Gaseous Nebulae and Active Galactic Nuclei. Sausalito: University Science Books.
- (111) Peimbert, M., 1967, ApJ, 150, 825
- (112) Peimbert, M., 1971, Bol. Obs. Tonantzintla y Tacubaya, 6, 29
- (113) Perinotto, M., Benvenuti, P., 1981, A&A, 101, 88
- (114) Pelan, J., Berrington, K. A., 1995, A&AS, 110, 209
- (115) Péquignot, D., Liu, X.-W., Barlow, M. J., Storey, P. J., Morisset, C., 2003, in Kwok, S., Dopita, M., Sutherland, R., eds, IAU Symposium 209, Planetary Nebulae: Their Evolution and Role in the Universe. Astron. Soc. Pac., San Francisco, p. 347
- (116) Péquignot, D., Petitjean, P., Boisson, C., 1991, A&A, 251, 680
- (117) Pottasch, S. R., 1962, ApJ, 135, 385
- (118) Pottasch, S. R., Preite-Martinez, A., Olnon, F. M., Jing-Er, Mo, Kingma, S., 1986, A&A, 161,363
- (119) Porter, R. L., Bauman, R. P., Ferland, G. J., MacAdam, 2005, ApJ, 622, L73
- (120) Pradhan, A. K., 1976, MNRAS, 177, 31
- (121) Robertson-Tessi, M., Garnett, D. R., 2005, ApJS, 157, 371
- (122) Robbins, R. R., 1968, ApJ, 151, 497
- (123) Robbins, R. R., 1970, ApJ, 160, 519
- (124) Robbins, R. R., Robinson, E. L., 1971, ApJ, 167, 249
- (125) Rubin, R. H., 1989, ApJS, 69, 897
- (126) Rubin, R. H., Colgan, S. W. J., Haas, M. R., Lord, S. D., Simpson, J. P., 1997, ApJ, 479, 332
- (127) Sawey, P. M., Berrington, K. A., 1993, Atom. Data Nucl. Data Tables, 55, 81
- (128) Saraph, H. E., Seaton, M. J., 1980, MNRAS, 193, 617
- (129) Saraph, H. E., Storey, P. J., 1999, A&AS, 134, 369
- (130) Seaton, M. J., 1987, J. Phys. B, 20, 6363
- (131) Sharpee, B., Williams, R., Baldwin, J. A., van Hoof, P. A. M., 2003, ApJS, 149, 157
- (132) Stafford, R. P., Bell, K. L., Hibbert, A., Wijesundera, W. P., 1994, MNRAS, 268, 816
- (133) Smits, D. P., 1991, MNRAS, 251, 316
- (134) Smits, D. P., 1996, MNRAS, 278, 683
- (135) Storey, P. J., 1981, MNRAS, 195, 27
- (136) Storey, P. J., 1994, A&A, 282, 999
- (137) Storey, P. J., Hummer, D. G., 1995, MNRAS, 272, 41
- (138) Tylenda, R., 2003, in Kwok, S., Dopita, M., Sutherland, R., eds, IAU Symposium 209, Planetary Nebulae: Their Evolution and Role in the Universe. Astron. Soc. Pac., San Francisco, p. 389
- (139) Tachiev, G., Froese Fischer, C., 2001, Can. J. Phys. 79, 955
- (140) Tong, X.-M., Zou, Y., Li, J.-M., Liu, X.-W., 2001, Chin. Phys. Letter, 11, 69
- (141) Tsamis, Y. G., Barlow, M. J., Liu, X.-W., Danziger, I. J., Storey, P. J., 2003, MNRAS, 345, 186
- (142) Tsamis, Y. G., Barlow, M. J., Liu, X.-W., Storey, P. J., Danziger, I. J., 2004, MNRAS, 353, 953
- (143) Viegas, S. M., Clegg, R. E. S., 1994, MNRAS, 271, 993
- (144) Vujnovic, V., Wiese, W. L., 1992, J. Phys. Chem. Ref. Data, 21, 919
- (145) Wang, W., Liu, X.-W., 2007, MNRAS, 381, 669
- (146) Wang, W., Liu, X.-W., 2008, MNRAS, 389, L33
- (147) Wenåker, I., 1990, Physica Scripta, 42, 667
- (148) Wesson, R., Barlow, M. J., Liu, X.-W., Storey, P. J., Ercolano, B., De Marco, O., 2008, MNRAS, 383, 1639
- (149) Wesson, R., Liu, X.-W., Barlow, M. J., 2003, MNRAS, 340, 253
- (150) Wesson, R., Liu, X.-W., Barlow, M. J., 2005, MNRAS, 362, 424
- (151) Wiese, W. L., Smith, M. W., Glennon, B. M., 1966, NSRDS-NBS 4, US Government Printing Office, Washington DC
- (152) Wyse, A. B., ApJ, 95, 356
- (153) Yuan, H.-B., Liu, X.-W., Péquignot, D., Rubin, R. H., Ercolano, B., Zhang, Y., 2011, MNRAS, 411, 1035
- (154) Zeippen, C. J., 1982, MNRAS, 198, 111
- (155) Zeippen, C. J., Le Bourlot, J., Butler, K., 1987, A&A, 188, 251
- (156) Zhang, H. L., 1996, A&AS, 119, 523
- (157) Zhang, H. L., Pradhan, A. K., 1997, A&AS, 126, 373
- (158) Zhang, Y., Liu, X.-W., Wesson, R., Storey, P. J., Liu, Y., Danziger, D., 2004, MNRAS, 351, 935
- (159) Zhang, Y., Liu, X.-W., Liu, Y., Rubin, R. H., 2005a, MNRAS, 358, 457
- (160) Zhang, Y., Liu, X.-W., Luo, S.-G., Péquignot, D., Barlow, M. J., 2005b, A&A, 442, 249
- (161) Zhang, Y., Liu, X.-W., 2005, ApJ, 631, L61
Appendix A The C ii optical recombination spectrum
A.1 Multiplet 6, 4f 2Fo – 3d 2D
See Section 3.1.1.
A.2 Multiplet 3, 3d 2D – 3p 2Po
Only the 7231.32 (3d 2D3/2 – 3p 2P) line is detected; the other two components 7236.42 (3d 2D5/2 – 3p 2P) and 7237.17 (3d 2D3/2 – 3p 2P) are blended with the [Ar iv] 3p3 2P – 3p3 2D 7237.40 line. The intensity of 7231.32 is 0.130, with an uncertainty of less than 5 per cent. Assuming that the intensity ratios of the C ii M3 lines are as in the LS coupling, i.e. 1 : 5 : 9, we obtain an total intensity ratio of M3 7235 to C ii M6 4267 of 0.442, which is lower than the predicted ratio in Case B but much higher than the Case A value (). Those theoretical ratios are based on the C ii effective recombination coefficients of B06. Since the calculation of B06 for the C ii recombination spectrum is valid from 5000 K, here an electron temperature of 10 000 K and a density of 10 000 cm-3 were assumed. In this section, an electron temperature of 5000 or 10 000 K is assumed when we use the effective recombination coefficients of B06.
The calculation of Davey, Storey & Kisielius davey2000 (2000) is valid from 500 to 20 000 K. Using their C ii effective recombination coefficients, we derived a theoretical C ii (M3 7235)/(M6 4267) ratio of in Case A and in Case B. An electron temperature of 1000 K and a density of 10 000 cm-3 are assumed when we use the atomic data of Davey, Storey & Kisielius davey2000 (2000) in the current paper. Given that the effective recombination coefficients are insensitive to electron density at low temperature, we expect that the intensity ratio of those two C ii multiplets at 10 000 cm-3 does not differ much from that at 2000 – 4000 cm-3, a density range yielded by the N ii and O ii recombination line diagnostics (see Figs. 12 and 17). Thus the C ii (M3 7235)/(M6 4267) ratio observed in NGC 7009 (0.442) lies between the two cases.
A.3 Multiplet 4, 4s 2S – 3p 2Po
The 3918.98 (4s 2S1/2 – 3p 2P) component is blending with the O ii M17 3p′ 2P – 3s′ 2D3/2 3919.29 and N ii M17 3d 1P – 3p 1P1 3919.00 lines, and is partially blended with the other M4 line 3920.69 (4s 2S1/2 – 3p 2P). Two Gaussian profiles were used to fit the complex. Using the O ii effective recombination coefficients of PJS, we estimated that the O ii line contributes 42 per cent to the total intensity of the blend at 3919. The contribution of the N ii line is negligible according to the calculation of FSL11. The intensities of the 3918.98 and 3920.69 lines have 0.0160.003 and 0.0340.004, respectively. Thus the intensity ratio of C ii M4 3920 to the C ii M6 4267 multiplet is 0.057, which agrees with the predicted ratio in Case B derived from the coefficients of B06, but higher than the Case A value 0.018. An electron temperature of 10 000 K was assumed. At 5000 K, the lowest temperature of the calculation by B06, this C ii ratio is in Case A and in Case B. The C ii M4 multiplet is not presented in the calculation of Davey, Storey & Kisielius davey2000 (2000).
A.4 Multiplet 16.04, 6f 2Fo – 4d 2D
All fine-structure components of this multiplet have an identical laboratory wavelength 6151.43 Å. Single Gaussian profile fitting to this feature gives an intensity of 0.0280.004. The contribution from the blended N ii M36 4p 3D2 – 3d 3F 6150.75 line is negligible. Thus the intensity ratio of this multiplet to C ii M6 4267 is 0.031, agrees with the predicted ratio 0.027 deduced from the coefficients of Davey, Storey & Kisielius davey2000 (2000). The predicted ratio of the two C ii multiples, based on the coefficients of B06, is 0.037. Both Davey, Storey & Kisielius davey2000 (2000) and B06 show that the Case A effective recombination coefficient for the 6151 multiplet differs from its Case B value by only 2 per cent. For the C ii transitions of large (), only Case A coefficients are presented by Davey, Storey & Kisielius davey2000 (2000). Thus in this section, the theoretical intensity ratios of those C ii transitions relative to the M6 4267 multiplet are all presented in Case A.
A.5 Multiplet 17.02, 5g 2G – 4f 2Fo
This multiplet (9903) is free of blending, and has an intensity 0.2130.020. The intensity ratio of M17.02 9903 to the C ii M6 4267 multiplet is 0.234, which is slightly lower than the predicted ratio 0.302 deduced from the coefficients of Davey, Storey & Kisielius davey2000 (2000). At 10 000 K, the effective recombination coefficient for this multiplet given by Davey, Storey & Kisielius davey2000 (2000) differs from that of B06 by only 3 per cent.
A.6 Multiplet 17.04, 6g 2G – 4f 2Fo
This multiplet (6462) has an intensity of 0.0780.004. The intensity ratio of 6462 to the C ii M6 4267 multiplet is 0.088, which agrees with the predicted value 0.076 (deduced from the atomic data of Davey, Storey & Kisielius davey2000 (2000)) within errors.
A.7 Multiplet 17.06, 7g 2G – 4f 2Fo
The C ii M17.06 5342 multiplet is partially blending with a very weak feature, which was identified as [Kr iv] 5346.02 (Paper I). Two Gaussian profiles were used to fit the complex, and that gives an intensity of 0.0370.002 for 5342. The intensity ratio of 5342 to the C ii M6 4267 multiplet is 0.043, which agrees well with the predicted ratio 0.045 deduced from the data of Davey, Storey & Kisielius davey2000 (2000)).
A.8 Multiplet 28.01, 3d′ 2Fo – 3p′ 2D
See Section 3.1.2.
Appendix B The N ii optical recombination spectrum
B.1 Multiplet 3, 3p 3D – 3s 3Po
See Section 3.2.1.
B.2 Multiplet 5, 3p 3P – 3s 3Po
The strongest component of the N ii M5 multiplet, 4630.54 (3p 3P2 – 3s 3P) is partially blended with the N iii M2 3d 2D3/2 – 3p 2P 4634.14 fluorescence line (Fig. 32). Gaussian profile fitting yields an intensity of 0.0670.013 for 4630.54. The intensity ratio of the 4630.54 line and the N ii M3 5679.56 line is 0.512, which agrees well with the predicted ratio . Another M5 line 4601.48 (3p 3P2 – 3s 3P) is blended with the O ii M92b 4f F[3] – 3d 2D3/2 4602.13 line, which contributes about 70 per cent to the total intensity, as estimated from the O ii effective recombination coefficients of PJS.
The other four M5 lines all suffer from serious line blending: (1) The 4607.16 (3p 3P1 – 3s 3P) line is blended with the [Fe iii] 4607.03 line, whose contribution to the total intensity is uncertain. The blend at 4607 is again partially blended with a much stronger feature centered at 4609, which is a blend of O ii M92a 4f F[4] – 3d 2D5/2 4609.44 and O ii M92c 4f F[2] – 3d 2D3/2 4610.20 (Fig. 42). (2) The 4613.87 (3p 3P1 – 3s 3P) line is blended with at least three lines, O ii M92b 4f F[3] – 3d 2D5/2 4613.14, O ii M92b 4f F[3] – 3d 2D5/2 4613.68, and Ne ii M64b 4f 2[3] – 3d 4P5/2) 4612.93. (3) The 4621.39 (3p 3P0 – 3s 3P) line is blended with at least two lines, O ii M92c 4f F[2] – 3d 2D5/2 4621.27 and O ii M92c 4f F[2] – 3d 2D5/2 4622.14. (4) The 4643.09 (3p 3P1 – 3s 3P) line is blended with the N iii M2 4640.64 and 4641.85 fluorescence lines (Fig. 32). Accurate measurements of these four N ii M5 lines are difficult.
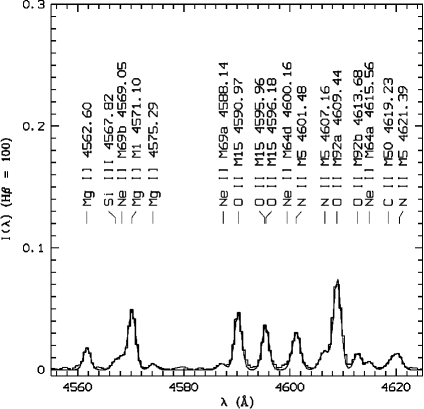
B.3 Multiplet 12, 3p 1D – 3s 1Po
This singlet (3994.99) is shown in Fig. 45. Gaussian profile fitting yields an intensity of 0.0330.004. The intensity ratio of the 3994.99 line to the N ii M3 5679.56 line is 0.257, which is higher than the theoretical prediction .
B.4 Multiplet 19, 3d 3Fo – 3p 3D
The M19 5004 lines are blended with or seriously affected by the saturated [O iii] 5007 line.
B.5 Multiplet 20, 3d 3Do – 3p 3D
The M20 4803.29 (3d 3D – 3p 3D3) line is blended with the C ii M17.08 8g 2G – 4f 2Fo 4802.70 line, which contributes 50 per cent to the total intensity of the blend at 4803, as estimated from the C ii effective recombination coefficients of Davey, Storey & Kisielius davey2000 (2000). The intensity of the 4803.29 line is 0.0320.016. The intensity ratio of 4803.29 and the N ii M3 5679.56 line is 0.248, which agrees with the predicted value 0.282 within errors. The other M20 lines are not detected.
B.6 Multiplet 28, 3d 3Do – 3p 3P
See Section 3.2.2.
B.7 Multiplet 29, 3d 3Po – 3p 3P
Accurate measurements of this multiplet are difficult. Only the 5454.22 (3d 3P – 3p 3P1) and 5480.06 (3d 3P – 3p 3P2) lines are detected. The former line is blended with the S ii M6 4p 4D – 4s 4P5/2 5453.83 line and the latter one is blended with the 5478.10 (3d 3P – 3p 3P1) line of the same multiplet.
B.8 4f – 3d transitions
B.8.1 Multiplet 39a, 4f G[7/2] – 3d 3Fo:
See Section 3.2.3.
B.8.2 Multiplet 39b, 4f G[9/2] – 3d 3Fo:
See Section 3.2.3.
B.8.3 Multiplet 38a, 4f F[5/2] – 3d 3Fo:
Accurate measurements of this multiplet are difficult. The 4076.91 (4f F[5/2]2 – 3d 3F) and 4077.40 (4f F[5/2]3 – 3d 3F) lines are blended with the [S ii] 4076.35 (3p3 2P – 3p3 4S) line. The 4086.83 (4f F[5/2]2 – 3d 3F) and 4087.30 (4f F[5/2]3 – 3d 3F) lines are blended with the O ii M48c 4f G[3] – 3d 4F3/2 4087.15 line. The other M38a line 4100.97 (4f F[5/2]3 – 3d 3F) line is blended with the H i 4101 line.
B.8.4 Multiplet 38b, 4f F[7/2] – 3d 3Fo:
Accurate measurements of the M38b lines are difficult. The 4073.04 (4f F[7/2]3 – 3d 3F) line is blended with the much stronger O ii M10 4072.16 line. The 4095.90 (4f F[7/2]4 – 3d 3F) and 4096.58 (4f F[7/2]3 – 3d 3F) lines are blended with the N iii M1 3p 2P – 3s 2S1/2 4097.33 fluorescence line. The other lines are not observed.
B.8.5 Multiplet 43a, 4f F[5/2] – 3d 1Do:
The intensity of the 4176.16 (4f F[5/2]3 – 3d 1D) line is 0.0280.004, which includes the contribution from the N ii M43a 4f F[5/2]2 – 3d 1D 4175.66 line (about 20 per cent).
B.8.6 Multiplet 43b, 4f F[7/2] – 3d 1Do:
The 4171.61 (4f F[7/2]3 – 3d 1D) line is partially blended with the O ii M19 4169.22 line. The 4171.61 line has an intensity of 0.0230.003, which agrees well with the predicted value (Table 3).
B.8.7 Multiplet 48a, 4f F[5/2] – 3d 3Do:
The 4241.78 (4f F[5/2]3 – 3d 3D) line coincides in wavelength with the N ii M48b 4f F[7/2]4 – 3d 3D 4241.78 line. The 4236.91 (4f F[5/2]2 – 3d 3D) line is blended with the N ii M48b 4f F[7/2]3 – 3d 3D 4237.05 line (Fig. 31). Gaussian profile fitting yields an intensity of 0.0550.011 for the 4236.91 line, which includes the contribution from the N ii M48b 4237.05 line (30 per cent). The 4236.91 line intensity is 24 per cent higher than what is predicted (Table 3). Measurements of the other two M48a lines, 4246.71 (4f F[5/2]2 – 3d 3D) and 4247.20 (4f F[5/2]3 – 3d 3D) are difficult.
B.8.8 Multiplet 48b, 4f F[7/2] – 3d 3Do:
The 4241.78 (4f F[7/2]4 – 3d 3D) line coincides in wavelength with the N ii M48a 4f F[5/2]3 – 3d 3D 4241.78 line. The total intensity of the 4242 line agrees well with the predicted value (Table 3). The contribution from the blended Ne ii M52c 4f 2[1] – 3d 4D1/2 4242.04 line (10–15 per cent) is included. The contributions from the N ii M48a 4f F[5/2]2 – 3d 3D 4241.24 and M48b 4242.49 (4f F[7/2]3 – 3d 3D) lines are negligible. The other M48b line 4237.05 (4f F[7/2]3 – 3d 3D) is blended with the N ii M48a 4f F[5/2]2 – 3d 3D 4236.91 line, which contributes 70 per cent to the total intensity.
B.8.9 Multiplet 49a, 4f G[7/2] – 3d 3Do:
The 4195.97 (4f G[7/2]3 – 3d 3D) line is blended with the N iii M6 3p′ 2D3/2 – 3s′ 2P 4195.76 line (Fig. 31), and contributes 8 per cent to the total intensity. The other two M49a lines, 4199.98 (4f G[7/2]4 – 3d 3D) and 4201.35 (4f G[7/2]3 – 3d 3D) are blended with the much stronger He ii 11g 2G – 4f 2Fo 4199.83 line.
B.8.10 Multiplet 49b, 4f G[9/2] – 3d 3Do:
The 4181.10 (4f G[9/2]4 – 3d 3D) line is blended with the N ii M50a 4178.86 (4f D[5/2]2 – 3d 3D) and M50a 4179.67 (4f D[5/2]3 – 3d 3D) lines, whose intensity contribution is less than 40 per cent. [Fe v] 4180.60 is probably also blended (Fig. 31), but its intensity is uncertain.
B.8.11 Multiplet 50a, 4f D[5/2] – 3d 3Do:
The 4169.38 (4f D[5/2]2 – 3d 3D) line is blended with the O ii M19 4169.22 line, which contributes 70 per cent to the total intensity. The 4178.86 (4f D[5/2]2 – 3d 3D) and 4179.67 (4f D[5/2]3 – 3d 3D) lines are blended with the N ii M49b 4f 2[5]4 – 3d 3D 4181.10 line, which contributes more than 60 per cent to total intensity. The other two M50a lines 4173.57 (4f D[5/2]2 – 3d 3D) and 4174.38 (4f D[5/2]3 – 3d 3D) are not observed.
B.8.12 Multiplet 50b, 4f D[3/2] – 3d 3Do:
The 4156.39 (4f D[3/2]2 – 3d 3D) and 4157.01 (4f D[3/2]1 – 3d 3D) lines are blended with the O ii M19 4156.53 (3d 4P3/2 – 3p 4P) line, which contributes 75 per cent to the total intensity of the blend at 4157. The other M50b lines are not observed.
B.8.13 Multiplet 55a, 4f D[5/2] – 3d 3Po:
The 4442.02 (4f D[5/2]2 – 3d 3P) line is blended with the Ne ii M60b 4f 1[4] – 3d 2F5/2 4442.69 and O iii M49b 5g F[3] – 4f D[3]2 4442.02 lines. The Ne ii line contributes 40 – 50 per cent to the total intensity of the blend at 4442, while the contribution of the O iii line is negligible. The corrected intensity of the 4442.02 line is higher than the theoretical prediction (Table 3). The other two M55a lines, 4431.82 (4f D[5/2]2 – 3d 3P) and 4432.74 (4f D[5/2]3 – 3d 3P) are blended with several weak Ne ii line of the 4f – 3d transition array, whose effective recombination coefficients are unavailable.
B.8.14 Multiplet 58a, 4f G[7/2] – 3d 1Fo:
The 4552.53 (4f G[7/2]4 – 3d 1F) line is blended with the Ne ii M55d 4f 2[2] – 3d 4F3/2 4553.17 and Si iii M2 4p 3P – 4s 3S1 4552.62 lines, whose intensities are unknown. The other M58a line 4554.10 (4f G[7/2]3 – 3d 1F) is not observed.
B.8.15 Multiplet 58b, 4f G[9/2] – 3d 1Fo:
B.8.16 Multiplet 61a, 4f D[5/2] – 3d 1Po:
The 4694.64 (4f D[5/2]2 – 3d 1P) line is partially blended with the weak O ii M1 4696.35 (3p 4D – 3s 4P5/2) line. The 4694.64 line has an intensity that is 50 per cent higher than what is predicted (Table 3). The intensity of this line is unreliable due to the weakness.
Appendix C The O ii optical recombination spectrum
C.1 Multiplet 1, 3p 4Do – 3s 4P
See Section 3.3.1.
C.2 Multiplet 2, 3p 4Po – 3s 4P
The observed and predicted relative intensities of O ii M2 lines with most reliable measurements are presented in Table 26. The features of these lines as well as results of Gaussian profile fitting are shown in Fig. 43. 4349.43 is clearly observed. A single Gaussian profile fit to the feature of 4349.43 gives an intensity of 0.1950.029. The intensity ratio of the 4349.43 line to the O ii M1 4649.13 line is 0.292, slightly higher than the predicted value 0.274. The intensity of the 4349.43 line could be overestimated due to the saturated H i 4340 line (Fig. 43). The O ii M16 3p′ 2D – 3s′ 2D5/2 4351.26 and 3p′ 2D – 3s′ 2D3/2 4351.45 lines are also blended with the 4349.43 line, but their contributions are probably insignificant.
Another three M2 lines, 4317.14, 4319.63 and 4325.76, are less affected by the saturated H i 4340 line. 4317.14 blends with O ii M53a 4f D[3] – 3d 4P3/2 4317.70, and this blended feature is partially resolved from 4319.63 (Fig. 43). Three O ii M63c and two O ii M78b lines are blended with the left wing of 4317.14, and we treated these five O ii lines as a single component since they are all weak and have close wavelengths. Three Gaussian profiles were used to fit the complex. The resultant intensities of 4317.14 and 4319.63 both agree better with the newly predicted values (Table 26). The intensity contribution of the blended O ii M53a 4317.70 line was estimated from the most recent effective recombination coefficients and was subtracted. 4325.76 is free of blend, and its fitted intensity (with an uncertainty of 10–20 per cent) also agrees better with the intermediate coupling prediction. The main source of uncertainties in the 4325.76 intensity is due to the saturated H i 4340 line, while those in 4317.14 and 4319.63 are mainly due to blending.
Measurements of the remaining three M2 lines, 4336.86, 4345.56 and 4366.89, are difficult: the former two are blended with the saturated H i 4340 line, and the latter one is affected by [O iii] 4363 (Fig. 43). The measurement of 4366.89 seems to agree with the predicted intensity (Table 26). The fitting error of the 4363 intensity is 12 per cent, but the actual uncertainty could be even larger. The contributions of O iii M39a 5g G[4] – 4f F[3]3 4366.99 and O ii M75a 4f D[3] – 3d 2F5/2 4366.53 were assumed to be negligible.
| Line | ||||||
|---|---|---|---|---|---|---|
| 4317.14a | 3/2–1/2 | 0.397 | 0.553 | 0.551 | 1.388 | 0.996 |
| 4319.63 | 5/2–3/2 | 0.429 | 0.365 | 0.322 | 0.750 | 0.882 |
| 4325.76 | 1/2–1/2 | 0.079 | 0.119 | 0.147 | 1.861 | 1.235 |
| 4349.43 | 5/2–5/2 | 1.000 | 1.000 | 1.000 | 1.000 | 1.000 |
| 4366.89 | 3/2–5/2 | 0.429 | 0.578 | 0.640 | 1.492 | 1.107 |
- a
-
Corrected for the contribution from O ii M53a 4f D[3] – 3d 4P3/2 4317.70, which is about 15 per cent.
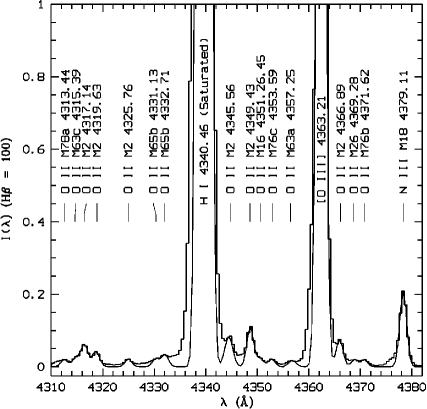
C.3 Multiplet 5, 3p 2Do – 3s 2P
Accurate measurements of the three M5 lines are difficult. 4414.90 (3p 2D – 3s 2P3/2) is partially resolved from another M5 line 4416.97 (3p 2D – 3s 2P1/2), as is shown in Fig. 44. 4414.90 coincides in wavelength O iii M46a 5g H[5] – 4f G[4]4 4414.85, whose contribution to the total flux of the blend at 4415 was estimated from the effective recombination coefficients of Kisielius & Storey ks1999 (1999). 4414.90 is also affected by at least three weak Ne ii lines from the 4f – 3d configuration, and for most these Ne ii lines, the effective recombination coefficients are not available. The 4416.97 line is blended with N ii M55b 4f D[3/2]2 – 3d 3P 4417.07, N ii M55b 4f D[3/2]1 – 3d 3P 4417.82, Ne ii M61d 4f 2[2] – 3d 2D5/2 4416.76 and Ne ii M61d 4f 2[2] – 3d 2D5/2 4416.77. The contributions of the two N ii lines to the total flux of the blend at 4417 were estimated from the new N ii effective recombination coefficients, while those of the two Ne ii lines could be negligible. The other line 4452.37 (3p 2D – 3s 2P3/2) is blended with O iii M49a 5g F[4] – 4f D[3]3 4454.03 and [Fe ii] 4452.10 (Fig. 44). The contribution from the O iii 4454.03 line was estimated from the effective recombination coefficients of Kisielius & Storey ks1999 (1999), but that of the [Fe ii] line is uncertain.
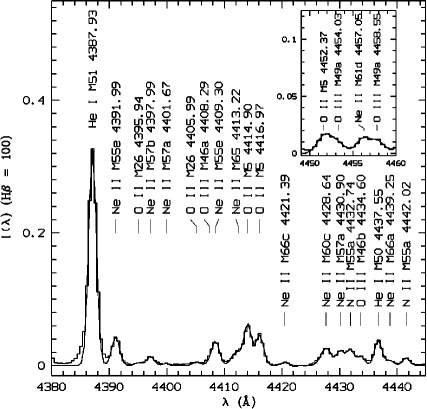
C.4 Multiplet 6, 3p 2Po – 3s 2P
The strongest M6 line 3973.26 (3p 2P – 3s 2P3/2) is blended with the saturated H i 3970 line (Fig. 45). 3945.04 (3p 2P – 3s 2P1/2) and 3954.36 (3p 2P – 3s 2P1/2) are free of blend, but are affected by the saturated [Ne iii] 3967 line (Fig. 45). The measured intensities of 3945.04 and 3954.36 are higher than the predicted values (in IC) by 45 and 83 per cent, respectively. Their measurements are of large uncertainties ( 30 per cent).
Accurate measurements of the other M6 line 3982.71 (3p 2P – 3s 2P3/2) are difficult due to the saturated H i 3970 line. It is also partially resolved from a weak feature that was identified as O iii M43 3d′ 3D1 – 4d 3P 3985.55. If this identification is correct, 3982.71 should blend with another O iii M43 line 3983.73. Unfortunately no effective recombination coefficients for O iii M43 are available for us to confirm the conjecture.
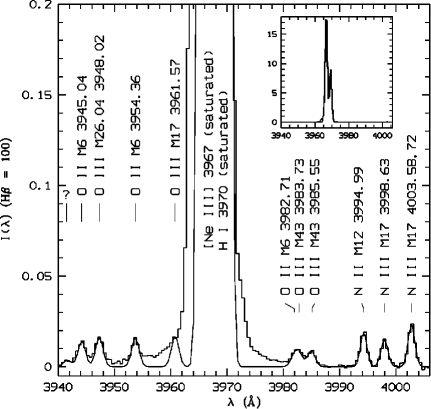
C.5 Multiplet 10, 3d 4F – 3p 4Do
See Section 3.3.2.
C.6 Multiplet 12, 3d 4D – 3p 4Do
The features of O ii M12 lines are shown in Fig. 46. 3882.19 (3d 4D7/2 – 3p 4D) is close to H i 3889, which may affect its measurement. A single-Gaussian profile fit yields an intensity value of 0.0840.005 for the 3882.19 line. The intensity of the 3882 line, which is more than 50 per cent higher than the predicted value, is overestimated due to the saturated [Ne iii] 3868. The other M12 lines are either much affected by the saturated [Ne iii] line or are not observed due to weakness.
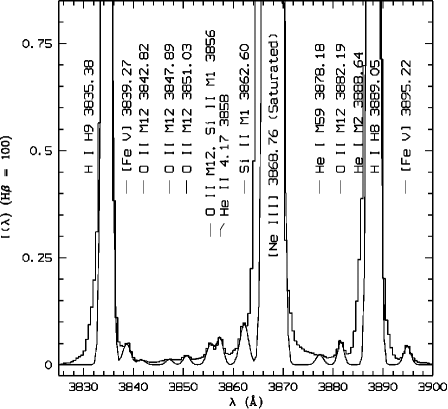
C.7 Multiplet 19, 3d 4P – 3p 4Po
The O ii M19 lines are observed in Fig. 47, and the observed and predicted relative intensities are presented in Table 27. 4169.22 blends with He i M52 6s 1S0 – 2p 1P 4168.97 and N ii M50a 4f 2[3]2 – 3d 3D 4169.38. The He i 4168.97 line contributes 30 per cent to the total intensity, which was estimated from the theoretical He i line intensities of Benjamin, Skillman & Smits bss99 1999, while the N ii line was assumed to be negligible. The resultant intensity of the 4169.22 line is 0.0820.008. The predicted intensity of this line is 0.090, which is derived from the most recent O ii effective recombination coefficients (the measured intensity of O ii M1 4649.13 was used). The measured intensity ratio of 4153.30 to 4169.22 is much higher than the predicted value. No explanation can be given for this large discrepancy except there is unknown blend.
Although the measured intensity of 4156.53 is also higher than theory, its actual intensity should agree well with the predicted value, given the fact that it is blended with N ii M50b 4f D[3/2]2 – 3d 3D 4156.39 and N ii M50b 4f D[3/2]1 – 3d 3D 4157.01, which contribute about 25 per cent to the total flux of the blend at 4156. The measurements of another two M19 lines 4129.32 and 4132.80 both agree with the newly predicted intensities. These two lines blend with three Si ii M3 4f 2Fo – 3d 2D lines 4128.07, 4130.87 and 4130.89, whose contributions to the total flux are negligible. 4140.70 is overestimated due to the strength of He i M53 6d 1D2 – 2p 1P 4143.76, which is more than 20 times stronger. Accurate measurements of the other line 4121.46 is impossible because it blends with He i M16 5s 3S – 2p 3Po 4120.99 and three O ii M20 lines (Fig. 47).
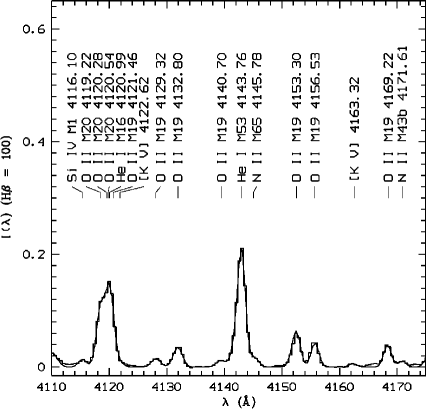
| Line | ||||||
|---|---|---|---|---|---|---|
| 4129.32 | 1/2–3/2 | 0.397 | 0.335 | 0.389 | 0.981 | 1.162 |
| 4132.80a | 3/2–1/2 | 0.397 | 0.768 | 0.918 | 2.311 | 1.195 |
| 4140.70b | 3/2–3/2 | 0.127 | 0.028 | 0.040 | 0.316 | 1.415 |
| 4153.30 | 5/2–3/2 | 0.429 | 0.909 | 1.363 | 3.180 | 1.500 |
| 4156.53c | 3/2–5/2 | 0.429 | 0.474 | 0.688 | 2.229 | 2.017 |
| 4169.22 | 5/2–5/2 | 1.000 | 1.000 | 1.000 | 1.000 | 1.000 |
- a
-
Probably including unknown blend.
- b
-
Overestimated due to He i M53 He i M53 6d 1D2 – 2p 1P 4143.76, which is stronger by early two orders of magnitude.
- c
-
Neglecting N ii M50b 4f D[3/2]2 – 3d 3D 4156.39 and N ii M50b 4f D[2]1 – 3d 3D 4157.01, which contribute about 4 per cent to the total intensity.
C.8 Multiplet 20, 3d 4D – 3p 4Po
Three O ii M20 lines 4119.22, 4120.28 and 4120.54 blend with He i M16 5s 3S – 2p 3Po 4120.99 and O ii M19 4121.46. Accurate measurements of the lines are difficult. Three Gaussian profiles (the He i 4120.99 and O ii M19 4121.46 lines are treated as a single component, and the two O ii 4120 lines are treated as another one) were used to fit the feature. The intensity ratio of the three O ii M20 lines (4120.28 + 4120.54)/4119.22 were assumed to be the predicted value (0.278), and the intensity of the He i 4120.99 line was estimated from the atomic data of Benjamin, Skillman & Smits bss99 (1999). The fitting results agree well with the observed spectrum, as is shown in Fig. 47. Accurate measurements of 4110.79 are also difficult due to the strong H i 4101 (Fig. 33). The other M20 lines are not observed.
C.9 Multiplet 25, 3d 2F – 3p 2Do
Fig. 48 shows two O ii M25 lines 4699.22 (5/2 – 3/2) and 4705.35 (7/2 – 5/2). 4699.22 is partially resolved from [Fe iii] 4701.53, and it also blends with O ii M40 3d′ 2F7/2 – 3p′ 2D 4699.00 which contributes about 30 per cent to the total flux of the blend at 4699. 4705.35 is affected by the much stronger [Ar iv] 4711. The measured intensity ratio 4699.22 : 4705.35 is 0.779 : 1.00, which agrees with the newly predicted ratio 0.765 : 1, and differs from the value in pure LS coupling, i.e. 0.7 : 1.0. Here the contribution of the blended O ii M40 4699.00 line has been subtracted.
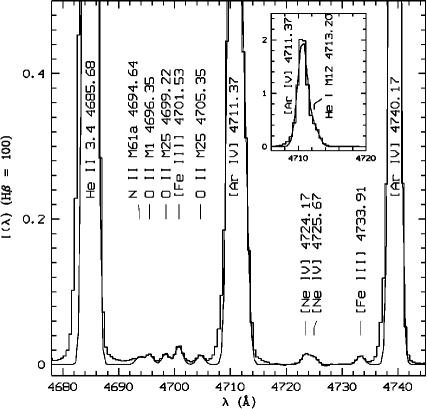
C.10 Multiplet 28, 3d 4P – 3p 4So
The three M28 lines are shown in Fig. 49. 4924.53 (5/2 – 3/2) is partially resolved from He i M48 4d 1D2 – 2p 1P 4921.93, and the other two 4890.86 (1/2 – 3/2) and 4906.83 (3/2 – 3/2) are free of blend. The observed relative intensity of the three lines is 1.0 : 3.52 : 5.73, which deviates from the pure LS coupling ratio 1 : 2 : 3, and also differs from the newly predicted ratio in the intermediate coupling scheme is 3.49 : 2.09 : 1.0.
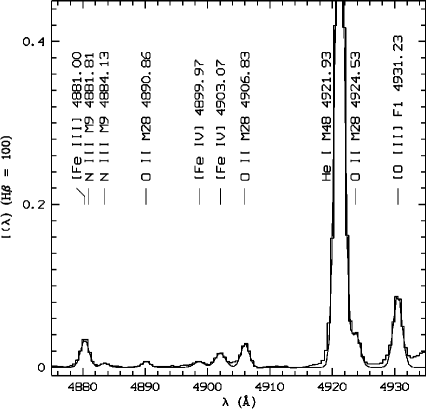
C.11 4f – 3d transitions
C.11.1 Multiplet 48a, 4f G[5]o – 3d 4F
See Section 3.3.3.
C.11.2 Multiplet 48b, 4f G[4]o – 3d 4F
4083.90 (4f G[4] – 3d 4F5/2) blends with O ii M10 3d 4F5/2 – 3p 4D 4085.11, which contributes more than 50 per cent to the total intensity. The other lines are not observed.
C.11.3 Multiplet 48c, 4f G[3]o – 3d 4F
4087.15 (4f G[3] – 3d 4F3/2) lies between the features of O ii M48a 4089.29 and O ii M10 4085.11. Its intensity given by the fit agrees with the predicted value (Table 6), while the measurement uncertainty is large due to weakness. Here the contributions of the blended N ii M38a 4f F[5/2]2 – 3d 3F 4086.83 and N ii M38a 4f F[5/2]3 – 3d 3F 4087.30 lines were assumed to be negligible. The other M48c lines are not observed.
C.11.4 Multiplet 50a, 4f F[4]o – 3d 4F
Only 4062.94 (4f F[4] – 3d 4F9/2) is observed, but its measurements are quite uncertain due to weakness.
C.11.5 Multiplet 50b, 4f F[3]o – 3d 4F
Only 4048.21 (4f F[3] – 3d 4F7/2) is observed. 4048.21 blends with 4047.80 (4f F[3] – 3d 4F7/2), whose intensity was assumed to be negligible. The measured intensity of 4048.21 is slightly higher than the current prediction, but its uncertainty could be large due to weakness. 4035.07 (4f F[3] – 3d 4F5/2) and 4035.46 (4f F[3] – 3d 4F5/2) blend with N ii M39a 4f G[7/2]3 – 3d 3F 4035.08 (Section 3.2.3), which contributes more than 80 per cent to the total intensity of the blend at 4035.
C.11.6 Multiplet 50c, 4f F[2]o – 3d 4F
4032.48 (4f F[2] – 3d 4F3/2) and 4033.16 (4f F[2] – 3d 4F3/2) blend with O ii M50a 4f F[4] – 3d 4F5/2 4032.25, and measurements are difficult. 4041.28 (4f F[2] – 3d 4F5/2) and 4041.95 (4f F[2] – 3d 4F5/2) blended with N ii M39b 4f G[9/2]5 – 3d 3F 4041.31, which contributes more than 90 per cent to the total intensity of the blend at 4041. The other line 4054.08 (4f F[2] – 3d 4F7/2) is not observed.
C.11.7 Multiplet 53a, 4f D[3]o – 3d 4P
Only 4303.82 (4f D[3] – 3d 4P5/2) is observed, which is shown in Fig. 34. It blends with another M53a line 4304.08 (4f D[3] – 3d 4P5/2) and O ii M65a 4f G[5] – 3d 4D7/2 4303.61, whose total intensity contribution to the blend amounts to about 15 per cent. The resultant measured intensity of 4303.83 agrees well with the most recent predicted value (Table 6). The other line 4317.70 (4f D[3] – 3d 4P3/2) is blended with O ii M2 3p 4P – 3s 4P1/2 4317.14 which is 5 – 6 times stronger.
C.11.8 Multiplet 53b, 4f D[2]o – 3d 4P
4294.78 (4f D[2] – 3d 4P3/2) coincides in wavelength with 4294.92 (4f D[2] – 3d 4P3/2) which contributes about 12 per cent to the total intensity of the feature at 4295. The total intensity of the two 4295 lines agrees with the new prediction. Another line 4307.23 (4f D[2] – 3d 4P1/2) is too weak to perform accurate measurements although it is observed (Fig. 34). The other M53b lines are not observed.
C.11.9 Multiplet 53c, 4f D[1]o – 3d 4P
4288.82 is a blend of two M53c lines (4f D[1] – 3d 4P1/2 and 4f D[1] – 3d 4P1/2). The measured intensity of 4288.82 agrees with the newly predicted value, but is much lower than the one predicted based on the previous calculations (Table 6). The other lines are not observed.
C.11.10 Multiplet 55, 4f G[3]o – 3d 4P
4291.25 (4f G[3] – 3d 4P5/2) blends with O ii M78c 4f F[2] – 3d 2F5/2 4292.21, which contributes about 38 per cent to the total intensity. The contribution from O ii 4291.86 (4f G[3] – 3d 4P5/2) was assumed to be negligible. The other line 4305.39 is not observed.
C.11.11 Multiplet 63a, 4f D[3]o – 3d 4D
Measurements of 4357.25 (4f D[3] – 3d 4D5/2 and 4f D[3] – 3d 4D3/2) are affected by [O iii] 4363, as well as the saturated H i 4340 line (Fig. 43). The other M63a lines are not observed.
C.11.12 Multiplet 65a, 4f G[5]o – 3d 4D
4303.61 (4f G[5] – 3d 4D7/2) blends with O ii M53a 4f D[3] – 3d 4P5/2 4303.82, which is about 7 – 8 times stronger, and O ii M53a 4f D[3] – 3d 4P5/2 4304.08, which contributes about 3 per cent to the total intensity of the blend at 4304.
C.11.13 Multiplet 65b, 4f G[4]o – 3d 4D
Measurements of this multiplet are difficult due to the saturated H i 4340 line.
C.11.14 Multiplet 65c, 4f G[3]o – 3d 4D
Measurements of this multiplet are difficult due to the saturated H i 4340 line.
C.11.15 Multiplet 67a, 4f F[4]o – 3d 4D
In Fig. 34, the three lines of this multiplet blend with several O ii ORLs of the 4f – 3d transition array. Using the effective recombination coefficients of PJS, we estimated that O ii M67a 4275.55 contributes about 35 per cent to the broad feature at 4275, which is formed by more than 10 O ii ORLs from the 4f – 3d configuration. The other two M67a lines contribute very little.
C.11.16 Multiplet 67b, 4f F[3]o – 3d 4D
Measurements of this multiplet are difficult due to the reason given in Section C.11.15. Using the new O ii effective recombination coefficients, we estimated that the 4276.75 (4f F[3] – 3d 4D5/2) line, which is the strongest in O ii M67b, contributes about 17 per cent to the total intensity of the feature at 4275.
C.11.17 Multiplet 67c, 4f F[2]o – 3d 4D
Measurements of this multiplet are difficult due to blending.
C.11.18 Multiplet 76b, 4f G[4]o – 3d 2F
4371.62 (4f G[4] – 3d 2F7/2) blends with 4371.24 (4f G[4] – 3d 2F7/2) whose intensity contribution was assumed to be negligible. The measurement of 4371.62 agrees with the predicted intensity, but this intensity could be of large uncertainty due to weakness as well as the strength of [O iii] 4363.
C.11.19 Multiplet 76c, 4f G[3]o – 3d 2F
Only 4353.59 (4f G[3] – 3d 2F5/2) is observed, which is shown in Fig. 43. Its fitted intensity is higher than the newly predicted value. This measurement is overestimated due to the saturated H. The intensity contribution from 4354.18 (4f G[3] – 3d 2F5/2) was assumed to be negligible (only about 6 per cent). The other two M76c lines 4384.70 and 4385.32 are blended with He i M51 5d 1D2 – 2p 1P 4387.93 (Fig. 44).
C.11.20 Multiplet 78a, 4f F[4]o – 3d 2F
The measured intensity of 4313.44 (4f F[4] – 3d 2F7/2) agrees with the most recent prediction, but is probably of large uncertainty due to weakness. Here the contribution from 4312.11 (4f F[4] – 3d 2F7/2), which is about 32 per cent, has been corrected for. The other line 4282.01 (4f F[4] – 3d 2F5/2) is not observed.
C.11.21 Multiplet 78b, 4f F[3]o – 3d 2F
4285.69 (4f F[3] – 3d 2F5/2) blends with 4285.21 (4f F[3] – 3d 2F5/2) which contributes only about 1 per cent to the total intensity. It is also partially resolved from a feature at 4283, which is a blend of O ii M67c 4f F[2] – 3d 4D3/2 4282.96 and Ne ii M57c 4f 1[3] – 3d 4F7/2 4283.73. The fitted intensity of 4285.69 agrees with predicted value. The other lines are not observed.
C.11.22 Multiplet 86a, 4f D[3]o – 3d 2P
In Fig. 35, 4491.23 (4f D[3] – 3d 2P3/2) is partially resolved from a feature at 4488 which is a blend of the O ii M104 4f′ D[2] – 3d′ 2P1/2 lines (4487.72 3/2 – 1/2, and 4488.20 5/2 – 3/2 and 3/2 – 3/2) and O ii M86b 4f D[2] – 3d 2P1/2 4489.49. Four Gaussian profiles were used to fit the complex. Since the effective recombination coefficients for the O ii M104 lines are not available, we assumed that their relative intensities are as in pure LS coupling, i.e. 5 : 9 : 1. The resultant intensity of 4491.23 agrees well with the most recent theoretical value.
C.11.23 Multiplet 86b, 4f D[2]o – 3d 2P
4489.49 (4f D[2] – 3d 2P1/2) blends with O ii M104 4488.20 and O ii M86a 4491.23. The fitted intensity of 4489.49 agrees with the newly predicted value quite well. Details of line fits are given in Section C.11.22. Accurate measurements of 4466.41, 59 are difficult due to He i 4471, which is stronger by more than two orders of magnitude.
C.11.24 Multiplet 88, 4f G[3]o – 3d 2P
4477.90 (4f G[3] – 3d 2P3/2) is observed in Fig. 35. It is blended with O iii M45a 5g H[11/2] – 4f G[9/2]5 4477.91, which contributes about 1–2 per cent to the total intensity and thus is negligible (an estimate based on the effective recombination coefficients for the O iii 5g – 4f recombination spectrum given by Kisielius & Storey ks1999 1999). The measured intensity of 4477.90 agrees well with the newly predicted value (Table 6).
C.11.25 Multiplet 92a, 4f F[4]o – 3d 2D
4609.44 (4f F[4] – 3d 2D5/2) is observed in Fig. 42. It blends with O ii M92c 4f F[2] – 3d 2D3/2 4610.20 and O ii M92c 4f F[2] – 3d 2D3/2 4611.07, which contribute about 20 per cent to the total intensity. After subtracting the blend, the resultant intensity of 4609.44 agrees well with the new prediction (Table 6).
C.11.26 Multiplet 92b, 4f F[3]o – 3d 2D
4602.13 (4f F[3] – 3d 2D3/2) is observed in Fig. 42. It blends with N ii M5 3p 3P2 – 3s 3P 4601.48, which contributes about 26 per cent to the total intensity. Subtraction of the blend gives an intensity of 4602.13 that agrees well with the most recent prediction. The contribution from Ne ii M64d 4f 2[2] – 3d 4P5/2 4600.16 was assumed to be negligible. Fig. 42 also shows the weak feature of 4613.14 (4f F[3] – 3d 2D5/2) which blends with 4613.68 (4f F[3] – 3d 2D5/2). The total measured intensity of the two lines agrees with both of the predicted values (Table 6). Correction has been made for the contribution from N ii M5 3p 1P1 – 3s 3P 4613.87, which is about 7 per cent, and the contribution from Ne ii M64b 4f 2[3] – 3d 4P5/2 4612.93 was assumed to be negligible.
Appendix D The Ne ii optical recombination spectrum
D.1 Multiplet 1, 3p 4Po – 3s 4P
Fig. 55 shows that 3694.21 (3p 4P – 3s 4P5/2) lies between the two H i lines H18 3691.55 and H17 3697.15. The fitted intensity of 3694.21 is 0.2540.026. This measurement agrees with the values of LLB01: 0.294 (ESO 1.52 m) and 0.224 (WHT). Another M1 line 3777.14 (3p 4P – 3s 4P1/2) is observed in Fig. 51. Its measured intensity is 0.050, with an uncertainty of about 20 to 25 per cent, and also agrees with LLB01: 0.045 (ESO 1.52 m) and 0.059 (WHT). The intensity ratio 3777.14/3694.21 is 0.195, lower than the LS coupling ratio 0.397. The other lines are not observed.
D.2 Multiplet 2, 3p 4Do – 3s 4P
See Section 3.4.1.
D.3 Multiplet 5, 3p 2Do – 3s 2P
Fig. 55 shows that 3713.08 (3p 2D – 3s 2P3/2) is blended with H i H15 3711.97, which is more than 5 times stronger. Also blended here is O iii M3 3d 3D – 3p 3P2 3715.08. Three Gaussian profiles were used to fit the complex, and the fitted intensity of 3713.08 is 0.306, which could be of large uncertainty (over 50 per cent). The intensity ratio of 3713.08 to Ne ii M2 3334.84 agrees with the LS coupling ratio. The other M2 lines are not observed.
D.4 Multiplet 6, 3p 2So – 3s 2P
3481.93 (3p 2S – 3s 2P3/2) is partially resolved from He i M43 15d 3D – 2p 3Po 3478.97, which is about 2 times stronger. The fitted intensity of 3481.93 is 0.043, which is slightly lower than LLB01 (0.051). The other line 3557.81 is not observed.
D.5 Multiplet 8, 3d 4D – 3p 4Po
The wavelengths of the Ne ii M8 lines are in the range 3017 – 3054 Å. The blue cutoff of our spectrum is around 3040 Å, and only three lines have the wavelengths longer than this cutoff. Measurements of these lines are difficult: The 3045.56 and 3047.56 lines are blended with the much stronger O iii M4 3047.12 (3p 3P2 – 3s 3P) line, which is affected by the Bowen fluorescence mechanism; the 3054.67 line is not observed.
D.6 Multiplet 12, 3d 4D – 3p 4Do
The intensity of 3329.16 is 0.053, which is slightly higher than that of LLB01 (0.0464). This measurement is of large uncertainty due to weakness of the line, as is shown in Fig. 52. Another M12 line 3366.98 blends with Ne ii M20 3d 2F7/2 – 3p 2D 3367.22 (Fig. 50), which contributes more than 90 per cent to the total intensity. The other M12 lines are not observed.
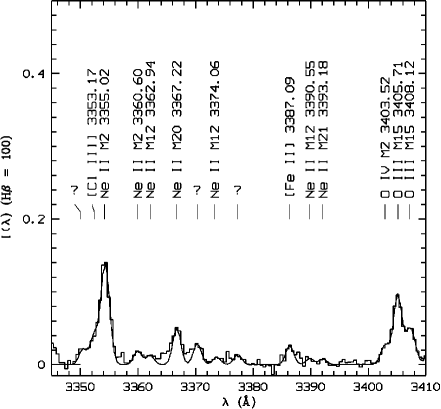
D.7 Multiplet 13, 3d 4F – 3p 4Do
See Section 3.4.2.
D.8 Multiplet 20, 3d 2F – 3p 2Do
3367.22 (3d 2F7/2 – 3p 2D) blends with Ne ii M12 3d 4D7/2 – 3p 4D 3366.98, whose intensity contribution is negligible (Section D.6). The fitted intensity of 3367.22 is 0.1060.016, which agrees with that of LLB01 (0.110). The other M20 lines are not observed.
D.9 Multiplet 21, 3d 2D – 3p 2Do
Fig. 40 shows that 3416.91 (3d 2D5/2 – 3p 2D) is partially resolved from O iii M15 3d 3P – 3p 3P1 3415.26, which is excited by the Bowen fluorescence mechanism. It also blends with Ne ii M19 3d 4F7/2 – 3p 2D 3417.69, whose intensity contribution is unknown due to the lack of atomic data. The total intensity of the feature at 3417 given by fit is 0.114, higher than the measurement of LLB01 (0.0825). The other M21 lines are not observed.
D.10 Multiplet 28, 3d 2P – 3p 2So
The fitted intensity of 3456.61 (3d 2P3/2 – 3p 2S) is 0.031, which is slightly lower than the intensity value 0.0334 given by LLB01. Here the contribution from He i 19d 3D – 2p 3Po 3456.86 was assumed to be negligible. The other line 3503.58 is not observed.
D.11 Multiplet 34, 3d 4P – 3p 4So
The measured intensity of 3542.85 (3d 4P5/2 – 3p 4S) and is 0.031, which agrees with the measurement given by LLB01 (0.0325). Fig. 37 shows that 3565.82 (3d 4P3/2 – 3p 4S) is partially resolved from Ne ii M9 3p′ 2F – 3s′ 2D5 3568.50, which is about 7 times stronger. The fitted intensity of 3565.82 is 0.025, with a relatively large uncertainty due to the weakness. This measurement also agrees with that of LLB01 (0.0243). The intensity ratio of these two M34 lines is thus 1.24 : 1.0, which differs from the LS coupling value 1.5 : 1. The other line 3594.16 is not observed.
D.12 Multiplet 9, 3p′ 2Fo – 3s′ 2D
See Section 3.4.3.
D.13 4f – 3d transitions
D.13.1 Multiplet 55e, 4f 2[5]o – 3d 4F
See Section 3.4.4.
D.13.2 Multiplet 52a, 4f 2[4]o – 3d 4D
4219.75 (4f 2[4] – 3d 4D7/2) blends with Ne ii M52a 4f 2[4] – 3d 4D7/2 4219.37 and Ne ii M52d 4f 2[2] – 3d 4D5/2 4220.89 (Fig. 31). The intensity contribution of 4219.37 (a few per cent) could be negligible. The fitted intensity of 4219.75 is 0.064, which agrees with the measurements given by LLB01: 0.0674 (ESO 1.52 m), 0.0699 (WHT 1996) and 0.0616 (WHT 1997). This measurement is higher than the predicted value (Table 8). The measured intensity of the other line 4233.85 agrees well with LLB01, but is higher than the predicted value. This measurement is probably unreliable due to weakness of the 4233.85 line.
D.13.3 Multiplet 52b, 4f 2[3]o – 3d 4D
The measured intensity of 4231.64 (4f 2[3] – 3d 4D5/2) is 0.027, which agrees with the measurements of LLB01: 0.0244 (ESO 1.52m), 0.0328 (WHT 1996) and 0.0237 (WHT 1997). Here the contribution of 4231.53 (4f 2[3] – 3d 4D5/2) is included. The intensity of another M52b line 4250.65 is 0.016, and it also agrees with those of LLB01: 0.0169 (ESO 1.52 m) and 0.0154 (WHT 1996), and 0.0121 (WHT 1997). Both measurements are higher than the predicted values (Table 8), thus 4231.64 and 4250.65 are not used for abundance determinations. The other two lines 4217.17 and 4217.15 are too faint to measure accurately.
D.13.4 Multiplet 57b, 4f 1[4]o – 3d 4F
Only 4397.99 (4f 1[4] – 3d 4F5/2) is observed (Fig. 44). Its fitted intensity is 0.0240.004. This intensity value is slightly higher than those given by LLB01: 0.0219 (ESO 1.52 m), 0.0184 (WHT 1996) and 0.0185 (WHT 1997), but agrees with the predicted value within errors (Table 8). The other M57b lines are not observed.
D.13.5 Multiplet 60c, 4f 1[3]o – 3d 2F
Only 4428.64 (4f 1[3] – 3d 2F5/2) is observed, and its fitted intensity is 0.044, which agrees with the measurements given by LLB01: 0.0483 (ESO 1.52 m), 0.0451 (WHT 1996) and 0.0479 (WHT 1997). Here the contribution from Ne ii M61b 4f 2[3] – 3d 2D5/2 4428.52 is included, but the other two blended lines Ne ii M60c 4f 1[3] – 3d 2F5/2 4428.52 and Ne ii M61b 4f 2[3] – 3d 2D5/2 4428.41 were assumed to be negligible.
D.13.6 Multiplet 61a, 4f 2[4]o – 3d 2D
The measured intensity of 4430.94 (4f 2[4] – 3d 2D5/2) is 0.040, which is higher than the observations of LLB01: 0.0331 (ESO 1.52 m), 0.0340 (WHT 1996) and 0.0317 (WHT 1997). This measurement is of large uncertainty due to blending. The contribution from Ne ii M57a 4f 1[2] – 3d 4F3/2 4430.90 and Ne ii M55a 4f 2[4] – 3d 4F7/2 4430.06 are included, but Ne ii M57a 4f 1[2] – 3d 4F3/2 4431.11 was assumed to be negligible.
D.13.7 Multiplet 61d, 4f 2[2]o – 3d 2D
4457.05 (4f 2[2] – 3d 2D3/2) is partially resolved from O iii M49a 5g F[4] – 4f D[3]2 4458.55 (Fig. 35). The fitted intensity of 4457.05 is 0.026, with an uncertainty of about 20 per cent. Here the contribution from Ne ii M66c 4f 1[3] – 3d 4P5/2 4457.36 is included, but the other two blended lines Ne ii M61d 4f 2[2] – 3d 2D3/2 4457.24 and Ne ii M66c 4f 1[3] – 3d 4P5/2 4457.24 were assumed to be negligible. This measurement agrees with those of LLB01: 0.0250 (ESO 1.52 m), 0.0247 (WHT 1996) and 0.0211 (WHT 1997), but is much higher than the predicted value (Table 8). The other M61d lines are not observed.
D.13.8 Multiplet 65, 4f 0[3]o – 3d 4P
4413.22 (4f 0[3] – 3d 4P5/2) blends with O ii M5 3p 2D – 3s 2P3/2 4414.90 (Fig. 44). The fitted intensity of 4413.22 is 0.028, which agrees with the measurements of LLB01: 0.0296 (ESO 1.52 m), 0.0243 (WHT 1996) and 0.0271 (WHT 1997), but is higher than the predicted value (Table 8). Here the contribution from Ne ii M65 4f 0[3] – 3d 4P5/2 4413.11 was assumed to be negligible, but Ne ii M57c 4f 1[3] – 3d 4F3/2 4413.11 is included. The other line 4377.98 blends with N iii M18 4379.
D.13.9 Multiplet 66c, 4f 1[3]o – 3d 4P
4421.39 (4f 1[3] – 3d 4P3/2) is observed in Fig. 44. Its fitted intensity is 0.0084. The uncertainty of this measurement could be large due to weakness of this line. The other two M66c lines 4457.24 and 4457.36 blend with Ne ii M61d 4f 2[2] – 3d 2D3/2 4457.05.
Appendix E The N iii permitted lines
E.1 Multiplet 1, 3p 2Po – 3s 2S
4097.33 is partially resolved from H i 4101 (Fig. 33). Its fitted intensity is 2.2460.112. Several O ii and N ii ORLs are blended with 4097.33, and they contribute about 15–20 per cent to the total intensity. The other line 4103.39 blends with H i 4101, and contributes less than 1 per cent to the total intensity.
E.2 Multiplet 2, 3d 2D – 3p 2Po
Measurements of this multiplet are presented in Section 3.3.1. Here the ratio of the two lines 4634.14 and 4641.85 were assumed to be as in LS coupling. The resultant intensities of the 4634.14, 4640.64 and 4641.85 lines are 1.133, 2.262 and 0.226, respectively, and the uncertainties are all less than 10 per cent. Thus the intensity ratio of 4640.64 to 4641.81 is 10 : 1, which differs from the pure LS coupling ratio, i.e. 9 : 1.
E.3 Multiplet 3, 3p′ 4D – 3s′ 4Po
See Section 3.6.1.
E.4 Multiplet 6, 3p′ 2D – 3s′ 2Po
4195.76 (3p′ 2D3/2 – 3s′ 2P) is observed in Fig. 31. Its measured intensity is 0.0460.008. Here the intensity contribution from N ii M49a 4f 2[4]3 – 3d 3D 4195.97, which is about 8 per cent, has been corrected for. Another line 4215.77 (3p′ 2D3/2 – 3s′ 2P) is partially resolved from Ne ii M52b 4f 2[3] – 3d 4D7/2 4217.17. Two Gaussian profiles were used to fit the complex, and the fitted intensity of 4215.77 is 0.0086, with an uncertainty of more than 20 per cent. Thus the ratio 4195.76.4215.77 is 0.185, slightly higher than the LS coupling value (0.20). This is interesting because these two lines decay from the same upper level, thus their intensity ratio depends only on the coupling scheme. The other line 4200.10 (3p′ 2D5/2 – 3s′ 2P) blends with He ii 11g 2G – 4f 2Fo 4199.83 which is probably about 4 times stronger.
E.5 Multiplet 9, 3d′ 4Fo – 3p′ 4D
Only 4881.81 (3d′ 4F – 3p′ 4D5/2) and 4884.13 (3d′ 4F – 3p′ 4D7/2) are observed (Fig. 49). 4881.81 blends with [Fe iii] 4881.00, whose intensity contribution is unknown. Measurements of 4884.13 are of large uncertainty due to weakness of the line.
E.6 Multiplet 12, 5s 2S – 4p 2Po
Measurements of 4544.85 (5s 2S1/2 – 4p 2P) could be overestimated due to the strength of He ii 9g 2G – 4f 2Fo 4541.59 (Fig. 38), which is more than 10 times stronger. The other line 4539.71 is blended with He ii 4541.59.
E.7 Multiplet 17, 5f 2Fo – 4d 2D
3998.63 (5f 2F – 4d 2D3/2) is detected in Fig. 45. Its fitted intensity is 0.0250.005. The other two lines 4003.58 and 4003.72 are blending together. The measured intensity ratio (4003.58 + 4003.58)/3998.63 is 1.54, which agrees with the value in LS coupling, i.e. 1.50.
E.8 Multiplet 18, 5g 2G – 4f 2Fo
See Section 3.6.2.
Appendix F The O iii permitted lines
F.1 Multiplet 2, 3p 3D – 3s 3Po
Table 28 presents the observed and predicted relative intensities of the O iii M2 lines detected in NGC 7009. Fig. 51 shows the observed M2 lines. 3757.24 is partially resolved from 3754.69 and 3759.87. Three Gaussian profile fits were used to fit the complex, and resultant relative intensities deviate from LS coupling. The uncertainty of the 3757.24 intensity is the largest among the three (over 30 per cent), because it also blends with He i M66 14d 1D2 – 2p 1P 3756.10, whose contribution is unknown, and He ii 23g 2G – 4f 2Fo 3758.15, which contributes less than 10 per cent to the total intensity (an estimate based on the hydrogenic theory of Storey & Hummer sh1995 1995). The uncertainties of 3754.69 and 3759.87 are both less than 5 per cent. Measurements of 3774.02 is probably of large error due to the strength of H i H11 3770.63, which is more than 20 times stronger. Another line 3791.27 is free of blend, but its fitted intensity is 45 per cent lower than the value in pure LS coupling. The other line 3810.99 is not observed. Both of the line ratios 3791.27/3754.69 and 3774.02/3757.24, where the two lines of each of the ratios decay from the same upper levels, differ from the LS coupling assumption, and agree with the measurements given by Liu et al. 1993a for NGC 7009. Discussion of these line ratios is in Section 3.7.4.
| Line | ||||
|---|---|---|---|---|
| 3754.69 | 2–1 | 0.536 | 0.361 | 0.673 |
| 3757.24 | 1–0 | 0.238 | 0.196 | 0.823 |
| 3759.87 | 3–2 | 1.000 | 1.000 | 1.000 |
| 3774.02 | 1–1 | 0.179 | 0.092 | 0.516 |
| 3791.27 | 2–2 | 0.179 | 0.098 | 0.548 |
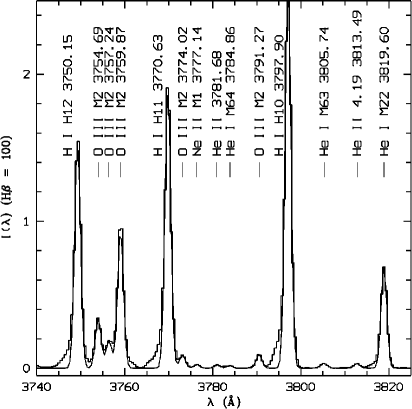
F.2 Multiplet 3, 3p 3S – 3s 3Po
Fig. 52 shows the observed O iii M3 lines in NGC 7009. 3340.76 blends with the [Ne iii] auroral line 2p4 1S0 – 2p4 1D2 3342.50 and Ne ii M2 3p 4D – 3s 4P1/2 3344.40. The intensity of [Ne iii] 3342.50 was estimated from the theoretical nebular-to-auroral line ratio (3868.76 + 3967.47)/3342.50 which was calculated by solving the population equations for a five-level atomic model at a particular and . We estimated that [Ne iii] 3342.50 contributes about 12 per cent to the total intensity of the blend at 3341. The contribution from Ne ii M2 3344.40 is negligible. The resultant 3299.40/3340.76 and 3312.32/3340.76 ratios are discussed in Section 3.7.4.
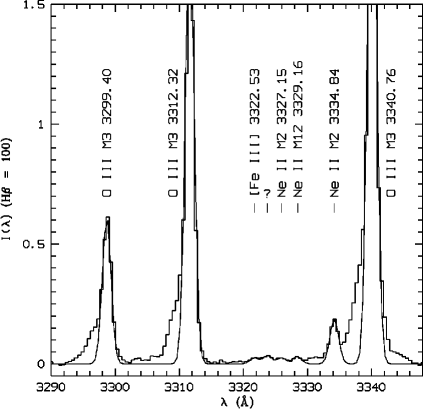
F.3 Multiplet 4, 3p 3P – 3s 3Po
Only 3047.12 and 3059.30 are observed in the near-UV, but their measurements are quite unreliable due to poor S/N.
F.4 Multiplet 5, 3p 1P – 3s 1Po
5592.24 is observed in Fig. 53. Its fitted intensity is 0.047, which is slightly lower than the observation of Liu & Danziger 1993a : 0.05100.0031. The uncertainty of the current measurement is about 10 per cent.
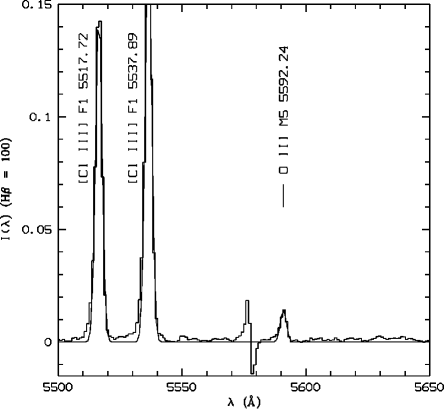
F.5 Multiplet 8, 3d 3Fo – 3p 3D
See Section 3.7.1.
F.6 Multiplet 12, 3d 3Po – 3p 3S
The O ii M12 lines are shown in Fig. 54. The fitted intensity of 3132.79 is 37.81, with an uncertainty of about 7 per cent. Our measurement is lower than that of Liu & Danziger 1993a : 43.44.3. The measured intensity ratio of the three lines 3115.68 : 3121.64 : 3132.79 is 1 : 13 : 343, which differs significantly from the ratio in the pure LS coupling assumption, i.e. 1 : 3 : 5. That is because this multiplet is mainly excited by the Bowen fluorescence mechanism.
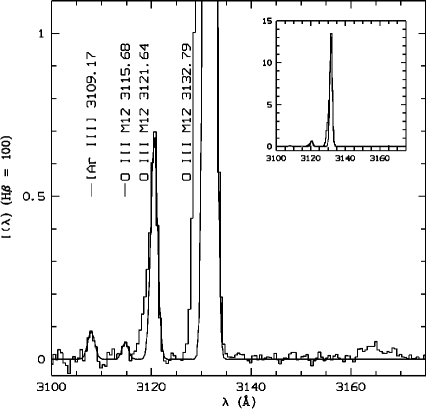
F.7 Multiplet 14, 3d 3Do – 3p 3P
3715.08 (3d 3D – 3p 3P2) is partially blended with H i H15 3711.97 (Fig. 55). Also blended here are 3714.03 (3d 3D – 3p 3P1), Ne ii M5 3p 2D – 3s 2P3/2 3713.08 and He ii 29g 2G – 4f 2Fo 3715.16. Reliable measurements of the two M14 lines are difficult. Accurate measurements of another line 3707.25 are also difficult due to weakness. The other lines are not observed.
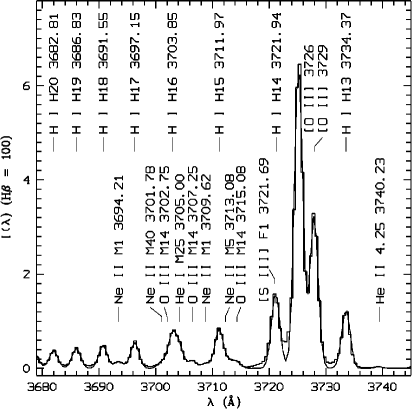
F.8 Multiplet 15, 3d 3Po – 3p 3P
See Section 3.7.2.