Interstellar C
Buckminsterfullerene (C60 ) has recently been detected through its infrared emission bands in the interstellar medium (ISM), including in the proximity of massive stars, where physical conditions could favor the formation of the cationic form, C. In addition, Cwas proposed as the carrier of two diffuse interstellar bands in the near-IR, although a firm identification still awaits gas-phase spectroscopic data. We examined in detail the Spitzer IRS spectra of the NGC 7023 reflection nebula, at a position close (7.5”) to the illuminating B star HD 200775, and found four previously unreported bands at 6.4, 7.1, 8.2, and 10.5 m, in addition to the classical bands attributed to polycylic aromatic hydrocarbons (PAHs) and neutral C60 . These 4 bands are observed only in this region of the nebula, while C60 emission is still present slightly farther away from the star, and PAH emission even farther away. Based on this observation, on theoretical calculations we perform, and on laboratory studies, we attribute these bands to C. The detection of C confirms the idea that large carbon molecules exist in the gas phase in these environments. In addition, the relative variation in the C60 and C band intensities constitutes a potentially powerful probe of the physical conditions in highly UV-irradiated regions.
1 Introduction
The mid-infrared (mid-IR) spectrum of galactic and extragalactic objects exhibits band emission (strongest at 3.3, 6.2, 7.7, 8.6, and 11.2 m) attributed to carbonaceous macromolecules, i.e., polycyclic aromatic hydrocarbons (PAHs, see recent state of the art in Joblin & Tielens 2011). In addition to PAH bands, IR emission bands at 7.0, 8.5, 17.4, and 19.0 m have recently been reported (Cami et al., 2010; Sellgren et al., 2010), and found to match quite closely the IR active bands of buckminsterfullerene (C60, Kroto et al. 1985), a cage-like carbon molecule. Carbonaceous macromolecules, including PAHs, carbon clusters, or fullerenes, are believed to play a fundamental role in the physics and chemistry of the interstellar medium (ISM), and their infrared signatures are commonly used as a tracer of physical conditions. Nevertheless, C60 is the only molecule belonging to this family, which has been specifically identified in the ISM. In the NGC 7023 reflection nebula, Sellgren et al. (2010) have shown that C60 is predominantly found in the regions closest to the star. In that part of the nebula, UV irradiation is high (above times the interstellar standard radiation field), and PAH molecules are ionized (Rapacioli et al., 2005; Berné et al., 2007; Pilleri et al., 2012), if not destroyed (Berné & Tielens, 2012; Montillaud et al., 2012). One could therefore expect C to be present in these regions.
Foing & Ehrenfreund (1994) reported evidence of interstellar C based on the detection of two diffuse interstellar bands (DIBs) at 9577 and 9632 Å, however this identification is still questioned considering that no spectrum of C could be recorded yet, in conditions appropriate for DIB identification, i.e., in gas phase and at low temperature. The IR spectrum of C was measured in a rare-gas matrix by Fulara et al. (1993) and was found to exhibit two bands at 7.1 and 7.5 m. Kern et al. (2012) have performed new spectroscopic measurements and suggests that the latter band is due to C, whereas the authors attribute a band at 6.4 m to C. Moutou et al. (1999) derived upper limits on the abundance of C in NGC 7023 based on not detecting the 7.1 (and possibly wrongly attributed 7.5 m) bands. So far, there has been no observational evidence of any 7.1 or 6.4 m bands in astronomical sources.
Looking carefully at the Spitzer data of NGC 7023, we found four emission bands, at 6.4, 7.1, 8.2, and 10.5 m, which are only present in the regions closest to the star. This also corresponds to a region where C60 emission is strong. A natural carrier to explain these bands is C, and this assertion is supported by spectroscopic arguments that we discuss hereafter.
2 Observations
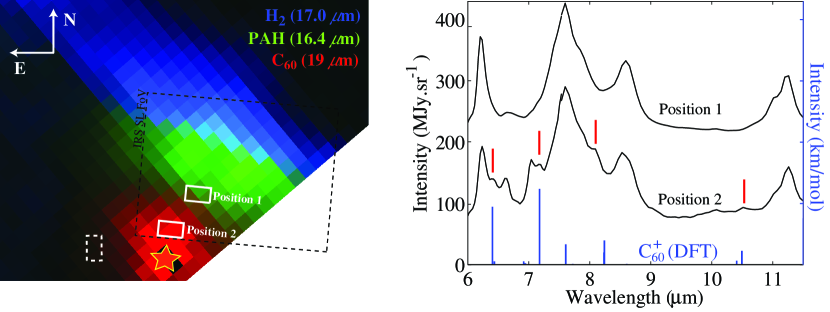
NGC 7023 was observed with the short-low (SL) and long-low (LL) modules of the InfraRed Spectrograph (IRS, Houck et al. 2004 onboard Spitzer (Werner et al., 2004) in spectral mapping mode. The spectral resolution of IRS is . The slit width (comparable to angular resolution) is 3.6” for the SL and 10.5” for the LL modules. Data reduction was performed with the CUBISM software (Smith et al., 2007) and consisted in cube assembling, calibration, flux correction for extended sources and bad pixel removal. From the LL data cube we extracted maps integrated in the H2 line at 17.0 m, the PAH band at 16.4 m and the C60 band at 19.0 m. The maps are presented in Fig. 1 in a fashion similar to Sellgren et al. (2010). From the SL data cube, we extracted two significant spectra corresponding to different regions in the nebula (Fig. 1). The extraction regions were 3x5 pixels (1.6”/pixel) to improve the signal-to-noise ratio. Position 1 corresponds to the cavity of atomic gas between the star and the molecular cloud at an angular distance of 21” ( 0.04 pc) from the star HD 200775 (=21:01:34.8, =+68:10:07.3). Position 2 (=21:01:37.3, =+68:09:55.3) is the closest position to the star in the IRS spectral cube (7.5”, 0.015 pc from HD 200775, see Fig. 1). These two positions correspond to regions where C60 emission is strong in the 19.0 m band (Fig. 1). For both positions the signal-to-noise ratio is very good and ranges between 100 and 200.
3 Observational results
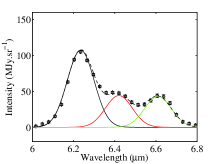
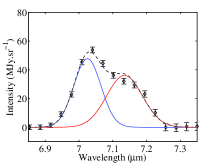
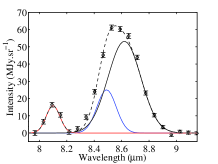
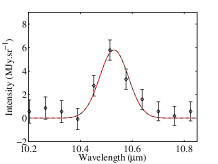
The spectra (Fig. 1) have in common that they are dominated by bands at 6.2, 7.7, 8.6, and 11.2 m, which are attributed to vibrational modes of PAH molecules (Tielens, 2005). In addition to these bands, the spectrum at position 2 shows several bands that are absent in the rest of the nebula. These are at 6.4, 6.6, 7.0, 7.1, 8.2, and 10.5 m (Fig. 1). These bands are seen in several pixels of the IRS cube and well above the instrumental errors (Fig. 2). To derive the precise parameters for these bands we fit them using Gaussian profiles (Fig. 1) and splines to subtract the underlying emission due to the wings of PAH bands. The positions, widths, and intensities of the bands are given in Table 1. The 7.0 m band has been attributed to C60 (Sellgren et al., 2010). The 6.6 m band has recently been attributed to (possible) planar C24 (García-Hernández et al., 2011). The 6.4, 7.1, 8.2, and 10.5 m bands have not been observed or discussed yet. Since HD 200775 is a B star, only low ionization potential atoms should emit in fine structure lines (e.g. [CII], [SIII] etc.), and these species do not have lines in this spectral range, so we exclude contamination by fine structure lines. These four new bands seem spatially correlated, i.e. all of them only appear in the regions closest to the star, which suggests a common carrier. As shown by Sellgren et al. (2010), C60 is also found only close to the star. Still, the four new bands only appear in the regions that are closest to the star, while Fig. 1 demonstrates that C60 emission is more extended. This suggests that the four new bands are carried by a species that is a product of the photoprocessing of C60 , an obvious carrier being C. In the following section we provide the spectroscopic arguments that support this observational evidence.
4 Spectroscopy of C
The only IR spectroscopic data of C has been obtained in rare gas matrices by Fulara et al. (1993) and more recently by Kern et al. (2012). Two bands at 7.1 and 6.4 m seem definitively attributed to C, based on these experimental studies.
Theory is another approach to obtaining spectroscopic data, and density functional theory (DFT) in particular has been shown to be effective and accurate for calculations on neutral C60 (Chase et al., 1992; Fabian, 1996; Iglesias-Groth et al., 2011). However, an additional theoretical problem is that upon ionization C60 is known to undergo Jahn–Teller (JT) distortion (Chancey & O’Brien, 1997; Bersuker, 2006). Neutral C60 has symmetry, and is a closed–shell system, and its ground electronic state is totally symmetric and nondegenerate. Upon ionization, the ground electronic state of C, in the adiabatic approximation, is five-fold degenerate and has symmetry. These electronic states, degenerate at the symmetric configuration, split when the symmetry is broken, and the Jahn–Teller theorem predicts that there must be lower energy extrema, some of which must be minima, at distorted geometries. The closeness of these electronic states means that the adiabatic approximation may break down in this situation. Nevertheless, standard harmonic vibrational spectra can be computed in the adiabatic approximation around the new minima, and they will still be approximately correct if IR–active modes have a negligible component along the directions involved in the Jahn–Teller effect. This is the case for C, as discussed in Appendix A, where the reader can also find a more detailed description of the Jahn –Teller effect and how it affects our calculations.
We performed our DFT calculations using the hybrid B3LYP exchange–correlation functional and the 4–31g Gaussian basis set. This combination is known to yield reasonably accurate vibrational frequencies, after scaling with an empirical factor to account for the overestimation of the frequencies. The relatively small basis set limits the accuracy of band intensities, but based on the thorough tests performed by Galué et al. (2011), we expect that neglecting dynamical JT effects is the leading limitation on vibrational band accuracy even at this level of theory. The distorted geometry of minimum energy was obtained by optimizing with no symmetry constraints, and turned out to have symmetry. This is only very slightly distorted. Such a small change in geometry implies a correspondingly small change in interatomic forces, and it explains the qualitative similarity of the computed spectra of C and C60. Of course, many more modes are IR–active in distorted C due to the lowering of symmetry and correspondingly relaxed selection rules. The properties of the most intense IR active bands of C are given in Table 2.
| Position | FWHM | Intensity | Species |
|---|---|---|---|
| m | m | 10-7 W m-2 sr-1 | Assignment |
| 6.24 | 0.13 | 1.02 | PAH |
| 6.43 | 0.09 | 3.68 | C |
| 6.61 | 0.13 | 3.41 | C24 |
| 7.02 | 0.07 | 2.92 | C60 |
| 7.13 | 0.11 | 2.82 | C |
| 8.10 | 0.10 | 0.91 | C |
| 8.49 | 0.14 | 1.83 | C60 |
| 8.62 | 0.28 | 0.85 | PAH |
| 10.53 | 0.11 | 0.22 | C |
| Symmetry | Unscaled | Scaled | Intensity |
|---|---|---|---|
| degeneracy | frequency | wavelength∗ | |
| (cm-1) | (m) | (km.mol-1) | |
| E1 (2) | 1607 | 6.40 | 94.6 |
| A2 (1) | 1599 | 6.43 | 5.5 |
| A2 (1) | 1488 | 6.91 | 5.6 |
| E1 (2) | 1482 | 6.94 | 2.4 |
| E1 (2) | 1434 | 7.17 | 123.8 |
| E1 (2) | 1353 | 7.60 | 33.3 |
| E1 (2) | 1333 | 7.71 | 1.4 |
| A2 (1) | 1250 | 8.23 | 20.0 |
| E1 (2) | 1249 | 8.23 | 39.5 |
| E1 (2) | 1196 | 8.60 | 1.4 |
| A2 (1) | 989 | 10.4 | 6.6 |
| E1 (2) | 981 | 10.5 | 22.6 |
| E1 (2) | 795 | 12.9 | 2.0 |
| E1 (2) | 778 | 13.2 | 6.8 |
| E1 (2) | 763 | 13.5 | 0.5 |
| A2 (1) | 592 | 17.4 | 3.5 |
| E1 (2) | 588 | 17.5 | 0.3 |
| A2 (1) | 553 | 18.6 | 19.8 |
| E1 (2) | 412 | 25.0 | 12.1 |
| E1 (2) | 364 | 28.2 | 5.0 |
| A2 (1) | 361 | 28.5 | 0.6 |
| ∗ using an empirical scaling factor | |||
5 C in NGC 7023
5.1 Identification of Cin NGC 7023
As mentioned in the previous section, it is necessary to correct the calculated frequencies by an empirical scaling factor. In the case of PAHs, this is usually done by comparing the computed frequencies to the ones measured in the laboratory at low temperature in rare gas matrices (see Bauschlicher & Langhoff 1997 for a case-study on PAHs). Therefore we use the IR absorption spectrum of C that was measured in Ne matrices by Kern et al. (2012) to calibrate our DFT calculations. The two bands definitively attributed to C by (Kern et al., 2012) are found at 1550 and 1406 cm-1 and correspond to the strongest bands, predicted by theory at 1607 and 1434 cm-1. This implies a respective scaling factor of 0.9645 and 0.9805. We adopt an average value . The corrected positions are given in Table 2 and the resulting spectrum is shown in Fig. 1. After scaling, the five strongest IR bands fall at wavelengths of 6.40, 7.17, 7.60, 8.23 and 10.50 m. Four of these are very close (within 2%) to the positions of the four new bands detected in NGC 7023 (6.43, 7.13, 8.10, 10.53 m). The observed match is very good considering that other factors are expected to affect the band positions, in particular band shift due to anharmonic coupling in hot emitting molecules (Joblin et al., 1995). The nondetection of the 7.6 m band in the observations is not surprising, since it is most likely hindered by the strong PAH emission at the same position (Fig. 1). Based on the observational (Sect. 3) and spectroscopic arguments presented in this Letter, we therefore argue that there is strong evidence for the presence of C in NGC 7023. Further discussion of the relative band intensities would require an emission model. Attempts to build such a model for C60 have been reported by Sellgren et al. (2010) and then by Bernard-Salas et al. (2012). However, the authors could not account for the observed relative band intensities. This is likely due to uncertainties in the intrinsic IR band strengths that were obtained by DFT calculations. The same certainly holds for C for the reasons given in Sect. 4. Still, the detection of C strongly supports the idea that C60 is in the gas phase (Sellgren et al., 2010) and not in solid phase as initially suggested by Cami et al. (2010).
5.2 Abundance
Using a simple energetic consideration, we can derive an estimation of the Cabundance. We write that C60 and C relax in the IR all the energy they absorb in the UV, which is true if IR emission is the only relaxation channel. We can further assume that the UV absorption cross-section of neutral and cationic species are similar, which is the case for PAHs at energies higher than 10 eV (Cecchi-Pestellini et al., 2008). In this case, the ionization fraction of C60 can be directly derived from the integrated IR flux in the C60 and Cbands. Using the values in Table 1 we find Wm-2sr-1 for C60 and Wm-2sr-1 for C. However, these values have to be corrected by the emission at longer wavelengths. In the case of C60 , we therefore add the emission in the 17.4 and 18.9 m bands, measured in the IRS2 LL spectrum for position 2 (respectively, 2.6 and 5.2 Wm-2sr-1). This leads to a total value of Wm-2sr-1 for the total IR flux. In the case of C , we do not consider emission at longer wavelengths in line with DFT calculations, which predict much weaker bands. Thus, we obtain that the ionization fraction of C60 is 38%. If we consider a maximum abundance of C60 in NGC7023 of of the elemental carbon (Berné & Tielens, 2012), this implies an abundance of of the elemental carbon abundance for C. This is a factor at least 10 lower than the value derived by Foing & Ehrenfreund (1994) for the diffuse interstellar medium, assuming that Cis the carrier of the two DIBs at 9577 and 9632 Å. Since the DIB identification is still not firmly established, it is difficult to discuss this discrepancy further.
5.3 Taking the next step, C as a tracer of physical conditions
Sellgren et al. (2010) report the detection of the C60 band at 7.0 m in NGC 7023. In their spectrum, the bands of C are not present. Since this spectrum was taken in a region farther away from the star (Fig. 1) this suggests that the C60 emission extends farther away from the star than C emission. These relative variations can be attributed to the photochemical evolution of C60 resulting from the competition between ionization by UV photon and recombination with electrons. Assuming one can quantify these two processes, and also have a proper description of the photophysics in these systems, this would allow using the ratio between the IR flux of C60 and C as a tracer of local physical conditions. There already exists such an approach using PAH bands (Galliano et al., 2008), but only empirical laws can be used since the PAH population is poorly characterized. Furthermore, information on the C60 and C bands is unique for regions of high UV radiation fields in which other molecular tracers may not survive.
6 Conclusion
After studying the mid-IR spectra of the NGC 7023 nebula, we have found spectral signatures at 6.4, 7.1, 8.1, and 10.5 m, which we attribute to the cationic form of C60 (C). This is the largest cation know in space so far. C has been proposed as a DIB carrier, and our identification supports this proposal. This is also clear evidence for the presence of large carbon molecules in the gas phase in the ISM. The detection of C in emission also opens the possibility of using the ratio between the C60 and C IR bands as a tracer of physical conditions in interstellar and circumstellar environments. This may prove useful in the framework of forthcoming infrared missions, such as JWST and SPICA.
Acknowledgements.
We acknowledge the French National Program Physique et Chimie du Milieu Interstellaire for its support.References
- Bauschlicher & Langhoff (1997) Bauschlicher, C. W. & Langhoff, S. R. 1997, Spectrochimica Acta Part A: Molecular and Biomolecular Spectroscopy, 53, 1225
- Bernard-Salas et al. (2012) Bernard-Salas, J., Cami, J., Peeters, E., et al. 2012, ApJ, 757, 41
- Berné et al. (2007) Berné, O., Joblin, C., Deville, Y., et al. 2007, Astron. Astrophys., 469, 575
- Berné & Tielens (2012) Berné, O. & Tielens, A. G. G. M. 2012, Proceedings of the National Academy of Science, 109, 401
- Bersuker (2006) Bersuker, I. C. 2006, The Jahn–Teller Effect (Cambridge University Press)
- Cami et al. (2010) Cami, J., Bernard-Salas, J., Peeters, E., & Malek, S. E. 2010, Science, 329, 1180
- Canton et al. (2002) Canton, S. E., Yencha, A. J., Kukk, E., et al. 2002, Physical Review Letters, 89, 045502
- Cecchi-Pestellini et al. (2008) Cecchi-Pestellini, C., Malloci, G., Mulas, G., Joblin, C., & Williams, D. A. 2008, A&A, 486, L25
- Chancey & O’Brien (1997) Chancey, C. C. & O’Brien, M. C. M. 1997, The Jahn–Teller Effect in C60 and Other Icosahedral Complexes (Princeton University Press)
- Chase et al. (1992) Chase, B., Herron, N., & Holler, E. 1992, The Journal of Physical Chemistry, 96, 4262
- Fabian (1996) Fabian, J. 1996, Phys. Rev. B, 53, 13864
- Foing & Ehrenfreund (1994) Foing, B. H. & Ehrenfreund, P. 1994, Nature, 369, 296
- Fulara et al. (1993) Fulara, J., Jakobi, M., & Maier, J. P. 1993, Chemical Physics Letters, 206, 203
- Galliano et al. (2008) Galliano, F., Madden, S. C., Tielens, A. G. G. M., Peeters, E., & Jones, A. P. 2008, ApJ, 679, 310
- Galué et al. (2011) Galué, H. A., Rice, C. A., Steill, J. D., & Oomens, J. 2011, J. Chem. Phys., 134, 054310
- García-Hernández et al. (2011) García-Hernández, D. A., Iglesias-Groth, S., Acosta-Pulido, J. A., et al. 2011, ApJ, 737, L30
- Houck et al. (2004) Houck, J. R., Roellig, T. L., van Cleve, J., et al. 2004, ApJS, 154, 18
- Iglesias-Groth et al. (2011) Iglesias-Groth, S., Cataldo, F., & Manchado, A. 2011, MNRAS, 413, 213
- Joblin et al. (1995) Joblin, C., Boissel, P., Leger, A., D’Hendecourt, L., & Defourneau, D. 1995, A&A, 299, 835
- Joblin & Tielens (2011) Joblin, C. & Tielens, A. G. G. M., eds. 2011, EAS Publications Series, Vol. 46, PAHs and the Universe: A Symposium to Celebrate the 25th Anniversary of the PAH Hypothesis
- Kern et al. (2012) Kern, B., Strelnikov, D., Weis, P., Böttcher, A., & Kappes, M. M. 2012, in 67th International Symposium on Molecular Spectroscopy
- Kroto et al. (1985) Kroto, H. W., Heath, J. R., Obrien, S. C., Curl, R. F., & Smalley, R. E. 1985, Nature, 318, 162
- Montillaud et al. (2012) Montillaud, J., Joblin, C., & Toublanc, D. 2012, submitted to A&A
- Moutou et al. (1999) Moutou, C., Sellgren, K., Verstraete, L., & Léger, A. 1999, A&A, 347, 949
- Pilleri et al. (2012) Pilleri, P., Montillaud, J., Berné, O., & Joblin, C. 2012, A&A, 542, A69
- Rapacioli et al. (2005) Rapacioli, M., Joblin, C., & Boissel, P. 2005, Astron. Astrophys., 429, 193
- Saito (2002) Saito, M. 2002, Phys. Rev. B, 65, 220508
- Sellgren et al. (2010) Sellgren, K., Werner, M. W., Ingalls, J. G., et al. 2010, Astrophys. J., 722, L54
- Smith et al. (2007) Smith, J. D. T., Armus, L., Dale, D. A., et al. 2007, PASP, 119, 1133
- Tielens (2005) Tielens, A. G. G. M. 2005, The Physics and Chemistry of the Interstellar Medium, ed. Tielens, A. G. G. M.
- Werner et al. (2004) Werner, M. W., Roellig, T. L., Low, F. J., et al. 2004, ApJS, 154, 1
Appendix A Details on Cspectroscopy
Neutral C60 has symmetry, its highest occupied molecular orbital (HOMO) is five–fold degenerate, it has symmetry and is fully occupied, resulting is a closed–shell ground state that is totally symmetric and nondegenerate. Upon ionization, the hole in the HOMO yields a five–fold degenerate overall electronic state. This undergoes spontaneous symmetry-breaking due to the Jahn–Teller (JT) effect (Chancey & O’Brien 1997; Bersuker 2006). The degeneracy of the electronic state is lifted by distorting the molecule to a lower symmetry along some of its normal modes, which are determined by symmetry and called JT–active. For C , JT–active modes are those of , , and symmetry. The modes only shift the total energy, without reducing symmetry. The , modes instead break the symmetry, and produce a multisheet adiabatic potential energy surface, with a conical intersection in the symmetric geometry and extrema in configurations of and lowered symmetry. DFT predicts that the geometries should be the absolute minima, with the ones being shallow transition states (Saito 2002). However, high-resolution photo–electron spectroscopy seems to hint that the geometry could be the real minimum (Canton et al. 2002). When JT–distorted minima are deep with respect to vibrational energy (static JT–effect), the adiabatic approximation holds in its vicinity, and standard harmonic vibrational analysis is applicable. Conversely, if equivalent minima are separated by negligible potential barriers, the molecule can tunnel among equivalent minima, mixing the near–degenerate electronic states (dynamic JT–effect), and the adiabatic approximation is not applicable. The resulting vibronic states recover the full initial symmetry of the problem. In this case, a much more complex calculation, dropping the adiabatic approximation, is needed for accurate results. A comparable, but much simpler case of dynamical JT effect is the cation of corannulene, C20H, which can be regarded as a fragment of C60 with peripheral bonds saturated by H atoms. This was studied by Galué et al. (2011), who compared experimental infrared, multiphoton dissociation (IRMPD) spectra with a plain DFT harmonic vibrational analysis at the distorted geometry of minimum energy. This was expected to be the worst possible comparison, since in IRMPD experiments, vibrational energy is increased until the dissociation threshold is reached. This corresponds to energy values that are much higher than all barriers among equivalent minima, thereby maximizing dynamical JT effects. Despite this, the experimental and theoretical spectra do qualitatively agree, allowing for accurate band identification. Bands that are most significantly mispredicted, in position and intensity (but still identifiable in the laboratory spectrum), are those whose normal modes imply displacement along JT–active modes, i. e. those that move the molecule from a minimum in the direction of another one, or to the conical intersection.
In the light of this, we did a similar analysis for C, finding the distorted geometry of minimum energy and computing harmonic vibrational spectra there, thereby neglecting dynamical JT effects. We performed DFT calculations using both the Gaussian version 03.d2 and NWChem version 6.1 codes, and obtained very nearly identical results. Optimization led to the geometry. We also optimized the geometry of Cwith the constraint of symmetry, obtaining a JT stabilization energy of meV, which is consistent with previous calculations (Saito 2002). The distorted geometry, when compared with the symmetric one, appears to be distorted almost exclusively along normal modes of symmetry, with changes in bond lengths of a few mÅ and bond angles by less than a degree (maximum).