The anatomy of an extreme starburst within 1.3Gyr of the Big Bang revealed by ALMA
Abstract
We present further analysis of the [CII] 158m fine structure line and thermal dust continuum emission from the archetype extreme starburst/AGN group of galaxies in the early Universe, BRI 1202-0725 at , using the Atacama Large Millimeter Array. The group is long noted for having a closely separated (26kpc in projection) FIR-hyperluminous quasar host galaxy and an optically obscured submm galaxy (SMG). A short ALMA test observation reveals a rich laboratory for the study of the myriad processes involved in clustered massive galaxy formation in the early Universe. Strong [CII] emission from the SMG and the quasar have been reported earlier by Wagg et al. (2012) based on these observations. In this letter, we examine in more detail the imaging results from the ALMA observations, including velocity channel images, position-velocity plots, and line moment images. We present detections of [CII] emission from two Ly-selected galaxies in the group, demonstrating the relative ease with which ALMA can detect the [CII] emission from lower star formation rate galaxies at high redshift. Imaging of the [CII] emission shows a clear velocity gradient across the SMG, possibly indicating rotation or a more complex dynamical system on a scale kpc. There is evidence in the quasar spectrum and images for a possible outflow toward the southwest, as well as more extended emission (a ’bridge’), between the quasar and the SMG, although the latter could simply be emission from Ly-1 blending with that of the quasar at the limited spatial resolution of the current observations. These results provide an unprecedented view of a major merger of gas rich galaxies driving extreme starbursts and AGN accretion during the formation of massive galaxies and supermassive black holes within 1.3 Gyr of the Big Bang.
1 Introduction
The last decade has seen the solidification of two important conclusions concerning massive galaxy formation. First is that massive galaxies form most of their stars at early times, and the more massive, the earlier. This point has been accentuated by the observation of old spheroidal galaxies at to 3, thereby requiring active star formation at even higher redshifts (Kurk 2009; Andreon & Huertas-Company 2011). Second, the observed correlation between central black hole and spheroidal galaxy mass suggests a causal connection between the formation of supermassive black holes (SMBH) and their host galaxies (Haaring & Rix 2004).
Large scale cosmological simulations show that massive galaxies and SMBH can form at high-z via gas rich mergers, driving extreme starbursts, and rapid accretion onto the black holes and subsequent black hole mergers (Li et al. 2007). These process occur in the densest, ie. most biased, regions in the early Universe. The systems evolve into large galaxies in rich clusters at low-z. More recent simulations suggest that cold accretion from the IGM may also play a role in, and possibly even dominate, the gas resupply (Khandai et al 2012). As the SMBH builds, feedback from the AGN expels gas from the galaxy, and hinders further accretion, thereby terminating starformation in the galaxy.
Galaxies detected in submm surveys with mJy sensitivity are important in this regard, representing massive starburst galaxies in the distant Universe. These include the submm galaxies (SMGs) and about 1/3 of quasar host galaxies at (Wang et al. 2011, 2010a,b; Blain et al. 2002). These systems are hyper-luminous infrared galaxies ( L⊙). The implied star formation rates are M⊙ year-1 based on the FIR emission. At this rate, a substantial fraction of the stars in the galaxy can form on timescales years.
The compact group of galaxies BRI 1202-0725 was one of the first submm-bright systems discovered (Isaak et al. 1994), and remains the archetype for major starbursts in gas rich mergers in the early Universe. The system includes an optically selected, broad absorption line quasar with M M⊙ at a redshift of , and an optically-undetected SMG located 4 (26 kpc) northwest of the quasar at (Omont et al. 1996 a,b; Hu, McMahon, Egami 1996). Both sources are hyper-luminous FIR galaxies (Omont et al. 1996a,b; Iono et al. 2006; Yun et al. 2000). Both sources have been detected in CO line emission, with implied gas masses 5 M⊙ (Salome et al. 2012; Carilli et al, 2002; Ohta et al. 1996; Omont et al. 1996b), assuming a CO luminosity to gas mass conversion factor, M⊙ (K km s-1 pc2)-1, appropriate for star forming galaxies (Solomon & Downes 1998). Both source are detected in radio continuum emission, consistent with either a weak AGN or extreme star formation (Yun & Carilli 2002). Very high resolution CO and radio continuum imaging shows resolved emitting regions on scales , likely corresponding to compact starbursts in both galaxies on scales 2 kpc (Carilli et al. 2002; Momjian et al 2005; Yun & Carilli 2002).
The best CO observations of the BRI 1202-0725 system to date are by Salome et al. (2012). They find that the SMG appears extended, with two components separated by east-west. The CO emission from the quasar also appears extended to the south by about . The CO excitation in both galaxies is high, suggesting warm (40K to 50K), dense ( cm-3) gas.
Extended Ly emission has been seen around the quasar, with a tail of emission extending from the quasar toward the SMG, terminating in a Ly emitting galaxy about 2.3 northwest of the quasar (Hu et al. 1996; Ohta et al. 2000; Ohyama et al. 2004). This galaxy is designated Ly-1 by Salome et al. (2012). Spectra of this galaxy yield a redshift of (Petitjean et al.1996). The large uncertainty in the redshift reflects the fact that the Ly profile for this galaxy is broad and complex. Continuum emission from Ly-1 is detected in the HST i-band image (Hu et al. 1996). Klamer et al. (2004) discuss the possibility of jet-induced star formation in this system, although an extended radio jet has not been detected to date. A second galaxy has been detected in Ly emission, and in the HST i-band image, located southwest of the quasar (Hu et al. 1996; 1997; Fontana et al. 1996). Salome et al. (2012) designate this galaxy Ly-2. Both of these galaxies appear extended on a scale in the HST images, toward the quasar.
In an earlier letter, Wagg et al. (2012) presented an initial analysis of the [CII] and dust continuum emission from the SMG and the quasar host galaxy in BRI1202-0725 using a test observation from ALMA. The [CII] 158m line is typically the strongest emission line from cool gas in star forming galaxies, and is a principle ISM gas coolant, tracing both photon-dominated regions enveloping active star forming clouds, low density ionized gas, and the cold neutral medium (Genzel & Cesarsky 2000; Stacey et al. 2010; Malhotra et al. 1997; Crawford et al. 1986). As such, the [CII] line is a key diagnostic of ISM energetics in early galaxies as well as of galaxy dynamics (Carilli & Walter 2013). Wagg et al. (2012) find that the [CII]/FIR luminosity ratio is relatively low in both the SMG and quasar, and , respectively. For comparison, the Milky Way has a value of (Wright et al. 1991; Bennett et al. 1994). Low [CII]/FIR ratios are typically seen in extreme starburst environments, and may arise due to the high radiation environment leading to substantially charged dust grains, and hence less efficient gas heating via photoelectric emission from the dust grains (Malhotra et al. 1997). Alternatively, Sargsyan et al. (2012) propose that a substantial contribution to dust heating by an AGN may lead to low ratios in very luminous systems, while Papadopoulos et al. (2010) suggest that optical depth effects at 158m may also play a role.
In this paper, we present a more detailed analysis of the ALMA data, with a closer look at the imaging results based on self-calibration of the visibility data. We present spectra, channel images, moment images, and a position velocity analysis. The [CII] imaging reveals a rich physical environment. Both Ly emitting galaxies are also detected in [CII] emission. The SMG shows a clear velocity gradient in the atomic gas on a scale kpc, and the quasar shows evidence for atomic gas outflow, or a possible tidal feature to the southwest toward Ly-2. There may even be a bridge of cool gas connecting the quasar and the SMG, although the presence of Ly-1 confuses this possibility.
2 Observations
Observations were made of BRI 1202-0725 with the Atacama Large Millimeter Array during science testing and verification in January 2012 (see Wagg et al. 2012 for more details). These short observations (25 minutes on-source), with only 17 antennas, are already an order of magnitude more sensitive than any previous submm line or continuum observations of the system. Observations were made with 4 dual-polarization bands of 2GHz bandwidth each. The first band covered the [CII] line from the SMG and the quasar, with a central (sky) frequency of 333.960 GHz, corresponding to a redshift of for the [CII] 158m line (rest frequency = 1900.539 GHz). The other bands were centered off the line by GHz, and these were used for continuum imaging. Hanning smoothing was applied on output from the correlator to the 128 channel per 2 GHz band spectral data.
Calibration of the data was performed using the Astronomical Image Processing System (AIPS). The source 3C279 was used as a flux density and phase calibrator, using the flux density at 340GHz of 17Jy derived by Wagg et al. (2012). 3C279 is located 13o from the target source. A 10min calibration cycle was employed during the observations, and the weather conditions were excellent, with gains stable to a few degrees and a few percent over the hour. The source 3C279 was also used for bandpass calibration, and the bandpass was smooth and stable, again to within a few percent and a few degrees except for a few edge channels in each band that were flagged.
The sensitivity of even the reduced array of ALMA is such that self-calibration could be employed using the continuum and line emission from BRI 1202-0725 (total continuum flux density of 37mJy at 340GHz). Amplitude and phase self-calibration was performed using a 3min averaging time for complex gain solutions.
Imaging was performed using a robust imaging scheme with R=1 (Cornwell et al. 1999), for which the restoring Gaussian beam was resolution (major axis North-South). For the spectral line data, the continuum was subtracted from the UV data using a CLEAN component model derived from the three off-line bands, before imaging and deconvolution.
3 Results
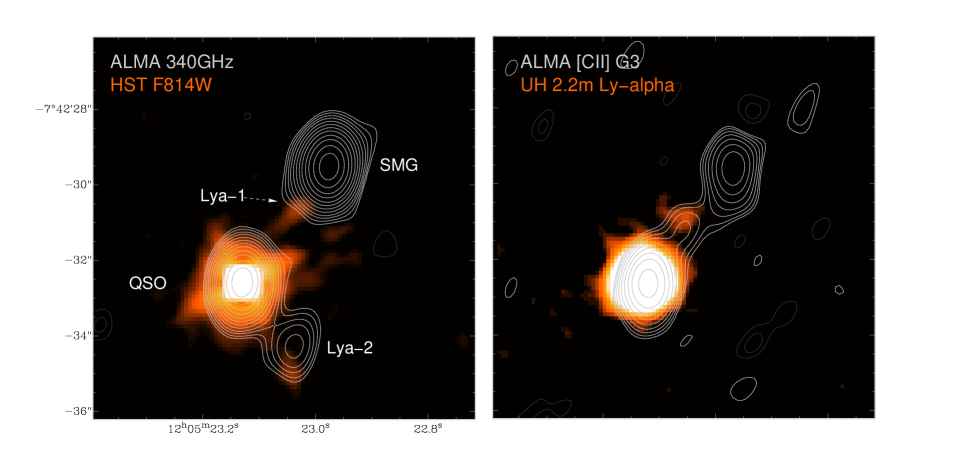
Figure 1a shows the 340 GHz continuum emission from BRI 1202-0725, overlayed on the HST i-band image. For relative astrometry (optical-radio) we follow Carilli et al. (2002) by aligning the quasar position in the HST, Ly, submm continuum, and radio continuum images. Given the scatter in these positions, a rough estimate of the relative astrometry is .
The continuum emission from the SMG and quasar is unresolved (deconvolved sizes derived from Gaussian fitting), with flux densities of mJy and mJy, respectively, including the 15% uncertainty in absolute gain calibration estimated by Wagg et al. (2012). The galaxy Ly-2 to the southwest of the quasar is also detected in the continuum, and is unresolved with a flux density mJy (see also Wagg et al. 2012). This submm continuum source peaks from Ly-2 as seen on the HST image (Hu et al. 1996), although this galaxy appears extended in the HST image in the direction of the submm source and the quasar by at least (Figure 1a).
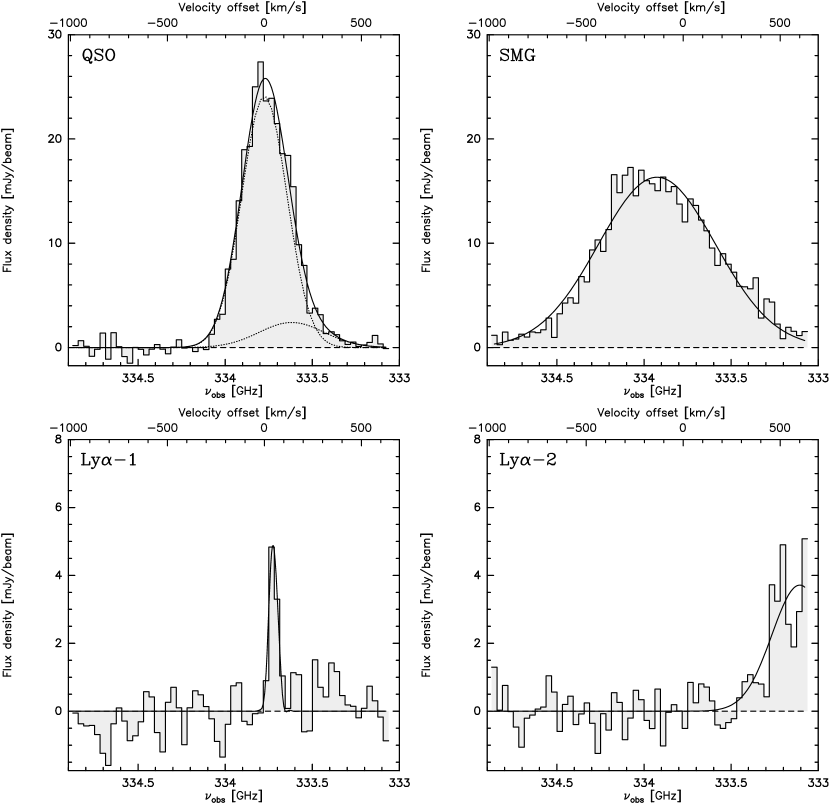
Figure 2 shows the channel images of the [CII] line, smoothed to a spectral resolution of 62.5 MHz (= 56 km s-1). Spectra of the sources are shown in Figure 3 at 31.25 MHz spectral resolution (= 28 km s-1).
Strong [CII] emission is seen from the SMG over essentially the full frequency range in the first band. Likewise, strong emission is seen from the quasar over a narrower frequency range. For reference, we have fit Gaussian models to the spectra, although admittedly the SMG spectrum is decidedly non-Gaussian. Results from the fitting are given in Table 1 (see Wagg et al. 2012 for more details on the SMG and quasar spectra).
Inspection of the [CII] channel images shows emission from the vicinity of Ly-1, between the quasar and the SMG, in a few channels just above 0 km s-1. Figure 1b shows the integrated emission in the velocity range 0 km s-1 to 100 km s-1, with the Ly image of Hu et al. (1996) in color. This apparent [CII] emission is seen along the direction of the extended Ly tail from the quasar toward the SMG (Hu et al. 1997), peaking close (within ) to galaxy Ly-1. A spectrum at this peak position near Ly-1 is shown in Figure 3c. The [CII] emission from Ly-1 is narrow, with a FWHM km s-1, centered at . Note that it is difficult to conclude based on these relatively low spatial resolution data whether this emission is truly extended between the quasar and Ly-1, or simply blended by the limited spatial resolution. The [CII] emission around the quasar also appears extended in the direction of Ly-2 in the channels around +250 km s-1 to +300 km s-1.
The two highest velocity channels in Figure 2 show [CII] emission from galaxy Ly-2. Figure 3d shows the spectrum of this galaxy. Since the redshift of this galaxy was essentially unknown prior to the observations, the spectral coverage truncates some unknown fraction of the line at high velocity (low frequency). Hence, we do not know the full velocity extent nor total luminosity of the [CII] emission for Ly-2, and the redshift is strictly a lower limit.
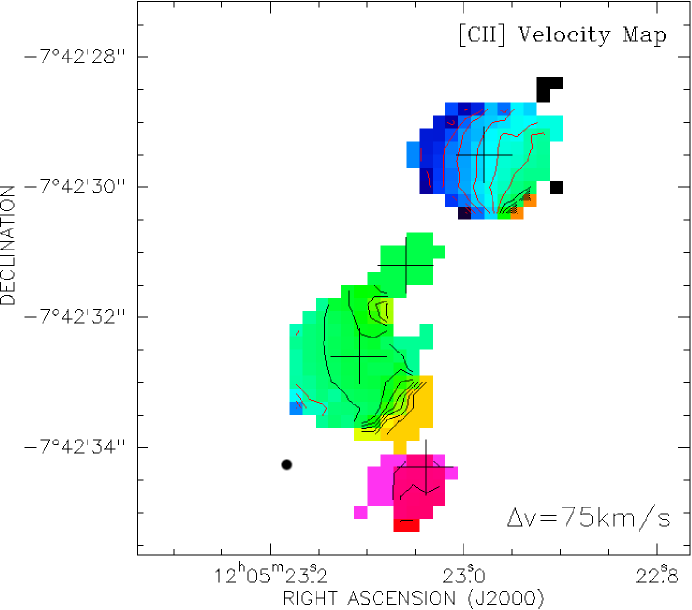
Figure 4 shows the iso-velocity image (moment 1 = intensity weighted mean velocity) of the [CII] emission made using a 3.5 blanking level. There is a clear east-west velocity gradient across the SMG. This can be seen in the channel images (Fig 2), where the peak of the line emission moves by about east to west from low to high velocities. The tail of emission to the north of the quasar toward Ly-1 is also seen, as well as the extended emission to the southwest of the quasar toward Ly.
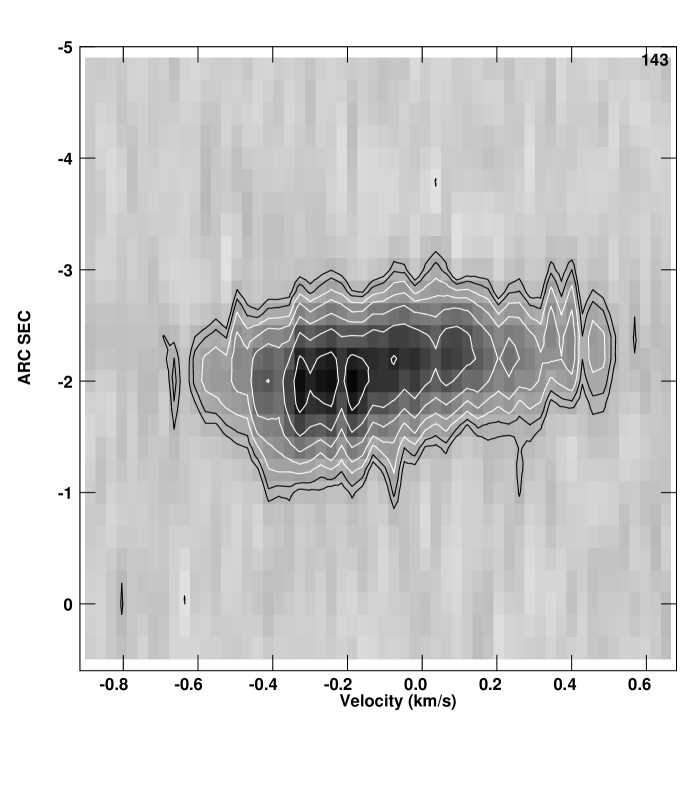
Figure 5 shows a position-velocity (PV) plot along the major axis (East-West) of the SMG. The E-W velocity gradient is clear, as well as a twist in the line-of-nodes at the extrema in velocity. Such a twist could signal a warped-disk in atomic gas.
4 Analysis
Wagg et al. (2012) present a detailed analysis of the main [CII] line and dust continuum emission from the quasar and SMG in BRI 1202-0725. Herein we focus on the [CII] imaging, and in particular, the extended emission from the SMG, quasar, and the Ly emitting galaxies.
4.1 SMG dynamics
The isovelocity contours of the [CII] emission from the SMG show a gradient of 525 km s-1 over (Figure 4). If due to simple rotation, this would imply a dynamical mass of [sin(i)/sin(45)]-2 M⊙ to a radius of 5.5 kpc. This mass is an order of magnitude higher than the molecular gas mass (Carilli et al. 2002), unless one adopts the five times larger CO luminosity to gas mass conversion factor for the Milky Way relative to the nuclear starburst value. However, recent observations suggest that a starburst conversion factor is clearly favored in SMGs (see Carilli & Walter 2013 for a review).
Perhaps the simplest conclusion is that the velocity gradient in the SMG is not due to rotation. Salome et al. (2012) find that the CO 5-4 line profile for the SMG appears more like a double-line system as opposed to the more gradual gradient seen to higher velocities in the [CII] line spectrum. Likewise, the east-west PV for the SMG in CO 5-4 shows a more broken distribution, with a dip, then plateau to high velocity. The [CII] shows a more continuous distribution. Salome et al. conclude that the SMG itself may in fact be an end-stage merger of two gas rich galaxies.
4.2 Quasar outflow
The quasar [CII] emission line is well fit by a Gaussian, except at the high velocity end of the spectrum, where there appears to be a broad wing. Figure 3 shows a double Gaussian fit to the spectrum including this broad wing. In this case, the main component has a redshift of , a peak of 24mJy, and a FWHM = 274 km s-1. The second component for the wing has a peak flux density of 2.4 mJy, centered at , or 141 km s-1 from the quasar redshift, and a FWHM = 395 km s-1 (Fig 2b). Inspection of the channel images (Fig 2) shows emission extending south of the quasar in this velocity range. The deconvolved size of the emission in this velocity range is oriented north-south, as derived from Gaussian fitting. This feature could be the result of the tidal interaction, or an outflow. We briefly consider the latter possibility.
In order to determine the outflow rate and energetics, we follow the same approach presented in Maiolino et al. (2012), where they detect a similar outflow traced by [CII] in a z=6.4 quasar. More specifically, the luminosity of the high velocity gas traced by the [CII] provides a lower limit on the mass of outflowing atomic gas (in the extreme limit , the critical density for [CII] excitation). Since the broad component of [CII] is poorly constrained, we conservatively consider only the luminosity of the [CII] wing integrated between +220 km/s and +500 km/s (), which gives a lower limit on the outflowing atomic gas mass of , assuming an abundance ratio of (Savage & Sembach 1996). Assuming a simplified conical or bi-conical outflow geometry and a size of 1.5′′ (=10 kpc), we infer a lower limit on the outflow rate of . This is a modest outflow rate relative to other quasar-driven outflows, which generally have outflow rates higher than a few hundred up to a few thousands (Feruglio et al. 2010, Sturm et al. 2011, Cano-Diaz et al. 2012, Maiolino et al. 2012). However, one should keep in mind that this is a lower limit on the total outflow rate, because of the assumed extreme physical conditions, and because a significant fraction of the outflow may be in the molecular phase. We note that by taking the flux of the full broad component used to fit the broad wing (Fig.3a) the inferred outflow rate would increase by a factor of about three. Moreover, this calculation depends critically on the assumed conical geometry and constant velocity, and hence should be considered roughly order of magnitude (see Maiolino et al. 2012 for details).
We derive a lower limit on the kinetic power of , which is only 0.2% of the quasar bolometric luminosity (), well below the maximum kinetic power that can be driven by the quasar according to models (5%, Lapi et al. 2006), meaning that the quasar radiation pressure can easily drive such a mild outflow. On the other hand, this relatively low kinetic power can also be driven by the starburst hosted in the quasar itself. The total IR luminosity of the quasar is L⊙ (Wagg et al. 2012), which implies a star formation rate of , for a Charbrier IMF using standard relations (Carilli & Walter 2013). The expected kinetic power is (Veilleux et al. 2005). Therefore, in this case the energetics cannot constrain the nature of the outflow: both the quasar and the starburst can drive it. And again, the derived kinetic luminosity is strictly a lower limit.
4.3 The Ly emitters
We have detected [CII] line emission from two narrow band selected, Ly emitting galaxies in the BRI 1202-0725 group at . The optical and near-IR properties of Ly-1 and 2 are described in Hu et al. (1996). The I-band magnitudes are 24.2 and 24.5, respectively. Hu et al. (1996) conclude that these galaxies have magnitudes and colors ’roughly comparable to an galaxy [at high redshift]’ (see also Hu et al. 1997; Lu et al. 1996; Fontana et al. 1996). They also conclude that the Ly equivalent widths are: ’ consistent with excitation by the underlying [stellar] population’, although they note that the proximity of the quasar raises some interesting questions about ionization (see below). We first consider the submm line and continuum properties of these in the context of star formation.
For Ly-2, the FIR luminosity is L⊙, based on the 340GHz flux density, and the implied star formation rate derived from the FIR luminosity is 170 M⊙ year-1, assuming a standard dust SED and conversion factors (Carilli & Walter 2013). The [CII] line luminosity is L⊙, based on the symmetrized Gaussian fit shown in Figure 2 (again, this is highly uncertain due to the truncated line profile). Sargsyan et al. (2012) present an empirical relationship between [CII] luminosity and star formation: log(SFR) = log(L(CII)) - 7.08 (solar units), derived from observations of the PAH, FIR, and [CII] emission from a large sample of nearby galaxies. For Ly-2 this relationship would imply a star formation rate of 70 M⊙ year-1.
The [CII]/FIR ratio is 0.0005 for Ly-2. This ratio is comparable to nuclear starburst galaxies seen nearby, and well below the Milky Way ratio of 0.003. However, we emphasize that the [CII] luminosity is uncertain due to the truncated line profile seen in Figure 3, and hence these estimates should be considered at best order-of-magnitude.
For Ly-1, the [CII] line luminosity is L⊙, based on the Gaussian fit shown in Figure 2, with an implied star formation rate of 19 M⊙ year-1, using the Sargsyan et al. (2012) relationship. In this case, we only have lower limit to the FIR luminosity of L⊙, based on an upper limit to the 340 GHz flux density of 0.3mJy, or an upper limit to the star formation rate of 36 M⊙ year-1. In this source, the lower limit to the [CII]/FIR ratio is 0.0005.
The proximity of a very luminous quasar to these Ly emitting galaxies ( L⊙), presents the possibility that atomic gas is both heated and ionized by the luminous nearby quasar. We ran a series of simple CLOUDY models (Ferland et al 1998), that reproduced both its Lyman-alpha and [C II] luminosities in Ly-1. We adopted simple models in which a small segment of a spherical shell of gas is located a radial of distance 15 kpc from the quasar. We explored an initial density range between 100 and 1000 cm-3, but then pressure equilibrium was assumed between adjacent cells with an initial temperature of 10000 K. Thus density climbed to higher values in colder, neutral regions beyond the ionization front. Densities much lower than this required unreasonably high spatial extent of the gas. Densities much higher resulted in very small cloud radial dimensions compared to larger lateral dimensions required by the [CII] 158m emission maps.
The gas exhibits the classic “H II” region zone facing the quasar that extends into an ionization front further away, followed by a zone of neutral gas even further away from the quasar. In every case the Ly-alpha emission arose in the warm K, ionized gas, while the 158m emission arose in the neutral gas. But at the same time other standard UV emission lines such as Si IV 1397, N V 1239, and OI 1403 were predicted at luminosities more than a factor of 10 higher than the upper limits placed by Ohyama etal. (2004). While these authors did not observe C IV1548, which is the strongest of these transitions, neither has it been detected by other less sensitive observations, which are clearly in conflict with its predicted luminosity of ergs s-1 (Hu et al. 1997). Lowering the metal abundance does not help since many of these transitions serve as important coolants and the gas adjusts to higher temperatures to balance the heat input.
We conclude that the quasar is an unlikely source of heat and ionization for Galaxy Ly-1. As a result, we speculate that a torus that is optically thick to ionizing photons shields the quasar in the direction of Ly galaxies (Goosmann & Gaskell 2007). We note that, if the FUV heating the PDR arises from the quasar, then the high value of the FUV intensity is likely to produce [OI] 63m emission at fluxes comparable or exceeding the [CII] 158m emission. The point here is that at 15 kpc distance, the quasar will produce a , where is the FUV energy density in units of the Habing ISM value ( ergs cm-2 s-1 sterad-1 Hz-1)). As Kaufman et al. (1999) have shown, PDRs with , result in an intensity ratio [OI] 63m/[CII] 158m , owing to the relatively high temperature of the gas. Thus the detection of the 63m transition at fluxes comparable or greater than that of the 158m line indicates a relatively high value of . This would be consistent with incidence FUV flux coming from the quasar, or local heating by a luminous O star located within a few pc from the gas. An intensity ratio , would certainly rule out the gas irradiated by such an intense radiation field.
5 Discussion
BRI 1202-0725 shows all the attributes expected during massive galaxy and SMBH formation in a dense group in the early Universe. The system has four interacting galaxies within 5” of each other (35 kpc in projection): two hyper-starbursts (an SMG and a quasar host), and two Ly emitting galaxies (Ly-1 and 2). Impressively, all are detected in [CII] emission.
Perhaps the most impressive result from these observations is the relative ease with which high redshift Ly-selected galaxies can be be detected in [CII] emission. Using only 1/3 of the full ALMA, both Ly-1 and 2 were detected at reasonable signal to noise in just 20min. Scaling to the full ALMA, and a still reasonable 3hr integration, leads a factor 10 increase in sensitivity, allowing for detailed imaging of the atomic gas on sub-kpc scales in normal star forming galaxies (star formation rates few to 10 M⊙ year-1), at very high redshift. [CII] observations with ALMA open a new window on dynamical studies of the first galaxies.
An interesting trend for the [CII] emission in the vicinity of the quasar is for the atomic gas to extend in the direction of Ly-1 and 2. In fact, Ly-1 may be a local maximum within a possible bridge of atomic gas connecting the quasar and the SMG, as expected during major mergers of gas rich galaxies (Barnes & Hernquist 1996; Li et al. 2008). Unfortunately, the current resolution is insufficient to distinguish between a true bridge, or simply blurring of independent [CII] emission from the quasar and G3. An argument for some physical connection is the velocity continuity from the quasar through G3. A critical observation will be to confirm this bridge with deeper, higher resolution observations with ALMA, as well as to confirm the [CII] line and detect dust continuum emission from Ly-1.
The presence of a luminous quasar would naturally lead to strong outflows, as has been seen in both low and high redshift quasars in CO and/or [CII] emission (Maiolino et al. 2012; Sturm et al. 2011). Outflow from the quasar in BRI 1202-0725 is suggested by the presence of an associated broad absorption line system (Capellupo et al. 2011), although this could also be of tidal origin. Our analysis of the broad [CII] wing of the quasar indicates that, while an outflow may be present, it is not likely to dominate the gas depletion in the quasar host galaxy. Indeed, at the current outflow rate the available gas mass () would be expelled in about , which is much longer than the star formation consumption timescale ( yr).
The [CII] emission from the SMG shows a clear, relatively smooth velocity gradient over a scale of in an east-west PV plot, and in the first moment image, and a smooth integrated emission line profile over a broad range in velocity (700 km s-1). The morphology seen in the east-west PV plot, and the spectral profile, for the [CII] emission differ from the CO 5-4 emission, which appears more ’clumpy’ (two distinct peaks) in both the PV plot, and in the spectrum (Sargsyan et al. 2012). High order CO emission traces higher density gas, cm-3, while [CII] traces both the high density gas in PDRs, and lower density atomic gas (CNM). Hence, it could be that the lower density atomic gas has a smoother overall distribution than the CO, filling-in the velocity and spatial gaps seen in CO. Higher resolution CO and [CII] observations are required to delineate the relative atomic and molecular gas distributions in BRI 1202-0725.
Simpson et al. (2012) recently presented evidence that FIR luminous quasars are a short (1 Myr) but ubiquitous phase during the evolution of a dust obscured gas rich starburst to an unobscured, gas poor quasar.’ The narrower CO line width in the quasar relative to the SMG in BRI1202-0725, and the apparently more spatially extended gas distribution (as seen from the dynamics) in the SMG, are consistent with the trends discussed by Simpson et al.. However, in BRI1202-0725 we see the quasar and SMG phases as coeval, with both galaxies involved in the gas-rich merger. It is unclear how such a hyper-starburst galaxy pair, one of which is a luminous broad line quasar, fit-in to the stated evolutionary model.
| Source | Positiona | S340GHz | [CII] Redshiftb | Line Peak | FWHMc |
|---|---|---|---|---|---|
| J2000 | mJy | mJy | km s-1 | ||
| Quasard | J120523.13-074232.6 | 4.6942 | 275 | ||
| SMG | J120522.98-074229.5 | 4.6915 | 712 | ||
| Ly-1 | J120523.06-074231.2 | 4.6950 | 56 | ||
| Ly-2e | J120523.04-074234.3 | 4.7055 | 338 |
aSubmm continuum position, except for Ly-1, which uses
the [CII] line peak position.
bFormal errors from Gaussian fitting
on the redshifts are in all cases.
cFormal errors from Gaussian fitting
on the line widths are km s-1.
dRedshift for single Gaussian fit (see section 3.1).
eThis line is truncated in velocity, and hence the fit is highly
uncertain, and the redshift is strictly a lower limit.