Emergence of central mode in the paraelectric phase of ferroelectric perovskites
Abstract
THz-range dielectric spectroscopy and first-principle-based effective-Hamiltonian molecular dynamics simulations were employed to elucidate the dielectric response in the paraelectric phase of (Ba,Sr)TiO3 solid solutions. Analysis of the resulting dielectric spectra suggests the existence of a crossover between two different regimes: a higher-temperature regime governed by the soft mode only versus a lower-temperature regime exhibiting a coupled soft mode/central mode dynamics. Interestingly, a single phenomenological coupling model can be used to adjust the THz dielectric response in the entire range of the paraelectric phase (i.e., even at high temperature). We conclude that the central peak is associated with thermally activated processes, and that it cannot be discerned anymore in the dielectric spectra when the rate of these thermally activated processes exceeds certain characteristic frequency of the system.
pacs:
77.22.Ch,77.22.Gm,78.30.-j, 77.84.-s,63.20.-eIt is well known that the static permittivity of ferroelectric materials is related to frequencies of all polar phonon modes through the Lyddane-Sachs-Teller formula LST . Near the phase transition, however, an additional low-frequency mode has to be often taken into account – the so-called central mode JP ; Axe ; GY ; Ono . A generic reason for this additional Debye-type excitation seems to be large-amplitude fluctuations between quasi-stable off-center ionic positions. Existence of such intrinsic central mode could be very clearly demonstrated, e.g., below the cubic-tetragonal phase transition of BaTiO3 HlinkaPRL .
Similar central mode (CM) is also known to exist in the paraelectric phase. Phenomenological theories of the paraelectric CM have been developed by several authors Axe ; JP ; GY ; PB ; Ono . All these approaches lead to a coupled relaxator-oscillator dielectric response. However, an important question has been left open so far: whether the CM persists up to the highest temperatures, or rather it progressively disappears, or whether it disappears at some well-defined temperature .
Unfortunately, it is much more difficult to obtain a clear-cut experimental evidence for the dielectric CM in the cubic perovskite phase JP ; Vogt ; Inna ; GY . The characteristic frequencies of the soft phonon-oscillator and CM in KNbO3 and BaTiO3 are so broad and close together that they can hardly be disentangled. The difficulty of the experimental analysis of the dielectric spectra of KNbO3 and BaTiO3 is caused, at least partly, by intrinsically large phonon damping factors, related to the fact that is quite high in these compounds (about 700 and 400 K, respectively). Therefore, it is of interest to study the CM also in the ferroelectric compounds in which the phase transition occurs at lower temperatures, which can be achieved for example by mixing BaTiO3 and KNbO3 with suitable incipient ferroelectrics, namely SrTiO3 and KTaO3, respectively.
Here, we describe a combined experimental and theoretical study of the technologically-relevant mixed BaxSr1-xTiO3 system (BST) aimed to establish the characteristic temperature trends in the model parameters of the relaxator-oscillator dielectric response in the polar perovskites. It turns out that this phenomenological theory allows to “easily” understand the existence of the temperature , at which the CM in the dielectric spectra is appearing or disappearing.

Basic dielectric properties of BST solid solutions and the concentration diagram of this system were thoroughly discussed, see e.g. Refs. Shirokov, ; effH, and references therein. Experiments discussed below were carried out with a set of high-density BST ceramics with Ba:Sr ratio ranging from x=0 to x=1, prepared by methods described elsewhere (see Refs. Tana1 ; Tana2 ). Low-frequency permittivity obtained from standard dielectric measurements (10 kHz) in the paraelectric phase was fitted to a Curie-Weiss law
| (1) |
As expected JP ; Shirokov , Curie constants were of the order of K for all concentrations, while the extrapolation temperature turned out to be strongly dependent on the concentration (see the inset of Fig. 1a).
These findings may suggest that at a fixed temperature interval above the extrapolation temperature , the static permittivity is roughly independent of . However, this is not the case for the THz-range dielectric spectra of BST ceramics. In Fig. 1a, we compare dielectric loss spectra obtained similarly as in Refs. Tana1, ; Tana2, from simultaneous fits to time-domain THz transmission and far-IR reflectivity spectra. Although all these spectra are obtained at 100 K above the corresponding temperature , we can see a clear crossover between two rather distinct regimes: a broad-band regime for BaTiO3-rich compounds, and a narrow-band regime for SrTiO3-rich compounds. The narrow response band can be easily adjusted with a single damped harmonic oscillator (DHO) model, while the broad band suggests a more complex spectral shape, such as that of the coupled relaxator-oscillator model.
In order to prove the intrinsic origin of this spectral broadening phenomenon, we have also calculated effHnon ; VCA1 ; VCA2 dielectric spectra of disordered BST solutions by conducting molecular dynamics (MD) simulations using the effective Hamiltonians of Ref. effH, – as previously reported in Refs. Inna, ; HlinkaPRL, . Chemical disorder in the Ba and Sr ion sublattice has been included directly by specifying randomly chosen Ba and Sr ion positions within a simulation supercell representing a 12x12x12 perovskite formula units of BST, assuming periodic boundary conditions. To verify that the results are independent of the particular configuration, simulations were also carried out for several different configurations.
The resulting spectra (see Fig.1 b) are quite monotonously varying with the average Ba concentration in the simulated supercell, even though the Ba ion distribution is obviously different for each concentration. This also confirms that the observed trends are driven by the overall concentration, rather than by the degree of the occupational disorder. As consistent with the experiments, the predicted static dielectric permittivity above obeyed the Curie-Weiss law (Eq. 1). Moreover, simulated loss spectra for temperatures about 100 K above indeed confirmed a similar broadening for BaTiO3-rich compounds as in the measurements (see Fig.1 b).
Despite of this considerable broadening, spectra of Fig. 1 do not show a very clear 2-maximum dielectric loss response, such as the one observed in the A1 spectra of the tetragonal phase of BaTiO3 single crystal HlinkaPRL . We expect that CM and soft mode (SM) components are much better separated in the spectra within the first few tens of K above . However, in this temperature range the THz measurements were not feasible even with very thin ceramic samples because they become too opaque for THz radiation.
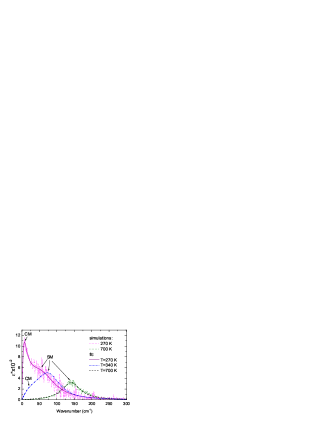
Motivated by this difficulty, we have calculated dielectric spectra of Ba0.5Sr0.5TiO3 (BST50) in a broad range of frequencies and temperatures down to the vicinity of the ferroelectric phase transition using the effective-Hamiltonian approach of Ref. effH, . In order to obtain well-behaved smooth dielectric spectra especially closer to in the low THz regime, MD time-step was chosen to be 0.5 fs and the simulations were conducted for a length of 13.2 ns in order to obtain 10000 samples for averaging the autocorrelation functions Inna . Figure 2 displays the frequency dependence of the imaginary part of dielectric permittivity derived from MD simulations at 270 K ( K and K for simulated BST50). The presence of a lower frequency Debye-like CM in addition to the higher frequency SM is clearly seen there.
To account for the simultaneously appearing SM and CM, we have used the coupled oscillator-relaxator model (following the notation of Ref. HlinkaPRL, ):
| (2) |
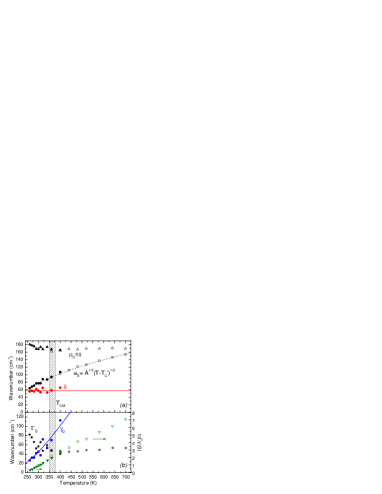
Here , , are the plasma frequency, oscillator frequency and damping constant of the SM, respectively; is the bare relaxation frequency of the CM, is the coupling coefficient, and is the background permittivity note13 . Model parameters of the unconstrained fitting of Eq. 2 to the MD simulation data at various temperatures are shown as full symbols in Fig. 3. For temperatures above K, the CM is not visible in the simulated spectrum and the simple DHO formula (Eq. 2 with ) provides a satisfactory fit (see Fig. 2).
What can we learn from the temperature trends revealed in Fig. 3? First, let us note that Eq. 2 can be considered as an asymptotic case of the dielectric response in the model of two coupled DHO’s, one representing the normal phonon SM, and the other representing the extraneous excitation D JP :
| (6) |
with
| (9) |
where the quantities , , related to the CM have analogous meaning as , , . The coupling term can be chosen positive. Indeed, in the Debye-relaxator limit ( and ) the term can be neglected against and the above matrix reduces to that of the coupled relaxator-oscillator model JP . In this case, four parameters , , and can be replaced by only three parameters - the relaxational frequency , the coupling frequency , and an auxiliary frequency
| (10) |
With these substitutions (Eq. 10) and for , , and or , the expression of Eq. 6 reduces to the formula of Eq. 2.
Previously, several authors JP ; GY ; PB treated the problem of paraelectric CM in perovskites and derived a frequency dependence of the dielectric permittivity in the form equivalent to eqs. 2 or 6–9. Common assumption in all these approaches JP ; GY ; PB is that the Curie-Weiss behavior of the static permittivity results from the Cochran-like temperature dependence of the SM frequency with a ”Cochran” temperature . This is indeed well obeyed here (with cm-2K-1 and K for BST50, see Fig. 3). However, the implications for the temperature dependence of and are quite different among these models. In the spirit of Ref. JP, , one could assume that and either do not change with temperature since the bare D-mode is not contributing to the ordering mechanism, or perhaps, that (model A)
| (11) |
and
| (12) |
when assuming in Eq. (10) that the D-mode damping increases with the temperature like . Bare pseudospins in the model of Ref. GY, are considered as freely fluctuating bistable dipoles forming an ideal paraelectric gas with Arrhenius relaxation law, which leads to (model B)
| (13) |
and
| (14) |
where is a potential barrier and is an attempt frequency. In a similar model applied to BaTiO3 in Ref. PB, , one assumes that bare pseudospin subsystem would order at a finite temperature , with and the resulting formulas for and read (model C)
| (15) |
and
| (16) |
Comparison of the anticipated temperature trends with the outcome of our MD simulations shown in Fig. 3 indicates that none of the above three models is fully satisfactory. As a matter of fact, the MD results suggest that the coupling term is constant (or it perhaps slightly increases with the increasing temperature), which is compatible with the model A only, while the increasing rather supports the thermally activated flipping, assumed in models B or C. Tentatively, we have fitted the temperature dependence of to the Arrhenius law of Eq. 14 in the 260-400 K temperature range. It gives reasonable values of meV and cm-1.
In fact, it turns out that the BST50 dielectric spectra can be well fitted at all temperatures (i.e., even above !) when keeping cm-1 and described by the aforementioned Arrhenius law (fitted parameters are shown by open symbols in Fig. 3). In other words, the coupled relaxator-oscillator model (Eq. 2) can be used in the whole temperature range above , without any particular discontinuity in the temperature course of the model parameters near the temperature .
So why does the CM seem to ”disappear” from the BST50 spectrum at ? In order to understand this behavior, it is convenient to consider the formula of Eq. 2 as the response of a DHO with a frequency-dependent self-energy term
| (17) |
From this expression, it is obvious that the simple DHO formula is recovered when , since in this case the imaginary part of the self-energy becomes simply . Therefore, it is reasonable to define the temperature as the temperature at which . Since the temperature dependence of is steep, the temperature-driven crossover between and is quite sharp. With the data of Fig. 3, this crossover temperature is about . Moreover, in case of Arrhenius law for , one obtains
| (18) |
showing that scales with the activation energy .
This kind of crossover temperature likely bears some resemblance with the so-called Burns temperature and temperature, that have been observed in some complex perovskite materials DulkinBTO ; DulkinPMN ; Burns , since they all may be associated with change of dynamics.
In summary, we provide interpretation of experiments and MD simulations suggesting that permittivity of BST system in the paraelectric phase shows a crossover between a high-temperature spectrum with a simple SM and a lower-temperature spectrum with a more complex shape involving an additional CM that is coupled to the SM. Analysis of MD simulations allowed us to select convenient formula for the temperature evolution of the model parameters, leading to a deviation with respect to previous theoretical predictions when CM and SM are coupled. As a matter of fact, these MD results indicate a thermally activated dynamics in a postulated pseudospin subsystem and their almost temperature-independent pseudospin-phonon coupling coefficient. Furthermore and interestingly, the dielectric spectra of BST50 from MD simulations could also be analyzed using this original coupled CM-SM model at any temperature above (i.e., even in the high-temperature regime). As a result, the appearance of the CM in the dielectric spectra is understood as a crossover between fast and slow pseudospin dynamics. Arrhenius-type temperature dependence of bare pseudospin dynamics allows to understand the abrupt change of the spectrum at this crossover, which thus appears almost as a phase transition.
Acknowledgements.
We thank Jan Petzelt for useful discussions. J.H. acknowledge the support of the Czech Ministry of Education (Project MSMT ME08109). J.W. and L.B. acknowledge the financial support of NSF DMR-1066158 and DMR-0701558. They also acknowledge ONR Grants N00014-11-1-0384 and N00014-08-1-0915, the Department of Energy, Office of Basic Energy Sciences, under contract ER-46612, and ARO Grant W911NF-12-1-0085 for discussions with scientists sponsored by these grants. I.P. acknowledges the financial support of the Department of Energy, Office of Basic Energy Sciences under grant DE-SC0005245. Some computations were also made possible thanks to the MRI grant 0722625 from NSF, ONR grant N00014-07-1-0825 (DURIP), and a Challenge grant from the Department of Defense.References
- (1) R. H. Lyddane, R. G. Sachs, and E. Teller, Phys. Rev. 59, 673 (1941).
- (2) J. Petzelt, G. V. Kozlov, and A. A. Volkov, Ferroelectrics 73, 101 (1987).
- (3) S. M. Shapiro, J. D. Axe, G. Shirane, and T. Riste, Phys. Rev. B 6, 4332 (1972).
- (4) Y. Girshberg and Y. Yacobi, Solid State Commun. 103, 425 (1997).
- (5) R. Pirc and R. Blinc, Phys. Rev. B 70, 134107 (2004).
- (6) Y. Onodera, J. Phys. Soc. Jpn. 73, 1216 (2004).
- (7) J. Hlinka, T. Ostapchuk, D. Nuzhnyy, J. Petzelt, P. Kuzel, C. Kadlec, P. Vanek, I. Ponomareva, and L. Bellaiche, Phys. Rev. Lett. 101, 167402 (2008).
- (8) H. Vogt, J. A. Sanjurjo, and G. Rossbroich, Phys. Rev. B 26, 5904 (1982).
- (9) I. Ponomareva, L. Bellaiche, T. Ostapchuk, J. Hlinka, and J. Petzelt, Phys. Rev. B 77, 012102 (2008).
- (10) V. B. Shirokov, V. I. Torgashev, A. A. Bakirov, and V. V. Lemanov, Phys. Rev. B 73, 104116 (2006).
- (11) L. Walizer, S. Lisenkov, and L. Bellaiche, Phys. Rev. B 73, 1144105 (2006).
- (12) T. Ostapchuk, J. Petzelt, P. Kuzel, M. Savinov, J. Hlinka, A. Tkach, P. M. Vilarinho, S. Lisenkov, I. Ponomareva, and L. Bellaiche, Phase Transitions 83, 955 (2010).
- (13) T. Ostapchuk, J. Petzelt, J. Hlinka, V. Bovtun, P. Kuzel, I. Ponomareva, S. Lisenkov, L. Bellaiche, A. Tkach, and P. Vilarinho, J. Phys: Condens. Matter 21, 474215 (2009).
- (14) Similar spectra, as e.g. those of Ref. Tana2, are often fitted to a sum of two independent DHO’s. It is important to note that the present model has less parameters and still gives a very good description of the data.
- (15) W. Zhong, D. Vanderbilt, and K. M. Rabe, Phys. Rev. Lett. 73, 1861 (1994); Phys. Rev. B 52, 6301 (1995).
- (16) L. Bellaiche and D. Vanderbilt, Phys. Rev. B 61, 7877 (2000).
- (17) N. J. Ramer and A. M. Rappe, J. Phys. Chem. Solids 61, 317 (2000).
- (18) E. Dul’kin, J. Petzelt, S. Kamba, E. Mojaev, and M. Roth, Appl. Phys. Lett. 97, 032903 (2010).
- (19) M. Roth, E. Mojaev, E. Dul’kin, P. Gemeiner, and B. Dkhil, Phys. Rev. Lett. 98, 265701 (2007).
- (20) G. Burns and F. H. Dacol, Solid State Commun. 48, 853 (1983).