A Stacked Analysis of Brightest Cluster Galaxies Observed with the Fermi Large Area Telescope
Abstract
We present the results of a search for high-energy -ray emission from a large sample of galaxy clusters sharing the properties of three existing Fermi-LAT detections (in Perseus, Virgo and Abell 3392), namely a powerful radio source within their brightest cluster galaxy (BCG). From a parent, X-ray flux-limited sample of 863 clusters, we select 114 systems with a core-dominated BCG radio flux above 50/75 mJy (in the NVSS and SUMSS surveys, respectively), stacking data from the first 45 months of the Fermi mission in three energy bands, to determine statistical limits on the -ray fluxes of the ensemble of candidate sources.
For a 300 MeV selection, the distribution of detection significance across the sample is consistent with that across control samples for significances 3, but has a tail extending to higher values, including three 4 signals which are not associated with previously identified -ray emission. Modelling of the data in these fields results in the detection of four non-2FGL Fermi sources, though none of these appear to be unambiguously associated with the BCG candidate. Only one is sufficiently close to be a plausible counterpart (RXC J0132.60804), and the remaining three appear to be background AGN. A search at energies 3 GeV hints at emission from the BCG in A 2055, which hosts a BL Lac object.
There is no evidence for a signal in the stacked data, and the upper limit derived on the -ray flux of an average radio-bright BCG in each band is at least an order-of-magnitude more constraining than that calculated for individual objects. for an average BCG in the sample is 15, compared with 120 for NGC 1275 in Perseus, which might indicate a special case for those objects detected at high energies. The tentative suggestion that point-like beamed emission from member galaxies comprise the dominant bright -ray sources in clusters, implies searches for evidence of dark matter annihilation or large scale merger shock signatures for example, need to account for a significant level of contamination from within each cluster, that is both highly stochastic and varies significantly over time.
keywords:
galaxies: active – galaxies: clusters: general – gamma rays: observations – radio continuum: general – radiation mechanisms: non-thermal – (galaxies:) cooling flows1 Introduction
Feedback from the central active galactic nucleus (hereafter AGN) within a cooling-core cluster of galaxies is considered to play an integral large-scale role in the suppression of the observed cooling flow (see e.g. Fabian et al., 2002; Sijacki et al., 2007; Bower et al., 2006). The hot, diffuse, intracluster gas, which comprises 90% of the baryonic matter of the cluster and is bound gravitationally by a cold dark matter (DM) halo, is revealed observationally through thermal Bremsstrahlung emission in the X-ray band. From velocity dispersion measurements, the atmosphere of this intracluster medium (ICM) typically has a temperature between and (McNamara & Nulsen, 2007). The gas loses energy to radiation primarily in the X-ray band, condensing onto the central galaxy, and sub-sonic, pressure-driven inflows develop within the dense cooling region, where the radiative cooling time for such emission , is less than the age of the system (Fabian, 1994).
However, as evidenced by spectroscopic data from current-generation X-ray observatories Chandra and XMM-Newton, emission predicted by the standard cooling-flow model from expected quantities of cooling gas is not detected (Peterson et al., 2003). This soft X-ray deficit necessitates some reheating mechanism that acts to replenish the energy being radiated away, thus quenching the cooling flow. An attractive agent for this feedback is the central AGN, whose outbursts would not only resolve the dearth of X-ray luminosity, but also account for the measured truncation at the high-mass end of the galaxy luminosity function (Benson et al., 2003).
Support for this explanation is given by high-resolution observations of cavities in the X-ray halo of many systems (e.g. Fabian et al., 2000; McNamara et al., 2000), coincident with radio synchrotron emission associated with the activity of the central engine. The AGN in the brightest cluster galaxy (hereafter BCG) injects energy into the ICM in the form of bubbles containing relativistic particles, which displace the thermal gas. So-called ‘ghost cavities’ have also been found using Chandra, interpreted as relics of past AGN activity; bubbles that have previously detached from the radio lobes and risen buoyantly through the ICM, no longer bright at . They are now known to be filled with low-frequency radio synchrotron emission (e.g. Clarke et al., 2005; Wise et al., 2007). This evidence implicates AGN outbursts as intermittent phenomena; the power output averaged over time of the central engine able to balance the radiative cooling of the cluster core. For a review of AGN heating in clusters of galaxies, see McNamara & Nulsen (2007).
Both models of galaxy formation/clustering, and of feedback, and observations (including those aforementioned in the hard X-ray and radio bands), establish galaxy clusters as hosts to significant non-thermal particle populations (Völk & Atoyan, 1999; Blasi et al., 2008). The remaining tracer of cosmic ray (CR) acceleration is radiation, and several emission scenarios predict BCGs to be sources of high-energy (HE) and very-high-energy (VHE) photons, with spectra dependent on the dominant energy content of the AGN jets; the nature of the seed particles they inject into the ICM, the strength of the local magnetic field, and the target density around the inflated bubbles (e.g. Hinton et al., 2007).
Ultra-relativistic particles may play an important role on several different scales in and around BCGs in cooling-core clusters, for example in AGN jets, mini-halos, and cluster-scale halos. -ray emission may arise in each via a number of dissimilar processes (e.g. Pfrommer & Enßlin, 2004). Primary CR electrons accelerated in jets, or re-accelerated fossil CRs in mini-halos will produce inverse Compton (IC) emission. Inelastic proton-proton collisions of hadronic CRs on the target medium will lead to decay emission and IC emission from secondary (or cascade) (e.g. Blasi & Colafrancesco, 1999; Aharonian, 2002) electrons. Most of these BCG-driven processes will produce GeV emission that is point-like for current detectors. However, it should be noted that – being massive and DM-dominated – clusters of galaxies are expected sources of extended -ray emission via DM annihilation (Ackermann et al., 2010a). Similarly, treating galaxy clusters as long-term reservoirs of CR hadrons, diffuse HE emission from decay of particles accelerated (for example) in cluster-scale accretion shocks is theorised (e.g. Pfrommer & Enßlin, 2004). The various emission scenarios produce different spectral, temporal and spatial signatures at GeV energies. The repository of HE data afforded by the Fermi Gamma-ray Space Telescope (hereafter Fermi) since its launch in 2008, is therefore an attractive resource when used in conjunction with multiwavelength data. Whilst a detection of extended cluster emission at GeV energies is yet to be made (Ackermann et al., 2010b), point-like emission from a number of BCGs is seen and there is considerable potential for improving our understanding of this class of objects using GeV data.
To date, excluding systems whose AGN jets are favourably aligned close to the observer’s line of sight so as to boost emission via relativistic beaming – associated with ‘BL Lac’ objects within the unified model of active galaxies (Antonucci, 1993) – only two BCGs have been confirmed as emitters of HE rays. These are NGC 1275 and M 87 (Abdo et al., 2009a, b): the dominant member galaxies of the cooling-core clusters Perseus and Virgo, respectively. Both are known to host bright central radio sources associated with the active nucleus (see Vermeulen et al. (1994); Asada et al. (2006) and Biretta et al. (1991); Sparks et al. (1996)), and are also detected at very-high energies (Aleksić et al., 2012; Aharonian et al., 2006). The multiwavelength emission of AGN is characteristically variable, and indeed the -ray flux is found to vary on timescales down to days in the case of NGC 1275 (Brown & Adams, 2011); similarly for M 87 (Abramowski et al., 2012). Light-crossing-time arguments thus restrict the physical size of the emitting region responsible for, at least a component of, the -ray emission.
These sources are HE laboratories for the class of BCGs, and motivate a search for further instances of -ray activity within it. The purpose of this work is to conduct such a search, using data from the Large Area Telescope (LAT) on board the Fermi satellite, accumulated thus far over the mission lifetime. To this end, we set out to imitate a deeper observation than is currently achievable in HE rays given the sensitivity of the Fermi-LAT, by constructing a sample of many potential sources within the BCG class, and stacking the output of individual analyses.
2 Target Selection
Considering NGC 1275 to be prototypical of -ray sources within the class of BCGs, our selection criteria were therefore designed to identify similar objects. The key requirements were the presence of a massive cluster of galaxies and evidence of non-thermal activity in the BCG. We constructed a sample of candidates drawn from five parent catalogues of X-ray flux-limited galaxy clusters: the Brightest 55 (B55) Sample (Edge et al., 1990), the ROSAT Bright Cluster Sample (BCS) (Ebeling et al., 1998), the extended ROSAT Bright Cluster Sample (eBCS) (Ebeling et al., 2000), the ROSAT-ESO Flux-Limited X-ray (REFLEX) Galaxy Cluster Survey Catalogue (Böhringer et al., 2004), and the MAssive Cluster Survey (MACS) (Ebeling et al., 2001), encompassing objects from both the Southern and Northern hemispheres and including the brightest clusters from low Galactic latitudes. We include two clusters (RXC J1350.3+0940 and RXC J1832.5+6848) that meet the eBCS flux limit but were mis-identified as AGN when the sample was published, due to the presence of a bright radio source, and for comparison, two X-ray-luminous clusters that contain known AGN (4C+55.16 (Hlavacek-Larrondo et al., 2011), and E 1821+643 (Russell et al., 2010)) though the cluster emission falls just below the eBCS limit once the AGN contribution is taken into account.
From this sample of 863 unique clusters (accounting for the small overlap between these five samples), we selected the 151 systems in which the BCG is detected above in the NRAO VLA Sky Survey (NVSS) (Condon et al., 1998) or in the Sydney University Molonglo Sky Survey (SUMSS) (Mauch et al., 2003). We took care to remove systems where the radio emission is from a cluster member projected close to the BCG. Of this sample we have higher resolution radio imaging from the VLA or ATCA telescopes at 5 and/or for the majority (114 of 151), which can be used to identify those sources with a significant, flat spectrum core component (Hogan et al., prep).
We have optical spectra for 148 of the 151 BCGs recognised by our radio selection, and of these 64% (97 objects), exhibit optical line emission. This is significantly higher than the 25–30% of BCGs in an X-ray selected sample presenting line emission, indicating that our radio selection strongly prefers clusters with a cooling flow (Burns, 1990; Cavagnolo et al., 2008; Mittal et al., 2009; Hogan et al., prep).
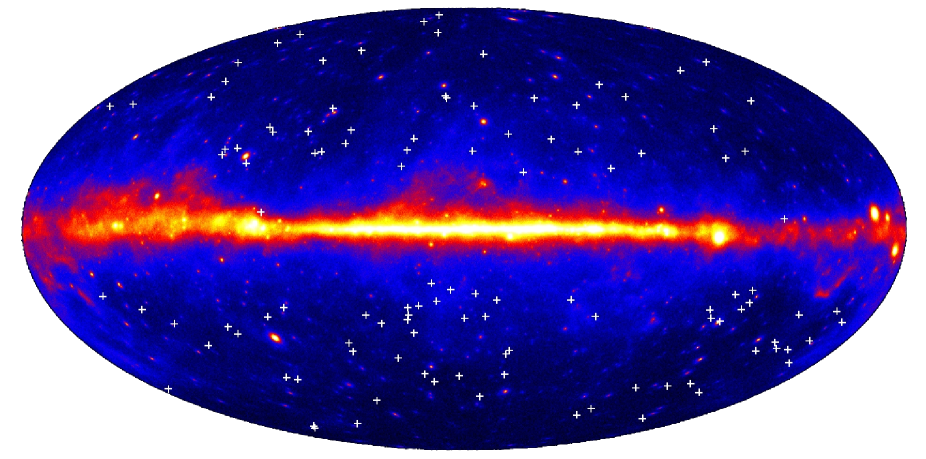
The sample represents a complete selection of radio-bright clusters that is dominated by cooling-core clusters, spanning a wide range in redshift (). It can be divided into BCGs whose radio emission has some contribution from the core or is core-dominated, and those with extended radio morphology and a lobe-dominated radio flux. The former comprise 114 objects and constitute the ‘main sample’ (see Figure 1 and Table LABEL:tab:sample), with the remaining 37 BCGs forming an ‘extended sample’. We compiled a counter sample of 65 ‘control’ clusters drawn from the parent X-ray sample that do not contain a radio-bright BCG, nor optical emission lines, but share the same redshift distribution as the radio bright sample for a representative comparison. We also generated a pair of control samples of 114 candidate sources each with random positions on the sky (generated by performing first a positive and then a negative 5° shift in Galactic latitude on the coordinates of the main sample candidates) for direct comparison with the main sample.
The parent clusters of the main sample BCGs include hosts to five BL Lac objects, two of which are known HE -ray sources listed in the Fermi-LAT Second Source Catalog (2FGL) (Nolan et al., 2012): 2FGL J0627.13528 in A 3392 and 2FGL J1958.4-3012 in RXC J1958.23011. The other three BL Lacs, RGB J1144+676 in A1366, RGB J1518+062 in A2055 and B2 2334+23 in A 2627, are not known Fermi sources. These BL Lacs are included as the original cluster identification from the ROSAT Survey incorrectly attributed the (bulk of the) X-ray emission to the cluster (e.g. RXC J1958.23011, Böhringer et al., 2004). However, in all five cases, pointed Chandra or XMM-Newton observations indicate that the BL Lac dominates the emission, so the cluster does not meet the X-ray flux limit applied to select the other clusters. Therefore even this small Fermi-LAT detection fraction is an upper limit, given only NGC 1275 (a misaligned blazar) and M 87 (a radio galaxy) are dominated by the extended X-ray emission from their host cluster, and hence meet the cluster selection criteria. For the purpose of the analyses detailed hereafter, these two well-studied BCGs are not included in the sample, since our aim is to identify whether any additional sources in the class are detected using Fermi . There is no clear cluster around RXC J1958.23011, so its classification as a BCG is not certain, but with this caveat in mind it is kept, particularly as an additional Fermi source to check the output of analyses against.
3 Fermi-LAT Observations and Data Analysis
The Fermi-LAT is a pair conversion instrument sensitive to photons of energy 20 MeV – 300 GeV, with a wide field of view (2.4 sr) and large effective area (8000 on axis at ). The detector is described in detail in Atwood et al. (2009) and references therein. Fermi observations are taken primarily in all-sky-survey mode, in which the spacecraft is pointed at some angle from the zenith, and rocked north and south of its orbital plane, scanning the whole sky every 3 hours.
The 151 BCGs of our main and extended samples were treated as candidate point sources of HE rays, and each analysed using the Fermi Science Tools version v9r27p1, and instrument response function (IRF) P7SOURCEV6. Event and spacecraft all-sky-survey data amassed between the 4th of August 2008 and the 28th of April 2012 (a Mission-Elapsed-Time interval of 239557417 to 357308125, equating to 1362 days) were extracted for a source region (SR) of 12°, centred on each BCG position (taken from optical data in the literature) and in the energy range (thus discarding events at the lowest energies, where the high point spread function (PSF) results in considerable source confusion). A zenith cut of 100° was applied to eliminate rays from the Earth’s limb, and all ‘Source’ class events were considered.
For each candidate source the data were fitted to a source model constructed to describe (in addition to potential emission from the target BCG), the emission from nearby (i.e. within the SR) 2FGL sources, and the diffuse Galactic and extragalactic (isotropic) -ray backgrounds (thus recent models gal_2yearp7v6_v0.fits and iso_p7v6source.txt respectively111http://fermi.gsfc.nasa.gov/ssc/data/access/lat/BackgroundModels.html were utilised; their normalisation free to vary). The photon index and normalisation for objects within 1° of the candidate position were allowed to vary. Outside of this region but within the specified region of interest (ROI) of 8°, the normalisation was free to vary, but the photon index was fixed to the 2FGL value. Sources outside of the ROI but within the SR were included in the model, but their aforementioned parameters were fixed to the catalogue values. In the event that a candidate position coincided with a 2FGL source (within 0.2°), then that source was automatically removed from the model. This action provides a useful check of the output of our analyses against the catalogue values for known Fermi sources, whilst allowing all BCGs in the sample to be treated in the same way.
The maximum-likelihood spectral estimator gtlike was used to perform a binned fit, modelling the candidate source emission with a power law spectrum. gtmodel was then used to obtain a model map of each candidate region given the result of the fit. To construct counts maps from the data gtbin was utilised. Binned exposure cubes were also generated (through use of the gtexpcube2 tool) as part of the binned likelihood analysis chain. A binned method of likelihood fitting was adopted over an unbinned one, because it was found to be more robust, the fit converging irrespective of how many 2FGL sources a given SR contained.
The distribution of Test Statistic (TS) values (output by gtlike) across the sample could then be studied. A critical TS of 25 (corresponding roughly to a detection significance of 5 (Mattox et al., 1996)) was decided upon, below which an upper limit on the source emission was automatically calculated. All candidate sources with TS 16 were nevertheless investigated on an individual basis: TS maps were constructed and any peaks found thereon fitted with parabolic ellipsoids to localise the emission. Where appropriate the data were then remodelled to constrain potential new offset sources.
The ensemble of counts maps constructed from the sample data, and that of the model maps output from fitting based on a null hypothesis (that is, the absence of a candidate Fermi source at the position of the BCG), were stacked. These stacked maps could then be sliced to provide 1-D comparisons between the summed model fit and the data. To derive an upper limit on the -ray flux of an average source in our sample using this stacking method, the stacked counts map was used to obtain a number of on-source counts () within a region of radius comparable with the PSF of the LAT instrument on average across the selected energy band. An estimate of the number of background photons in this region, was obtained by similarly integrating the stacked model map. The number of off-source counts () is then where is taken as the ratio of the solid angle in the chosen radius to that of the field of view. Thus an estimate of the -ray signal present is given by the excess counts, . A 95% confidence upper limit on the signal was computed following the method of Rolke et al. (2005), assuming only Poisson errors on the background estimate. Whilst a more sophisticated likelihood method similar to that used by Huber et al. (2012) may provide a modest sensitivity improvement, our approach is simple and robust.
Weighted exposure maps were constructed for each candidate source and stacked, to provide a summed exposure map from which the exposure averaged over solid angle in the on-region could be determined. This value was used to transform our signal upper limit to an upper limit on the -ray flux. The rms variation in exposure across the sample is 6%.
For the purpose of investigating potential weak, hard spectrum, candidate source emission; less contaminated by the diffuse background, and given that stacking is most promising in the signal-limited regime, where every additional field adds potential source photons with minimal cost in background contamination, energy cuts above and were applied to the data and the analyses repeated in an otherwise identical manner; upper limits calculated within regions of radii comparable to the LAT PSF at the respective lower energy bounds. Corresponding analyses were performed simultaneously for the control and radio-quiet samples.
4 Results
A summary of the source properties of the BCGs of the main sample; their respective TS values and/or upper limits output from the analysis procedure outlined in §3 is given in Table LABEL:tab:sample. For the sake of clarity, the test statistic is shown as zero for sources with TS 1. An upper limit is included for sources with TS 25. Those BCGs with TS 25 are in:
-
A 3392
-
RXC J1958.23011
-
MACS J1347.51145
As noted in §2, the sources in A 3392 and RXC J1958.23011 correspond to the known Fermi sources 2FGL J0627.13528 and 2FGL J1958.43012, respectively. The BCG in MACS J1347.51145 is not in the 2FGL catalogue. These sources, and those that fall shy of the TS cut, but for which TS is greater than 16 are discussed in §4.3 below.
| Parent Cluster | l∗ (°) | b† (°) | z | 1.4 GHz‡ Radio | TS†† | -ray Flux Upper |
|---|---|---|---|---|---|---|
| Flux (mJy) | Limit () | |||||
| RXCJ0000.1+0816 | 101.9 | -52.5 | 0.04 | 84 c | 0 | |
| A85 | 115.3 | -72.0 | 0.056 | 58 c | 0 | |
| Z235 | 120.8 | -38.4 | 0.083 | 50 c | 3.2 | |
| 3C31 | 126.9 | -30.3 | 0.016 | 1108 e | 2.2 | |
| RXCJ0132.6-0804 | 152.0 | -68.6 | 0.15 | 308 c | 24.0 | |
| MACSJ0242.5-2132 | 206.6 | -64.1 | 0.31 | 1255 c | 0 | |
| A3112 | 253.0 | -56.1 | 0.075 | 1915 c | 11.2 | |
| A496 | 209.7 | -36.5 | 0.033 | 121 c | 5.8 | |
| RXCJ0439.0+0520 | 191.4 | -26.2 | 0.21 | 82 c | 6.0 | |
| NGC1650 | 214.0 | -34.9 | 0.036 | 91 c | 0 | |
| S555 | 243.6 | -26.3 | 0.044 | 319 c | 0 | |
| A3378 | 241.9 | -24.0 | 0.14 | 1337 c | 0 | |
| A3392 | 243.5 | -20.0 | 0.055 | 4513 b | 221.0 | – |
| PKS0745-191 | 236.5 | 3.0 | 0.1 | 2373 c | 13.7 | |
| A646 | 172.7 | 34.6 | 0.13 | 54 c | 0 | |
| 4C+55.16 | 162.3 | 36.6 | 0.24 | 8284 c | 1.6 | |
| Hydra-A | 243.0 | 25.1 | 0.054 | 40850 c | 2.7 | |
| MACSJ1133.2+5008 | 150.7 | 62.6 | 0.39 | 846 e | 0 | |
| A1348 | 277.4 | 47.1 | 0.12 | 158 c | 0 | |
| A1366 | 132.6 | 48.5 | 0.12 | 237 b | 0 | |
| NGC4696 | 302.5 | 21.6 | 0.0098 | 5674 e | 0 | |
| MACSJ1347.5-1145 | 324.1 | 48.8 | 0.45 | 48 c | 43.4 | – |
| A1795 | 33.9 | 77.2 | 0.062 | 925 e | 0 | |
| RXCJ1350.3+0940 | 344.3 | 67.7 | 0.13 | 293 c | 0 | |
| A3581 | 323.2 | 32.9 | 0.023 | 646 c | 7.4 | |
| A1885 | 83.2 | 66.6 | 0.089 | 49 c | 0 | |
| S780 | 341.0 | 35.1 | 0.24 | 106 c | 1.5 | |
| RXCJ1504.1-0248 | 355.1 | 46.2 | 0.22 | 62 c | 7.3 | |
| A2052 | 9.5 | 50.1 | 0.035 | 5500 c | 0 | |
| A2055 | 8.9 | 49.3 | 0.1 | 498 b | 8.0 | |
| RXCJ1524.2-3154 | 337.1 | 20.7 | 0.1 | 50 c | 2.0 | |
| RXCJ1558.3-1410 | 356.6 | 28.7 | 0.097 | 461 c | 1.7 | |
| A2199 | 63.0 | 43.7 | 0.03 | 3681 e | 1.5 | |
| NGC6338 | 85.9 | 35.4 | 0.028 | 57 c | 0 | |
| Z8193 | 67.6 | 34.7 | 0.18 | 134 c | 0 | |
| A2270 | 83.1 | 33.8 | 0.24 | 144 c | 2.6 | |
| Z8276 | 58.0 | 27.6 | 0.076 | 92 c | 0 | |
| RXCJ1750.2+3504 | 60.6 | 27.0 | 0.17 | 69 c | 0 | |
| E1821+643 | 94.1 | 27.4 | 0.3 | 94 e | 1.3 | |
| RXCJ1832.5+6848 | 99.2 | 26.8 | 0.2 | 150 c | 0 | |
| A3639 | 347.0 | -26.3 | 0.15 | 139 c | 0 | |
| RXCJ1931.6-3354 | 5.2 | -22.5 | 0.097 | 886 c | 0 | |
| MACSJ1931.6-2634 | 12.6 | -20.1 | 0.35 | 223 c | 7.4 | |
| RXCJ1958.2-3011 | 11.0 | -26.8 | 0.12 | 128 b | 46.3 | – |
| Cyg-A | 76.3 | 5.8 | 0.056 | 1590000 e | 4.5 | |
| S851 | 351.0 | -32.6 | 0.0097 | 139 c | 0 | |
| RXCJ2014.8-2430 | 18.4 | -28.5 | 0.16 | 230 e | 0 | |
| A2390 | 74.0 | -27.8 | 0.23 | 236 c | 11.2 | |
| RXCJ2213.1-2754 | 22.3 | -55.0 | 0.061 | 76 c | 0 | |
| A3880 | 18.1 | -58.5 | 0.058 | 228 c | 4.0 | |
| A2597 | 65.4 | -64.9 | 0.085 | 1875 e | 0 | |
| A2627 | 101.8 | -35.9 | 0.13 | 434 b | 9.8 | |
| A2634 | 103.6 | -33.1 | 0.03 | 1037 e | 0 | |
| RXCJ0137.2-0911 | 156.3 | -69.1 | 0.041 | 178 e | 0 | |
| A262 | 136.6 | -25.1 | 0.017 | 67 e | 0 | |
| A2984 | 256.6 | -68.9 | 0.1 | 232 c | 0 | |
| A3017 | 256.6 | -65.7 | 0.22 | 127 c | 3.3 | |
| Z808 | 175.4 | -47.3 | 0.17 | 393 e | 0 | |
| A407 | 150.7 | -19.9 | 0.048 | 661 c | 0 | |
| RXCJ0331.1-2100 | 212.3 | -53.2 | 0.19 | 168 c | 0 | |
| NGC1399 | 236.8 | -53.6 | 0.0051 | 2500 e | 2.9 | |
| A3165 | 226.4 | -51.4 | 0.14 | 921 c | 0 | |
| RXCJ0359.1-0319 | 193.4 | -39.3 | 0.12 | 188 e | 0 | |
| RXCJ0425.8-0833 | 203.4 | -36.2 | 0.04 | 112 e | 0 | |
| MACSJ0429.6-0253 | 197.9 | -32.6 | 0.4 | 139 c | 0 | |
| A499 | 218.5 | -38.3 | 0.15 | 158 e | 0 | |
| RXCJ0501.4+0110 | 198.5 | -23.7 | 0.12 | 121 c | 0 | |
| MACSJ0520.7-1328 | 215.3 | -26.1 | 0.34 | 93 c | 0 | |
| A3360∗∗ | 249.4 | -30.7 | 0.085 | 222 c | 0 | |
| S547 | 254.2 | -30.0 | 0.051 | 143 e | 0 | |
| A3380 | 257.2 | -27.3 | 0.055 | 1455 e | 1.0 | |
| A3396 | 250.0 | -21.6 | 0.18 | 614 e | 2.5 | |
| A795 | 217.1 | 40.2 | 0.14 | 116 c | 1.1 | |
| S617 | 253.3 | 23.3 | 0.034 | 105 e | 7.3 | |
| A907 | 249.4 | 33.3 | 0.17 | 69 c | 0 | |
| A923 | 205.3 | 53.3 | 0.12 | 73 c | 0 | |
| Z3179 | 228.7 | 53.1 | 0.14 | 94 c | 6.6 | |
| Z3916 | 144.7 | 54.4 | 0.21 | 66 c | 0 | |
| A1361 | 153.4 | 66.6 | 0.12 | 864 e | 0 | |
| A3490 | 287.8 | 26.5 | 0.07 | 368 e | 0 | |
| A1412 | 128.4 | 43.1 | 0.083 | 73 e | 0 | |
| MACSJ1206.2-0847 | 284.5 | 52.4 | 0.44 | 161 e | 0 | |
| A1644 | 305.0 | 45.4 | 0.047 | 98 c | 0 | |
| A1677 | 84.0 | 85.1 | 0.18 | 76 c | 0 | |
| NGC5098 | 78.8 | 81.3 | 0.036 | 83 c | 0 | |
| A3565 | 313.6 | 28.0 | 0.012 | 3000 e | 0 | |
| MACSJ1411.3+5212 | 97.6 | 60.8 | 0.46 | 22720 e | 0 | |
| A2204 | 21.2 | 33.2 | 0.15 | 70 c | 0 | |
| HerA | 23.1 | 28.9 | 0.15 | 34000 e | 3.6 | |
| NGC6269 | 49.1 | 35.9 | 0.035 | 51 c | 3.0 | |
| RXCJ1715.1+0309 | 24.5 | 22.8 | 0.13 | 165 c | 0 | |
| RXCJ1720.1+2637 | 49.3 | 30.9 | 0.16 | 89 e | 0 | |
| RXCJ1840.6-7709 | 317.3 | -25.8 | 0.019 | 1152 e | 0 | |
| RXCJ1852.1+5711 | 87.1 | 22.4 | 0.11 | 51 c | 0 | |
| A2312 | 99.0 | 24.8 | 0.095 | 79 c | 5.4 | |
| A3638 | 355.4 | -24.0 | 0.077 | 258 c | 0 | |
| IC4991 | 359.9 | -33.2 | 0.019 | 109 c | 16.0 | |
| S868 | 22.9 | -29.1 | 0.056 | 229 c | 0 | |
| RXCJ2034.9-2143 | 23.2 | -32.0 | 0.19 | 82 c | 0 | |
| RXCJ2043.2-2144 | 23.9 | -33.8 | 0.2 | 295 e | 0 | |
| A2331 | 40.9 | -31.7 | 0.079 | 106 e | 5.3 | |
| RXCJ2101.5-1317 | 35.4 | -34.8 | 0.028 | 1200 e | 0 | |
| RBS1712 | 22.2 | -38.8 | 0.19 | 67 c | 0 | |
| APM699 | 338.1 | -45.7 | 0.082 | 152 e | 11.7 | |
| RXCJ2151.3-5521 | 339.2 | -47.1 | 0.038 | 108 e | 9.3 | |
| A2384 | 33.4 | -48.4 | 0.096 | 54 c | 0 | |
| A2389 | 53.7 | -41.8 | 0.15 | 78 c | 0 | |
| A2415 | 54.0 | -45.1 | 0.058 | 187 c | 0 | |
| A3856 | 2.8 | -56.2 | 0.14 | 186 e | 0 | |
| A2445 | 83.0 | -30.8 | 0.17 | 77 c | 6.0 | |
| A3911 | 336.7 | -55.4 | 0.097 | 418 e | 0 | |
| S1101 | 348.4 | -64.8 | 0.056 | 472 c | 0 | |
| A4023 | 304.7 | -31.7 | 0.19 | 143 e | 0 | |
| A2665 | 97.0 | -53.6 | 0.057 | 56 c | 0 | |
| 11footnotetext: Galactic longitude 22footnotetext: Galactic latitude 33footnotetext: Taken from the NVSS. If italicised, the values instead denote the 843 MHz radio flux taken from the SUMSS 88footnotetext: Test Statistic – for clarity TS values 1 are shown as zero 77footnotetext: Despite a low TS, this source was not included in the stacked analysis (see §4.2) due to the proximity of a bright 2FGL source, as detailed in the text |
4.1 Distribution of Detection Significance
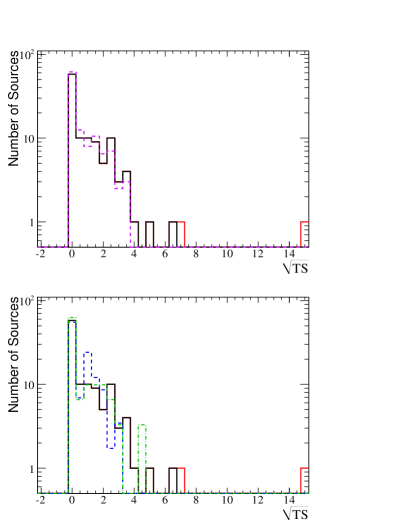
The distribution of (corresponding approximately to the statistical significance, see §3) for each sample analysed is shown in Figure 2. The extended and radio-quiet cluster samples have been scaled appropriately, and the control samples averaged, so that comparisons may easily be made with the main sample of 114 objects. Common to all distributions is a clear peak at 0, and also a tail containing several signals at up to 3. However this tail is more pronounced for the main sample – implying that a stacking analysis may be worthwhile (see §4.2 below) – and outliers are present: the high-TS sources are visible above 4 (see §4.3 below), including the two Fermi sources shown in red; all members of the main sample. The only exception is the extended sample BCG in S 753, for which a TS of 19.9 was derived. Inspection of the field containing this object reveals a highly confused region of diffuse emission, likely associated with the Galactic background, and as such this result is not believed.
4.2 Stacking Analysis
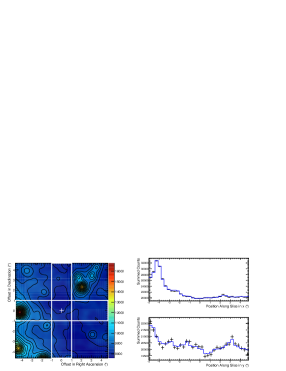
The stacked analyses of the main sample above the three energy cuts – described in §3 – are illustrated in Figure 3. In each case the left panel shows the stacked counts map in the colour scale, overlayed with contours defining the corresponding stacked model map for the null hypothesis. The maps to be summed were each centred on the candidate source position (0,0), which is marked on the final stacked plot. The right panels show one-dimensional slices through both the summed counts and model maps (the area covered by these slices is indicated by the boxes drawn on the stacked maps; their width motivated in each case by the LAT PSF as described in §3, to match the regions within which upper limits are computed: 1°, 0.4° and 0.2° for the 300 MeV, 3 GeV and 30 GeV datasets, respectively). Sources with a high individual TS (16), and those within 0.2° of a catalogue source are not included in the stack. The field containing the BCG A 3360 has also been removed, due to the proximity (within 1°) of the very bright () 2FGL source 2FGL J0538.84405. The model provides a reasonable description of the data, and there is no evidence for an excess close to the origin. Applying the method described in §3, the derived 95% upper limits on the -ray flux of an average source within the class of BCGs, given the cuts applied and within a region of size comparable with the LAT PSF, are found to be 7.4 (within a 1° radius for ), 7.1 (within a 0.4° radius for ) and 3.7 (within a 0.2° radius for ).

4.3 Sources of Note
4.3.1 2FGL Sources
The Fermi source 2FGL J0627.13528 is associated with the BCG in A 3392, which is classified as a BL Lac object. It is listed with a 24-month detection significance of 12.6, flux of and photon index of 1.93 0.09. With 21 months more data (and in an energy band ) we calculate an increased detection significance of , and a consistent (within errors) photon index, as expected.
The Fermi source 2FGL J1958.43012 is associated with the BL Lac object RXC J1958.2-3011, and may be a BCG (see § 2). It is listed with a 24-month detection significance of 5.1, flux of and photon index of 1.9 0.2. With 21 months more data (and in an energy band ) we calculate an increased detection significance of , and a consistent (within errors) photon index, as expected.
4.3.2 Offset Detections: Possible Counterparts
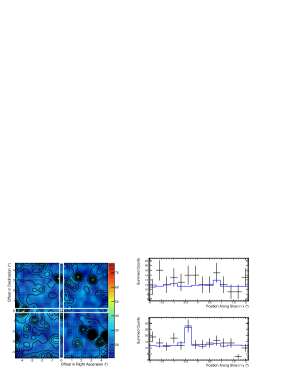
TS maps were constructed for candidate sources with TS 16, to better localise the source position. These can be seen in Figure 4 for the BCGs in MACS J1347.51145 (TS ), RXC J0132.60804 (TS ) and IC 4991 (TS ), and illustrate the effect of neglecting to add the candidate to the model: significant sources are revealed and localised where the baseline model (containing all local 2FGL sources, and the diffuse Galactic and extragalactic backgrounds, see §3) fails to describe the -ray emission. These peaks in TS were fitted with parabolic ellipsoids and the best-fit peak positions are illustrated in the figure. The contours represent the 95% confidence regions for the positions of the sources.
Adding a candidate at the position of the BCG in MACS J1347.51145 (in the energy band ) yields a photon index of 2.76 0.01 and a flux of . The significant source in the field however, is clearly offset from the BCG position (the fitted peak in TS is located at Right Ascension (RA) = 207.33°, Declination (Dec.) = °) and so unlikely to be associated. Consulting the literature reveals the Fermi-LAT detection of a GeV flare consistent (within the quoted statistical errors) with this location in November 2011 (ATel #3788), and the flat-spectrum Quasi Stellar Object (QSO) PKS 1346112 (Jackson et al., 2002), is given as a possible counterpart. Following this detection, a possible Wide-field Infrared Survey Explorer (WISE) blazar counterpart was identified, coincident with the radio source (ATel #4086). Re-running the likelihood analysis with this new source included in the model yields a negligible TS at the BCG position, and a TS of 179.6 (corresponding to a detection significance of 13.4) at the peak position, with a corresponding photon index of 2.44 0.03 and flux of . Despite the high TS value, the transient nature of the source may account for its absence from the 2FGL.
Adding a candidate at the position of the BCG in RXC J0132.60804 (in the energy band ) yields for the source a photon index of 2.20 0.02 and a flux of . There appear to be two significant sources in the field, the more central of which (the fitted TS peak is located at RA = 23.25°, Dec. = °), is 8′ from the BCG and may be associated with a member of the parent cluster. The most significant peak is fitted to a position at RA = 21.78°, Dec. = °. The BL Lac FBQS J01270821 at a redshift of 0.36 is a plausible -ray counterpart (Plotkin et al., 2008). A re-analysis of the field using a model containing these two localised sources nullifies the BCG TS, and results in a TS of 28.0 for the closer peak, and 65.0 for the remaining one, corresponding to 5.3 and 8 detections, respectively. A photon index of 2.36 0.03 and flux of is calculated for the latter, and for the former a photon index of 1.98 0.03, and a flux of .
Adding a candidate at the position of the BCG in IC 4991 (in the energy band ) yields a photon index of 2.379 0.009 and a flux of . There appear to be two potential non-2FGL sources of radiation in the field. For the first, the BCG lies just outside the 95% confidence contour (the fitted peak in TS is located at RA = 304.30°, Dec. = °). If this TS peak represents a genuine -ray source, it may be associated with the candidate, or perhaps with the ROSAT source 1RXS 201731.2411452, a BL Lac object 6′ removed (Kollatschny et al., 2008). The second TS peak (fit position: RA = 307.27°, Dec. = °) may indicate -ray emission associated with an 81 mJy SUMSS source 5′ removed, that is not clearly identified (see Mauch et al. (2003)). Remodelling the data to account for these two sources renders the candidate BCG emission insignificant (reducing the TS to 2.7), and results in a TS of 13.9 for the closer peak, and 41.1 for the peak revealed toward the edge of the field, roughly corresponding to statistical significances of 3.7 and 6.4, respectively. A photon index of 2.2 0.2 and flux of is calculated for the significant source.
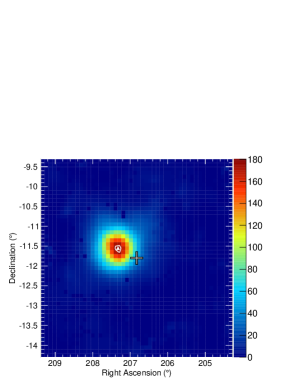
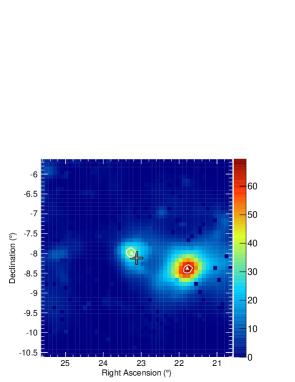
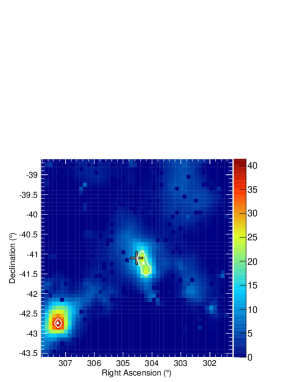
Table 2 summarises the detections confirmed after a remodelling to account for sources of -ray emission in the three fields described above was carried out. The TS maps were re-calculated based on the new output models, which were found to describe the emission adequately.
| Name | TS∗ | RA† (°) | Dec‡ (°) | Error (°) |
|---|---|---|---|---|
| FERMI J13501140†† | 179.8 | 207.33 | 11.55 | 0.11 |
| FGL J0133.00758 | 28.2 | 23.25 | 7.98 | 0.16 |
| FGL J0127.10822 | 64.8 | 21.78 | 8.37 | 0.14 |
| FGL J2029.04243 | 41.3 | 307.27 | 42.72 | 0.22 |
∗ Test Statistic
† Right Ascension
‡ Declination
†† Detected by the Fermi Large Area Telescope Collaboration in November 2011 (ATel #3788)
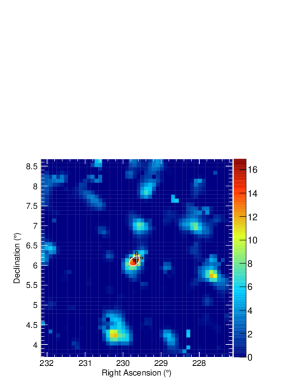
4.3.3 -ray Emission from A 2055?
Using the data, analysis of the BCG in A 2055 (which is classified as a BL Lac object) results in a TS of 15.2. The corresponding TS map is shown in Figure 5. A hint of emission from the position of the BCG can be clearly seen. The position of the BCG is contained within the 95% confidence region for the source location. With this candidate alone added, the model sufficiently describes the -ray emission within the field. The source is not detected in the energy band , and the TS drops to 8.0 using the larger dataset.
5 Discussion
There is no statistically significant evidence for emission within the stacked sample. The upper limits derived on an average source within the class of BCGs represent at least an order of magnitude improvement on the individual upper limits presented in Table LABEL:tab:sample. The derived limits are consistent with the expectation of a scaling for the background-limited lower energy bands and for highest energies where the Fermi-LAT becomes signal limited even in the stacked sample, where is the number of fields stacked.
To derive a limit on the -ray to radio flux ratio () for the core emission of the sample we consider the core radio flux (some fraction of the emission given in Table LABEL:tab:sample) of each BCG (Hogan et al., prep), and find an average radio flux of and an average luminosity of (at an average redshift of 0.13). Given the upper limit on the stacked emission, the average -ray flux evaluated at 1 GeV and assuming a photon index of 2, is less than , and the average -ray luminosity is less than . The average of the sample is therefore 15. The -ray flux-limit for the sample corresponds to only 0.1% of the flux of NGC 1275, which has 120 ( excluding -ray flares). The average core radio flux is 1% of that of NGC 1275. The lack of a -ray signal in the stack therefore implies that the average core-radio selected BCGs have spectral energy distributions with a different shape to that of NGC 1275, with significantly lower -ray flux relative to core radio flux, though the current highly variable state of -ray emission in this active galaxy (Kataoka et al., 2010) may account for the difference in .
NGC 1275 and M 87 are the closest cooling-core BCGs, so the detected -ray emission is unlikely to be beamed toward us if they are drawn from a random distribution of sight lines. However, a role for beaming in NGC 1275 cannot be excluded and may play a role in its unusual -ray brightness (see above). It has been postulated (see Falceto-Gonçalves et al. (2010)) that the central AGN comprises a viscous accretion disk tilted with respect to the rotating super-massive black hole, bringing about precessing jets as a result of torques acting on the disk. Very Long Baseline Interferometry (VLBI) maps of the radio source can place constraints on the inclination of the system: to be satisfied, some curvature of the jet away from the line of sight is implied (Dunn et al., 2006). This said, for those BCGs with bona fide BL Lac nuclei, for example A 2055 and A 3392, which are significantly more distant and comparable to most of the parent sample, the probability of observing a few sources close to the jet direction is significant.
We can assess the number of local clusters hosting a Fermi-LAT AGN by cross-correlating the Abell cluster catalogue of 5250 clusters (including the supplementary systems) (Abell et al., 1989), with the 2FGL. Of the 85 coincidences within 20′, only 11 are consistent with the 2FGL source being a cluster member and of those only four being the BCG (NGC 1275 in A 426/Perseus, PKS 062535 in A 3392, PKS 2035714 in A 3701 and PKS 2316423 in S1111). The latter two clusters are not detected above the X-ray flux limit for the eBCS or REFLEX catalogues, so were not considered in the analysis above. Therefore, the chance of finding a Fermi source in any particular cluster is relatively small but is significant.
The added complication with the analysis is that the Fermi-LAT spatial resolution and source density (0.05 per square degree) implies chance coincidences on the order of a few when more than 100 positions are considered. This is illustrated in Figure 4, given that the TS output from the initial binned likelihood analysis of the field was in each case not exclusively associated with the BCG under scrutiny, but a nearby source of emission not described by the model. The angular resolution of the Fermi-LAT is sufficient (particularly above 1 GeV) to isolate nearby background sources from the position of interest in most cases, but the likelihood analysis is not robust enough to accurately disentangle the emissions in such an event.
Four detections (that is, of TS25 emission) have been made of sources not contained in the 2FGL (see Table 2). For those above a TS of 50, their absence from the 2FGL implies temporal variability in the emission, as appears to be the case for the source FERMI J13501140. A more detailed study of these sources is left to future work. The tentative evidence for emission from the BCG in A 2055 will be refuted or validated in time: if the significance of emission from the source position continues to increase, it will be the fourth such source to be detected using Fermi; the second BCG hosting a BL Lac.
6 Concluding Remarks
The Fermi-LAT detection of a few sources in clusters of galaxies sets important limits on the energetics and emission mechanisms at work in the cores of the most massive member galaxies. The detections of BCGs using Fermi are strongly biased toward the most radio bright systems or those that are dominated by a beamed core. Our statistical upper limit from a larger sample of sources with lower radio flux indicates that the average core-radio selected BCG is more than an order of magnitude less -ray luminous than, for example, NGC 1275. Furthermore the ratio of -ray to radio flux is 15, compared with 120 for NGC 1275. The BCG in A 2055, which hosts a BL Lac, may soon be detectable in HE rays (given a longer exposure using Fermi ), and if so, will corroborate this conclusion.
Detections of a number of new sources are declared; though none of these appear to be unambiguously associated with the BCG, the slightly-offset emission in the field of RXC J0132.60804 might be associated with the candidate, or else another cluster member galaxy, and in the field of IC 4991 may (if genuine) in part originate from the BCG. This work also illustrates then, the need to carefully assess all the possible sources of emission that could explain the Fermi-LAT detections found in clusters before attributing them to (for example) cluster merger-related shocks or DM annihilation.
Acknowledgments
The authors would like to thank Stefan Ohm for useful comments and discussions. This work has made use of public Fermi data and Science Tools provided by the Fermi Science Support Centre. K. L. Dutson and R. J. White acknowledge support from the STFC and J. A. Hinton from the Leverhulme Trust.
References
- Abdo et al. (2009a) Abdo A. A., et al., 2009a, ApJ, 699, 31
- Abdo et al. (2009b) Abdo A. A., et al., 2009b, Phys. Rev. D, 80, 122004
- Abell et al. (1989) Abell G. O., Corwin Jr. H. G., Olowin R. P., 1989, ApJS, 70, 1
- Abramowski et al. (2012) Abramowski A., et al., 2012, ApJ, 746, 151
- Ackermann et al. (2010a) Ackermann M., et al., 2010a, J. Cosmol. Astropart. Phys, 5, 25
- Ackermann et al. (2010b) Ackermann M., et al., 2010b, ApJl, 717, L71
- Aharonian et al. (2006) Aharonian F., et al., 2006, Science, 314, 1424
- Aharonian (2002) Aharonian F. A., 2002, MNRAS, 332, 215
- Aleksić et al. (2012) Aleksić J., et al., 2012, A&A, 539, L2
- Antonucci (1993) Antonucci R., 1993, Annu. Rev. Astron. Astrophys., 31, 473
- Asada et al. (2006) Asada K., Kameno S., Shen Z.-Q., Horiuchi S., Gabuzda D. C., Inoue M., 2006, PASJ, 58, 261
- Atwood et al. (2009) Atwood W. B., et al., 2009, ApJ, 697, 1071
- Benson et al. (2003) Benson A. J., Bower R. G., Frenk C. S., Lacey C. G., Baugh C. M., Cole S., 2003, ApJ, 599, 38
- Biretta et al. (1991) Biretta J. A., Stern C. P., Harris D. E., 1991, ApJ, 101, 1632
- Blasi & Colafrancesco (1999) Blasi P., Colafrancesco S., 1999, Nucl. Phys. B Proceedings Supplements, 70, 495
- Blasi et al. (2008) Blasi P., Gabici S., Brunetti G., 2008, IJMPA, 22, 681
- Böhringer et al. (2004) Böhringer H., Schuecker P., Guzzo L., Collins C. A., Voges W., Cruddace R. G., Ortiz-Gil A., Chincarini G., De Grandi S., Edge A. C., MacGillivray H. T., Neumann D. M., Schindler S., Shaver P., 2004, A&A, 425, 367
- Bower et al. (2006) Bower R. G., Benson A. J., Malbon R., Helly J. C., Frenk C. S., Baugh C. M., Cole S., Lacey C. G., 2006, MNRAS, 370, 645
- Brown & Adams (2011) Brown M., Adams J., 2011, MNRAS, 000, 1
- Burns (1990) Burns J. O., 1990, AJ, 99, 14
- Cavagnolo et al. (2008) Cavagnolo K. W., Donahue M., Voit G. M., Sun M., 2008, ApJl, 683, L107
- Clarke et al. (2005) Clarke T. E., Sarazin C. L., Blanton E. L., Neumann D. M., Kassim N. E., 2005, ApJ, 625, 748
- Condon et al. (1998) Condon J. J., Cotton W. D., Greisen E. W., Yin Q. F., Perley R. A., Taylor G. B., Broderick J. J., 1998, AJ, 115, 1693
- Dunn et al. (2006) Dunn R. J. H., Fabian A. C., Sanders J. S., 2006, MNRAS, 366, 758
- Ebeling et al. (2000) Ebeling H., Edge A. C., Allen S. W., Crawford C. S., Fabian A. C., Huchra J. P., 2000, MNRAS, 000, 000
- Ebeling et al. (1998) Ebeling H., Edge A. C., Böhringer H., Allen S. W., Crawford C. S., Fabian A. C., Voges W., Huchra J. P., 1998, MNRAS, 301, 881
- Ebeling et al. (2001) Ebeling H., Edge A. C., Henry J. P., 2001, ApJ, 553, 668
- Edge et al. (1990) Edge A. C., Stewart G. C., Fabian A. C., Arnaud K. A., 1990, MNRAS, 245, 559
- Fabian (1994) Fabian A. C., 1994, Annu. Rev. Astron. Astrophys., 32, 277
- Fabian et al. (2002) Fabian A. C., Allen S. W., Crawford C. S., Johnstone R. M., Morris R. G., Sanders J. S., Schmidt R. W., 2002, MNRAS, 332, L50
- Fabian et al. (2000) Fabian A. C., Sanders J. S., Ettori S., Taylor G. B., Allen S. W., Crawford C. S., Iwasawa K., Johnstone R. M., Ogle P. M., 2000, MNRAS, 318, L65
- Falceto-Gonçalves et al. (2010) Falceto-Gonçalves D., de Gouveia Dal Pino E. M., Gallagher J. S., Lazarian A., 2010, ApJ, 708, L57
- Hinton et al. (2007) Hinton J. A., Domainko W., Pope E. C. D., 2007, MNRAS, 382, 466
- Hlavacek-Larrondo et al. (2011) Hlavacek-Larrondo J., Fabian A. C., Sanders J. S., Taylor G. B., 2011, MNRAS, 415, 3520
- Hogan et al. (prep) Hogan M. T., et al., in prep
- Huber et al. (2012) Huber B., Farnier C., Manalaysay A., Straumann U., Walter R., 2012, ArXiv e-prints
- Jackson et al. (2002) Jackson C. A., Wall J. V., Shaver P. A., Kellermann K. I., Hook I. M., Hawkins M. R. S., 2002, A&A, 386, 97
- Kataoka et al. (2010) Kataoka J., et al., 2010, ApJ, 715, 554
- Kollatschny et al. (2008) Kollatschny W., Kotulla R., Pietsch W., Bischoff K., Zetzl M., 2008, A&A, 484, 897
- Mattox et al. (1996) Mattox J. R., et al., 1996, ApJ, 461, 396
- Mauch et al. (2003) Mauch T., Murphy T., Buttery H. J., Curran J., Hunstead R. W., Piestrzynski B., Robertson J. G., Sadler E. M., 2003, MNRAS, 342, 1117
- McNamara & Nulsen (2007) McNamara B. R., Nulsen P. E. J., 2007, Annu. Rev. Astron. Astrophys., 45, 117
- McNamara et al. (2000) McNamara B. R., Wise M., Nulsen P. E. J., David L. P., Sarazin C. L., Bautz M., Markevitch M., Vikhlinin A., Forman W. R., Jones C., Harris D. E., 2000, ApJ, 534, L135
- Mittal et al. (2009) Mittal R., Hudson D. S., Reiprich T. H., Clarke T., 2009, A&A, 501, 835
- Nolan et al. (2012) Nolan P. L., et al., 2012, ApJS, 199, 31
- Paggi et al. (2012) Paggi A., Massaro F., D’Abrusco R., 2012, The Astronomer’s Telegram, 4086, 1
- Peterson et al. (2003) Peterson J. R., Kahn S. M., Paerels F. B. S., Kaastra J. S., Tamura T., Bleeker J. A. M., Ferrigno C., Jernigan J. G., 2003, ApJ, 590, 207
- Pfrommer & Enßlin (2004) Pfrommer C., Enßlin T. A., 2004, A&A, 413, 17
- Plotkin et al. (2008) Plotkin R. M., Anderson S. F., Hall P. B., Margon B., Voges W., Schneider D. P., Stinson G., York D. G., 2008, ApJ, 135, 2453
- Rolke et al. (2005) Rolke W. A., López A. M., Conrad J., 2005, Nuclear Instruments and Methods in Physics Research A, 551, 493
- Russell et al. (2010) Russell H. R., Fabian A. C., Sanders J. S., Johnstone R. M., Blundell K. M., Brandt W. N., Crawford C. S., 2010, MNRAS, 402, 1561
- Sijacki et al. (2007) Sijacki D., Springel V., Di Matteo T., Hernquist L., 2007, MNRAS, 380, 877
- Sparks et al. (1996) Sparks W. B., Biretta J. A., Macchetto F., 1996, ApJ, 473, 254
- Torresi & D’Ammando (2011) Torresi E., D’Ammando F., 2011, The Astronomer’s Telegram, 3788, 1
- Vermeulen et al. (1994) Vermeulen R. C., Readhead A. C. S., Backer D. C., 1994, ApJ, 430, 41
- Völk & Atoyan (1999) Völk H. J., Atoyan A. M., 1999, Astropart. Phys., 11, 73
- Wise et al. (2007) Wise M. W., McNamara B. R., Nulsen P. E. J., Houck J. C., David L. P., 2007, ApJ, 659, 1153