Study of the near-threshold mass enhancement in doubly OZI suppressed decays
Abstract
A 2.25108 event sample accumulated with the BESIII detector is used to study the doubly OZI suppressed decay modes , , . A strong deviation ( 30) from three-body phase space is observed near the mass threshold that is consistent with a previous observation reported by the BESII experiment. A partial wave analysis with a tensor covariant amplitude that assumes that the enhancement is due to the presence of a resonance, the , is performed, and confirms that the spin-parity of the is . The mass and width of the are determined to be (stat)(syst)19(mod) MeV/ and (stat)(syst)75(mod) MeV/, respectively, and the product branching fraction is measured to be (stat)(syst)1.30(mod)). These results are consistent within errors with those of the BESII experiment.
pacs:
14.40.Lb, 14.40.Be, 13.25.GvI Introduction
An anomalous near-threshold enhancement in the invariant-mass spectrum in the process was reported by the BESII experiment Ablikim:2006 . A partial wave analysis (PWA) that used a helicity covariant amplitude that assumed that the enhancement was produced by a resonance, denoted as the , was performed on the BESII event sample. The analysis indicated that the quantum number assignment favored over or with a significance of more than 10. The mass and width were determined to be (stat)(syst) MeV/ and (stat)(syst) MeV/, respectively, and the product branching fraction ( ) () =(stat)(syst)] was measured. The decay mode is a doubly OZI suppressed process with a production rate that is expected to be suppressed relative to or by at least one order of magnitude oneorder . Possible interpretations of the threshold enhancement include a new type of resonance, such as a tetraquark state (with structure ) Bing-An:2006 , a hybrid Kung-Ta:2006 , or a glueball state Bicudo:2007 etc., a dynamical effect arising from intermediate meson rescattering Qiang:2006 , or a threshold cusp of an attracting resonance D.V.:2006 . As of now none of these interpretations has either been established or ruled out by experiment.
A search for the was performed by the Belle collaboration in the decay of belle , but no obvious signal was observed. A high statistics data sample collected with the BESIII detector provides a good opportunity to confirm the existence of the threshold enhancement, study its properties and search for other possible related states that decay to .
In this paper we present a PWA that uses a tensor covariant amplitude for the process, where the is reconstructed from and the from . The analysis is based on a sample of events jpsinumber accumulated with the new Beijing Spectrometer (BESIII) bes3 located at the Beijing Electron-Positron Collider (BEPCII) bepc2 .
II Detector setup and Monte Carlo simulation
BEPCII is a double-ring collider designed to provide a peak luminosity of cm with beam currents of A. The BESIII detector has a geometrical acceptance of of and has four main components: (1) A small-cell, helium-based ( He, C3H8) main drift chamber (MDC) with layers providing an average single-hit resolution of m, charged-particle momentum resolution in a T magnetic field of at 1 GeV, and a resolution better than . (2) An electromagnetic calorimeter (EMC) consisting of CsI(Tl) crystals in a cylindrical structure (barrel) and two endcaps. The energy resolution for GeV -rays is () in the barrel (endcaps), and the position resolution is mm ( mm) in the barrel (endcaps). (3) A time-of-flight system (TOF) constructed of cm thick plastic scintillators, with detectors of m length in two layers in the barrel and fan-shaped detectors in the endcaps. The barrel (endcap) time resolution of ps ( ps) provides separation for momenta up to GeV. (4) The muon system (MUC) consists of m2 of Resistive Plate Chambers (RPCs) in nine barrel and eight endcap layers and provides cm position resolution.
In this analysis, a GEANT4-based geant4 Monte Carlo (MC) simulation software package, BOOST boost , is used. It provides an event generator, contains the detector geometry description, and simulates the detector response and signal digitization. The production of the resonance is simulated by the Monte Carlo event generator KKMC kkmc1 ; kkmc2 , while the decays are generated by BesEvtGen besevtgen1 ; besevtgen2 for known decay modes with branching ratios set at the PDG PDG world average values, and by the Lund-Charm model lundcharm for the remaining unknown decays. The analysis is performed in the framework of the BESIII Offline Software System (BOSS), which takes care of the detector calibration, event reconstruction, and data storage.
III Event selection
Signal events with and final states have the topology . The event candidates are required to have four well reconstructed charged tracks with net charge zero, and at least three photons.
Charged-particle tracks in the polar angle range are reconstructed from the MDC hits. Only the tracks with points of closest approach to the beamline that are within 10 cm of the interaction point in the beam direction, and within 1 cm in the plane perpendicular to the beam are selected. TOF and information are combined to form particle identification confidence levels for , and hypotheses. Kaons are identified by requiring the particle identification probability () to be and . Two identified kaons with opposite charges are required.
Photon candidates are reconstructed by clustering signals in EMC crystals. The energy deposited in the nearby TOF counters is included to improve the photon reconstruction efficiency and its energy resolution. The photon candidates are required to be in the barrel region () of the EMC with at least 25 MeV total energy deposition, or in the endcap regions () with at least 50 MeV total energy deposition, where is the polar angle of the shower. The photon candidates are furthermore required to be isolated from all charged tracks by an angle 10∘ to suppress showers generated by charged particles. The showers in the region between the barrel and the endcaps of the EMC are poorly measured and excluded. Timing information from the EMC is used to suppress electronic noise and energy deposits that are unrelated to the event. Events with at least three good photon candidates are selected.
A four-constraint (4C) energy-momentum conserving kinematic fit is performed to the 3 hypothesis. For events with more than three photon candidates, the candidate combination with the minimum is selected, and it is required that (the requirement is determined by optimizing /, where is the number of MC signal events generated with phase space, and is the number of signal plus background candidate events in the data). In order to remove background stemming from 2 and 4, we performed 4C kinematic fits for the hypotheses of 2 and 4 (for the events that have at least four good photon candidates). We require and , respectively. The candidates are reconstructed from the two of the three selected photons with invariant mass closest to the mass, and MeV/ is required.
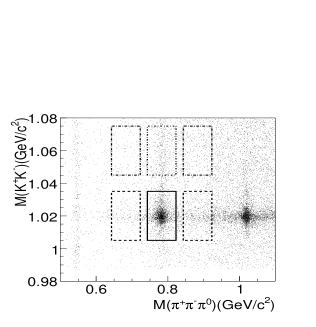
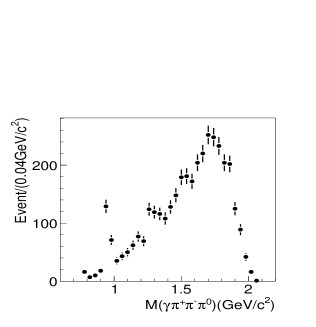
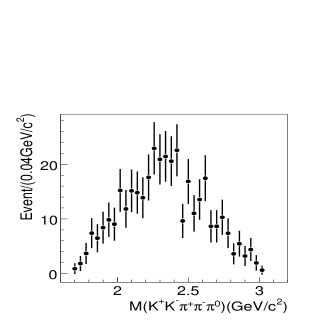
A scatter plot of the versus invariant masses for events that survive the above selection criteria is shown in Fig. 1(a). One cluster of events populates the region, which arises from the well known process (one , the other ), and another cluster of events shows up in the signal region. Since the decays of and are forbidden by parity conservation, the observed events in the region are an unambiguous signal for the radiative decay process . The mass window requirements (I) 40MeV/ (the requirement is determined by optimizing /) and (II) MeV/ (the requirement is determined by optimizing /) are defined for the and signal region, respectively, while the requirements of (III) 60MeV/MeV/ and (IV) 1045MeV/ MeV/ are defined for the and sideband regions, respectively. Figure 1(b) shows the invariant-mass distribution for events in which the invariant-mass lies within the signal range (requirement I); here a signal can clearly be seen. The shaded histogram in Fig. 1(b) shows the corresponding distribution for events within the sideband region (requirement III). A small signal from the background is evident. Figure 1(c) shows the invariant-mass distribution for events with invariant-mass within the signal range (requirement II). As expected, and signals are clearly seen. A small signal is also observed; this comes from the decay chain (). The shaded histogram in Fig. 1(c) shows the corresponding distribution for the events within the sideband region (requirement IV). For events that survive the and requirements on the and invariant mass (requirements I and II), respectively, the invariant-mass distribution is shown in Fig. 2(a). Here an peak is observed; this comes from the decay chain (, , ). To characterize these events, a large MC sample of is generated with a flat angular distribution. These have a invariant mass distribution that is concentrated at masses higher than 2.5GeV/ and have no impact on the mass threshold region of interest. A further requirement )1.0GeV/ (requirement V) is imposed to remove background from . Figure 2(b) shows the invariant mass of for events with requirements I, II and V applied, where a peaking structure near the invariant-mass threshold is observed. The solid histogram in the figure shows the invariant-mass distribution without requirement V. The invariant mass distribution is very different from a pure phase-space distribution from MC (dashed histogram, arbitrarily scaled). The threshold structure shows up as a diagonal band along the upper right-hand edge of the Dalitz plot in Fig. 2(c).
The observed mass-threshold enhancement is similar to that observed by the BESII experiment Ablikim:2006 . To ensure that the enhancement is not due to some background process, detailed studies of potential background sources have been performed using both data and MC. Non- and non- backgrounds are studied using and sideband data. Figure 3(a) and 3(b) show the invariant mass for events in the sideband region (labeled as Box A in Fig. 1(a)) and the sideband region (labeled as Box B in Fig. 1(a)); these are used to determine the non- and non- background contamination in the signal regions. Figure 3(c) shows the same distribution for events in the corner region (labeled as Box C in Fig. 1(a)), for which both the and the invariant masses are in the and sidebands; these are used to estimate the non- non- background. The background contamination in the signal region is estimated to be the sum of the Fig. 3(a) and Fig. 3(b) sideband distributions with the Fig. 3(c) distribution subtracted to account for double counting of non- non- background in Fig. 3(a) and Fig. 3(b). Phase-space-MC-determined normalization factors are applied that account for differences in the sizes of the selected regions and the difference in the available phase space in the signal and sideband regions. The background contamination in the signal region determined in this way is shown as a solid histogram in Fig. 3(d). The shape of the estimated background is very different from that of data in the signal region, and no evidence of an enhancement near the mass threshold is observed from the non- and non- background events in the data.
An inclusive MC sample of 225M events generated according to the Lund-Charm model lundcharm and the PDG decay tables is also used to study the potential backgrounds. The dashed histogram in Fig. 3(d) shows the invariant-mass distribution for the selected inclusive MC events, where no peaking background at the invariant-mass threshold is observed. Exclusive background MC samples of decays that have similar final states are generated to further investigate possible background sources. The main backgrounds come from and events. For these, the invariant mass distribution peaks at high masses, and none of them channels produce peaking structures at the mass threshold.
IV Partial Wave Analysis
A PWA was performed on the selected candidate events to study the properties of the mass threshold enhancement. In the PWA, we assume the enhancement is due to the presence of a resonance, denoted as , and the decay processes are described with sequential 2-body or 3-body decays: , and . The amplitudes of the 2-body or 3-body decays are constructed with a covariant tensor amplitude method tensor . The intermediate structure is parameterized with the Breit-Wigner propagator
| (1) |
with constant width, where is the invariant mass-squared, and & are the resonance mass and width, respectively. The amplitude for the sequential decay process is the product of all decay amplitudes together with the Breit-Wigner propagator. The total differential cross section for the process is the square of the linear sum of all possible partial wave amplitudes:
| (2) |
where is the total amplitude for all possible resonances with given .
The relative magnitudes and phases of the states are determined by an unbinned maximum likelihood fit of the measured cross section . The basis of likelihood fitting is the calculation of the probability that a hypothesized probability distribution function can produce the data set under consideration. The probability to observe the event characterized by the measurement is the differential cross section normalized to unity:
| (3) |
where and is the detection efficiency. The joint probability density for observing the events in the data sample is:
| (4) |
FUMILI FUMILI is used to optimize the fit parameters in order to achieve the maximum likelihood value. Technically, rather than maximizing , = -ln is minimized, i.e.,
| (5) |
In practice, the normalized integral is evaluated using the phase space MC sample. For a given data set, the second term is a constant and has no impact on the relative changes of the value. The details of the PWA fit process are described in Ref. goodness . In the minimization procedure, a change in log likelihood of 0.5 represents a one standard deviation effect for the one-parameter case and is used to evaluate statistical errors.
Conservation of , in the process in the case of a pseudoscalar intermediate resonance , allows only wave contributions in both the radiative decay and the hadronic decay . For the production of a , or resonance, both and waves are possible for both the radiative and hadronic decays, but only the wave contribution is considered in the fit, since the wave can be expected to be highly suppressed near the mass threshold. Intermediate structures with or higher spin are not considered in the analysis. To investigate the of the , we tried different assignments in the fit, and the assignment with the best log likelihood value is identified as the of the . Some known mesons, e.g. (1950) or , with a mass above the invariant-mass threshold, are expected to decay to final states. All possible mesons listed in the PDG tables are included in the fit. To consider the contribution from phase space, without an intermediate state is also included in the fit with an amplitude modeled by the same sequential process and a very broad intermediate state, i.e., = 2500MeV and = 5000MeV. In the PWA fit, the phase space is assigned to a given , which is determined by the optimization of the likelihood fit. The background event contribution to the log likelihood value is estimated from the weighted events in the sideband region, and subtracted in the fit.
In the PWA fit, different combinations of the structure and the phase-space contribution, as well as different combinations of additional mesons listed in the PDG tables, are tried. The mass and width of the are determined by a scan of the maximum log likelihood value, while the mass and width of the additional mesons are fixed with their PDG values. The statistical significance of the state is determined by the changes of the maximum log likelihood value and of the number of degrees of freedom () in the PWA fits with or without the state included. Only states with statistical significance larger than 5 are included in the best solution.
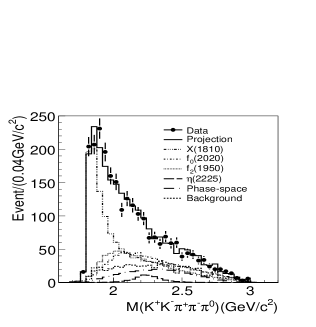
Finally, together with the contributions of the and phase-space, additional 0++, 2++, and 0-+ components are found () in the best solution of the PWA fit. In the following, the masses and widths of the 0++, 2++ and 0-+ components are assigned to be those of (2020), (1950) and (2225), respectively, since the fit with these has the best log likelihood value. Various PWA fits with different 0++, 2++ and 0-+ components were also performed. The results for the are robust, while the fit is not very sensitive to the masses and widths of the 0++, 2++ and 0-+ components. The log likelihood values changes are rather small when the (2020), (1950) and (2225) are replaced by other resonances with the same and similar masses. The details are shown below. The assignment for the has by far the highest log likelihood value among the different hypotheses. The minus log likelihood value () for a assignment to the is 227 below that of the second lowest value (obtained for a assignment), and is 783 below that for a fit with the omitted. The latter corresponds to a statistical significance of more than 30. Different assignments for the phase space contribution are tested in the PWA fit and = 0-+ is favored. The assigned values for the , mass, width and number of events for the five components for the best fit solution are summarized in Table 1. The mass and width of the are obtained to be ) MeV/ and ) MeV/, respectively, where the errors are statistical only. The contributions of each component of the best solution of the PWA fit are shown in Fig. 4(a). The changes of the log likelihood value and of the number of degrees of freedom that occur when a state is dropped from the PWA fit, as well as the corresponding statistical significance, are also listed in Table 1. The statistical significance of the (1950), (2020) and (2225) contributions are , and 6.4, respectively. The reconstruction and final-selection efficiency of the is determined from a weighted phase space MC sample of , where the weight is the differential cross section for the measured events calculated with the magnitudes and phases of the partial amplitudes from the best solution of the PWA fit. The efficiency is determined to be 6.8% and the corresponding branching fraction is , where the error is statistical only.
| Resonance | JPC | M(MeV) | (MeV) | Events | Significance | ||
| 0++ | 783 | 4 | |||||
| f2(1950) | 2++ | 1944 | 472 | 211 | 2 | 20.4 | |
| f0(2020) | 0++ | 1992 | 442 | 100 | 2 | 13.9 | |
| 0-+ | 2226 | 185 | 23 | 2 | |||
| phase space | 0-+ | — | — | 45 | 2 | 9.1 |
The invariant-mass spectra (), (), () and the cos, cos, cos, cos, , and angular distributions of the data and the PWA fit projections with the best solution as well as the different components are shown in Fig. 4. Here the angles , , and are the polar angles of the radiative photon in the rest frame, the normal to the decay plane in the system, meson momentum direction in the rest system, and the kaon from decay in the rest system, respectively; is the azimuthal angle of the meson in the system and is the angle between azimuthal angles of the normal to the decay plane and the momentum of a kaon from decay in the system. The PWA fit projection is the sum of the signal events with the best solution and the background estimated from the weighted events in the sideband region.
To determine the goodness of fit, a is calculated by comparing the data and fit projection histograms, where is defined as goodness
| (6) |
and and are the number of events for the data and the fit projections with best solution in the bin of each figure, respectively. The and the number of degrees of freedom () for each mass and angular distribution are shown in Table 2, where the number of bins is taken as the number of degrees of freedom. The values of range between 0.62 and 1.70, indicating reasonable agreement between data and the fit.
| Variable | M() | M() | M() | ||||||
| 44.4 | 36.4 | 42.4 | 24.2 | 12.4 | 28.2 | 18.2 | 26.4 | 51.0 | |
| 40 | 35 | 40 | 20 | 20 | 20 | 20 | 20 | 30 | |
| / | 1.11 | 1.04 | 1.06 | 1.21 | 0.62 | 1.41 | 0.91 | 1.32 | 1.70 |
Additional fits with different assumptions have been carried out to check the influence on the parameters of the . The masses and widths for the (1950), (2020) and are difficult to determine accurately from this analysis and the achieved accuracy can not compete with the PDG accuracy because of the dominant component; instead they are fixed to their PDG values in the fits. If we change the masses and widths of these three mesons by one standard deviation in the fitting, the log likelihood value changes by 3 after refitting mass and width of the ; these values and the branching fraction remain consistent within the statistical errors. The maximum difference is taken as a systematic error. An alternative method to test the influence of the parameters of the three known mesons is to replace the mesons by states listed in the PDG tables with the same and similar mass. When the parameters of (1950) are replaced with those of the (1910), the log likelihood value increases by = 6 after refitting the mass and width of the . When the parameters of (2020) are replaced with those of the (2100), the log likelihood value increases by = 13. If the (2020) is replaced with 0++ phase space, the log likelihood value increases by = 9. If the (1950) is replaced with (1910) and the (2020) is replaced with a 0++ phase space, the log likelihood value increases by = 10 after refitting. By comparing the log likelihood values, the combination of , (1950), (2020), (2225) and = 0-+ for the phase-space contribution is found to be the best solution, and the mass, width and branching fraction of changes are less than twice the statistical errors.
The states listed in the PDG tables with mass above the threshold that are consistent with decaying into under spin-parity constraints, are the (1910), (2010), (2100), (2150), (2200), (2300) and (2340), etc. Relative to the best solution of the PWA fit, as these resonances are added in the fit, the log likelihood value improves by 11.7, 8.1, 1.5, 3.2, 1.7, 2.5 and 0.9 after refitting the mass and width of the , and the statistical significance of these additional resonances are all less than 5, while the mass, width, and branching fraction of are consistent with those from the best solution within statistical errors. The maximum difference between the best fit result and the result with extra states included is taken as a systematic error. In the best fit solution, phase space is included and approximated as a broad resonance. An additional phase-space distribution amplitude with different was added to test whether the data contain different phase-space contributions. When the fit is redone including additional phase-space contributions with , , , the log likelihood value improves by 0.1, 3.8 and 3.7, respectively. No evidence of phase space contributions with different values is found, while the mass, width, and branching fraction are consistent with best solution within statistical errors. The maximum differences are taken as systematic errors. The BESIII collaboration has observed two new pseudoscalar resonances, in the decay process x1835 and the in the decay process xppbar . It is interesting to know whether either of these has a decay mode. Based on the best solution of the PWA fit, new pseudoscalar states with 1836.5MeV/, 190.1MeV/ and 1832MeV/, 76MeV/ are added in the fit, respectively. The log likelihood value improves by 2.2 and 3.5, and corresponding statistical significance is 1.1 and 1.6, respectively.
Based on the best solution, a more general test is carried out to investigate the possible contribution from additional resonances not listed by the PDG. Additional resonances with specified and width are included (one at a time) in the fit, with a mass that ranges from low to high values. The scans are repeated with different widths and values. We find that any additional state contribution has a statistical significance that is less than 5, and the mass, width and branching fraction of the found in this way are consistent with the best solution. This method is used to test whether a new resonance/state can be included in the data and no evidence for a new extra resonance is observed. The differences in the parameters due to the possible presence of an additional resonance are not considered in the systematic error determination.
V Systematic uncertainty study
For studies of the systematic uncertainties on the PWA-determined mass, width and branching fraction values for the , in addition to those discussed above, the effect of different background determination has also been studied. To estimate the systematic uncertainty associated with the background determination, the sideband regions (requirements III and IV) are shifted away from the signal region by 40MeV/ and 15MeV/ in the and invariant masses, respectively, the side-band normalization factors are re-evaluated, and the PWA fit is redone using the same procedure. The differences from the best solution are taken as systematic errors.
For the systematic errors on the branching fraction measurement, there are additional uncertainties from tracking efficiency, particle identification, photon detection, kinematic fit, as well as the branching fraction of the intermediate states and the total number of events.
| Source | Mass(MeV) | Width(MeV) | B.R.(%) |
| Tracking efficiency | — | — | 8.0 |
| Particle Identification | — | — | 2.0 |
| Photon detection | — | — | 3.0 |
| Kinematic fit | — | — | 7.0 |
| Intermediate branching ratio | — | — | 1.3 |
| total number | — | — | 1.2 |
| Components in the best fit | +2.0 | +12.8 | +19.1 |
| -5.1 | -6.7 | -26.1 | |
| Resonance parameterization | +12.2 | +17.3 | +1.6 |
| -1.0 | -33.0 | -40.8 | |
| Background estimation | +3.0 | -1.0 | -1.4 |
| Total | +12.8 | +21.4 | +22.3 |
| -5.2 | -33.7 | -49.8 |
The systematic uncertainty associated with the tracking efficiency has been studied with and , control samples trkpidpho . The difference between data and MC is 2% per charged pion and kaon track. Here, 8% is taken as the systematic error for the detection efficiency of charged tracks.
The uncertainty due to the kaon particle identification is determined from studies of a control sample trkpidpho . The difference in the particle identification efficiency between data and MC is 1% per kaon. Here, 2% is taken as systematic error for the identification of two kaons.
The uncertainty due to photon detection efficiency is 1% per photon, which is determined from a control sample trkpidpho . Here, 3% is taken as systematic error for the efficiency of the three photon detection.
To estimate the uncertainty associated with kinematic fit, selected samples of , and , events are used to study efficiency differences between data and MC. Compared to the final states of the studied channel, the two control samples have exactly the same charged tracks but one more or one less photon. The efficiency differences between data and MC are 4.2% and 7.0% for the two samples, respectively. Conservatively, 7.0% is taken as the systematic error associated with the kinematic fit.
For the branching fractions of , , and decays, the uncertainty on these branching fractions listed in the PDG tables PDG are taken as a systematic uncertainty for our measurement. The total number of events is , determined from inclusive hadron decays jpsinumber , with an uncertainty of 1.2%.
A summary of all the uncertainties is shown in Table 3. The total systematic uncertainty is obtained by summing up all uncertainty contributions in quadrature. The systematic uncertainties on the mass and width of the are MeV/ and MeV/, respectively, and the relative systematic error on the product branching fraction is %.
In the best PWA fit, the threshold enhancement is parameterized by a Breit-Wigner formula with a constant width. Since the enhancement structure is near the threshold, other decay modes of are expected. To account for this, the Flatté formula flatte is used to parameterize the structure . We assume the mainly decays to and final states, and gωϕ and gKK are the coupling constants to the two modes, respectively. We test two cases, one with gωϕ = 1 , gKK = 0 and the other with gωϕ = 0.5, gKK = 0.5, the mass and width of the shift by 19 MeV/c2 and 75 MeV/c2, respectively, and while the relative change in the product branching ratio is 65.1%. These are considered as a second systematic error due to uncertainty of the model dependence.
VI Summary and Discussion
We use (225.32.8)106 events accumulated with the BESIII detector to study the doubly OZI suppressed decays of , , . A strong deviation from three-body phase space for near the invariant-mass threshold is observed. Assuming the enhancement is due to the influence of a resonance, the , a partial wave analysis with a tensor covariant amplitude determines that the spin-parity of the is 0++, and the statistical significance of the is more than 30. The mass and width of the are determined to be (stat)(syst)19(mod) MeV/ and (stat)(syst)75(mod) MeV/ and the product branching fraction is measured to be (stat)(syst)1.30(mod)), where the first error indicates the statistical error and the second is the systematical error. These results are consistent within errors with those from the BESII experiment Ablikim:2006 .
The decay is a doubly OZI suppressed process that is expected to be suppressed relative to or by at least one order of magnitude oneorder . The anomalous enhancement observed at the invariant-mass threshold and the large measured branching fractions (1/2 of PDG ) are surprising and interesting. The enhancement is not compatible with being due either to the or the , due to the different mass and spin-parity. The interpretation of the enhancement as being due to effects of final state interactions (FSI) is not excluded in this analysis. Searches for this structure in different decays modes, e.g. , , etc., and in other production processes, e.g. , etc., are essential to explore the nature of the enhancement, and gain more insight in the underlying dynamics. The search for other possible states decaying to would also be of interest. Contributions from , , partial waves are found to be necessary in the PWA fit and simply assigned to the , and , respectively, in this analysis, since the PWA fit is not sensitive to those masses and widths.
VII Acknowledgments
The BESIII collaboration thanks the staff of BEPCII and the computing center for their hard efforts. This work is supported ind part by the Ministry of Science and Technology of China under Contract No. 2009CB825200; National Natural Science Foundation of China (NSFC) under Contracts Nos. 10625524, 10821063, 10825524, 10835001, 10875113, 10935007, 11125525, 10979038, 11005109, 11079030; Joint Funds of the National Natural Science Foundation of China under Contracts Nos. 11079008, 11179007; the Chinese Academy of Sciences (CAS) Large-Scale Scientific Facility Program; CAS under Contracts Nos. KJCX2-YW-N29, KJCX2-YW-N45; 100 Talents Program of CAS; Research Fund for the Doctoral Program of Higher Education of China under Contract No. 20093402120022; Istituto Nazionale di Fisica Nucleare, Italy; Ministry of Development of Turkey under Contract No. DPT2006K-120470; U. S. Department of Energy under Contracts Nos. DE-FG02-04ER41291, DE-FG02-91ER40682, DE-FG02-94ER40823; U.S. National Science Foundation, University of Groningen (RuG) and the Helmholtzzentrum fuer Schwerionenforschung GmbH (GSI), Darmstadt; WCU Program of National Research Foundation of Korea under Contract No. R32-2008-000-10155-0.
References
- (1) M. Ablikim et al. [BES Collaboration], Phys. Rev. Lett. 96, 162002 (2006).
- (2) Kpke L, Wermes N. Decays. CERN-EP/88-93, Physics Reports 174 (1989) 67-227: CERN, CH-1211 Geneva 23, Switzerland.
- (3) B. A. Li, Phys. Rev. D 74, 054017 (2006).
- (4) K. T. Chao, arXiv:hep-ph/0602190.
- (5) P. Bicudo et al., Eur. Phys. J. C 52, 363374 (2007)
- (6) Q. Zhao et al., Phys. Rev. D 74, 114025 (2006).
- (7) D. V. Bugg, J. Phys. G 35, 075005 (2008)
- (8) C. Liu et al. [Belle Collaboration], Phys. Rev. D 79, 0701102(R)(2009).
- (9) M. Ablikim et al. [BESIII Collaboration], Chinese Phsyics C 36 (10), 915 (2012).
- (10) M. Ablikim et al. [BESIII Collaboration], Nucl. Instrum. Meth. A 614, 345 (2010).
- (11) J. Z. Bai et al. [BES Collaboration], Nucl. Instrum. Meth. A 344, 319 (1994); Nucl. Instrum. Meth. A 458, 627 (2001).
- (12) S. Agostinelli et al. [GEANT4 Collaboration], Nucl. Instrum. Meth. A 506, 250 (2003).
- (13) Z. Y. Deng et al. HEP NP 30, 371 (2006).
- (14) S. Jadach, B. F. L. Ward and Z. Was, Comp. Phys. Commu. 130, 260 (2000).
- (15) S. Jadach, B. F. L. Ward and Z. Was, Phys. Rev. D 63, 113009 (2001)
- (16) K. T. Chao et al., Modern physics A, 24 No.1 supp. (2009)
- (17) R. G. Ping, Chin. Phys. C 32, 599 (2008)
- (18) J. Beringer et al. (Particle Data Group), Phys. Rev. D 86, 010001 (2012).
- (19) J. C. Chen et al., Phys. Rev. D 62, 034003 (2000).
- (20) S. Dulat and B. S. Zou, Eur. Phys. J A 26, 125 (2005).
- (21) I.Silin,CERN Program library D510, (1971).
- (22) M. Ablikim et al. [BES Collaboration], Phys. Rev. D 72, 092002 (2005).
- (23) M. Ablikim et al. [BES Collaboration], Phys. Rev. Lett. 106, 072002 (2011).
- (24) M. Ablikim et al. [BES Collaboration], Phys. Rev. Lett. 108, 112003 (2012).
- (25) S. M. Flatté, Phys. Lett. B 63 , 224 (1976)
- (26) M. Ablikim et al. [BES Collaboration], Phys. Rev. D 83, 112005 (2011).