Present Address: ]Aurora Flight Sciences, Cambridge, MA 02142
Present Address: ]Passport Systems Inc., Billerica, MA 01862
Present Address: ]9 Wagon Meadow Road, Santa Fe, NM 87505
Cross sections for neutron-deuteron elastic scattering in the energy range 135-250 MeV
Abstract
We report new measurements of the neutron-deuteron elastic scattering cross section at energies from 135 to 250 MeV and center-of-mass angles from to . Cross sections for neutron-proton elastic scattering were also measured with the same experimental setup for normalization purposes. Our cross section results are compared with predictions based on Faddeev calculations including three-nucleon forces, and with cross sections measured with charged particle and neutron beams at comparable energies.
pacs:
25.40.Dn,13.75.Cs,21.45.-vI Introduction
Three-nucleon systems comprise an area of long-standing interest in nuclear physics. The study of these systems has been enhanced by the growing database of precise measurements on two-nucleon systems Arndt et al. (2000), and the ability of modern potential models to provide accurate predictions of nucleon-nucleon scattering observables Stoks and de Swart (1993); Wiringa et al. (1995); Machleidt (2001); Deltuva et al. (2003). Furthermore, modern computational techniques have made it possible to calculate scattering cross sections and spin observables in three-nucleon systems for any kinematical configuration using the Faddeev formalism Glockle et al. (1996), allowing the identification of experiments with strong sensitivity to the effects of three-nucleon forces (3NF). A comprehensive review of the theoretical and experimental status with regard to 3NF in few-nucleon systems has recently been published by Kalantar-Nayestanaki, Epelbaum, Messchendorp, and Nogga Kalantar-Nayestanaki et al. (2012).
In 1998, Witała and co-workers Witała et al. (1998) employed Faddeev techniques to compute differential cross sections for elastic scattering at 65, 140, and 200 MeV, using solely two-nucleon forces as well as with the inclusion of the Tucson-Melbourne (TM) three-nucleon force Coon and Glöckle (1981). The cross section is seen to fall steeply with angle, due to the direct term, and then to rise again at backward angles due to the exchange term in the two-nucleon interaction. The 3NF term alone is nearly isotropic and thus is of magnitude comparable to or greater than that of the two-nucleon term for angles at which the cross section exhibits a minimum. Similar results were achieved by Deltuva, Machleidt and Sauer Deltuva et al. (2003) in which a coupling of nucleon--isobar states to two-nucleon states is considered. Their study demonstrated that this coupling gives rise to an effective 3NF force and a pion exchange mechanism. This suggests that measurements of the intermediate-to-large angle cross section could reveal effects of 3NF. Moreover, the 3NF predictions showed significant variation with incident energy, indicating that energy-dependent measurements would be valuable.
In recent years, several measurements have been carried out in this kinematic region, supplementing early measurements of cross sections near 150 MeV Palmieri (1972) and cross sections near both 140 MeV Postma and Wilson (1961); Igo et al. (1972) and 200 MeV Adelberger and Brown (1972); Igo et al. (1972).
Measurements of differential cross sections for elastic scattering at = 270 MeV performed at the RIKEN Accelerator Research Facility were reported in 2000 by Sakai et al. Sakai et al. (2000) and in 2002 by Sekiguchi et al. Sekiguchi et al. (2002). Measurements of elastic scattering cross sections have been performed at six energies between 108 and 190 MeV at the KVI facility Ermisch et al. (2003, 2005). The cross sections at = 135 MeV were found to be 10-40% larger than those measured at RIKEN. Subsequent measurements by Sekiguchi el al. Sekiguchi et al. (2005) at 135 MeV/A using both proton and deuteron beams support the original RIKEN measurements and contradict those from KVI. In 2008, Ramazani-Moghaddam-Arani et al. Ramazani-Moghaddam-Arani et al. (2008) reported a new measurement of the cross section at KVI which yielded a result intermediate between the earlier KVI and the RIKEN cross sections.
There have been fewer studies of the cross section than of the cross section. Mermod et al. Mermod et al. (2004, 2005) measured the differential cross section for scattering at 95 MeV, and Maeda et al. Maeda et al. (2007) performed a measurement for center-of-mass angles from to at = 248 MeV. These data were found to agree well with the previous cross section measurements at = 252 MeV reported in 2002 by Hatanaka et al. Hatanaka et al. (2002).
Many of the previous experiments have been performed with polarized beams, and analyzing powers and other spin observables have been reported Ermisch et al. (2001); Sekiguchi et al. (2002); Hatanaka et al. (2002); Ermisch et al. (2005); v. Przewoski et al. (2006); Amir-Ahmadi et al. (2007); Maeda et al. (2007); Stephan et al. (2007); Ramazani-Moghaddam-Arani et al. (2008); Sekiguchi et al. (2009, 2011). Discussion of these, along with measurements of the inelastic (breakup) cross section Kistryn et al. (2003, 2005); Stephan et al. (2010); Ciepał et al. (2012), are beyond the scope of this paper.
As stated earlier, most of the previous experiments have been carried out with charged particle beams, necessitating the consideration of Coulomb effects on the cross section. Also, with the exception of the KVI work Ermisch et al. (2003, 2005) and the early work of Igo et al. Igo et al. (1972), previous measurements have been performed at a single energy. Moreover, there are still some lingering uncertainties in the magnitude and shape of the differential cross section at 135 MeV Ramazani-Moghaddam-Arani et al. (2008).
These factors have motivated the present measurement: a study of the neutron-deuteron elastic scattering cross section, at large angles where the sensitivity to 3NF is greatest, over a broad range of incident neutron energies.
Since the absolute normalization of neutron scattering experiments can be a difficult problem, the scattering cross section was also measured using the same experimental setup. The data were then used to normalize the measured cross sections. Other recent measurements have used this technique to achieve precision sufficient to distinguish among calculations which display the explicit effects of 3NF Mermod et al. (2005).
II Experiment
The experiment was carried out at the Los Alamos Neutron Science Center (LANSCE) at the Los Alamos National Laboratory, Los Alamos, New Mexico. Neutrons were produced as spallation products from an 800 MeV H- beam incident on a bare tungsten target. H- pulses from the linear accelerator had a width of approximately 0.2 ns, with an inter-pulse separation of 1.8 s. This pulse structure allowed the energy of outgoing (and incident) neutrons to be measured by time-of-flight techniques. The spallation method produced a “white” source of neutrons ranging from very low energies up to nearly 800 MeV, with an energy distribution that depends on the production angle.
This experiment was performed on a forward-angle, with respect to the primary H- beam, flight path, to maximize the flux of neutrons in the energy regime above 100 MeV. The neutron beam was defined by two sets (horizontal and vertical) of Cu shutters with typical aperture of 3.8 3.8 cm, followed by a sweep magnet to filter out charged particles. The beam entered an evacuated pipe containing a 2.7 m long steel collimator with an 1.3-cm diameter circular aperture surrounded by magnetite shielding, and exited to pass through a 238U foil fission ionization chamber Wender et al. (1993) that monitored the beam flux as a function of neutron energy. Approximately one meter downstream from the fission chamber, the beam impinged on a cryogenic target cell containing either liquid deuterium (LD2) or liquid hydrogen (LH2). The target was located approximately 18 m from the spallation source. The intensity profile and position of the beam were measured at the target position by exposing a storage-phosphor image plate.
The target geometry and orientation were designed to minimize the energy loss and reactions of outgoing charged particles. The target cell consisted of a horizontal cylindrical disk of 1.3 cm thickness and 12.7 cm diameter, with 51 m Aramica entrance and exit windows. It was placed at an angle of with respect to the incident neutron beam to provide an optimum path for the outgoing charged particles and to eliminate mechanical constraints for neutrons exiting the cell at large angles on the opposite side of the beam. The target, located in an evacuated cylindrical scattering chamber with a 127 m Kapton window, was cooled using a cryogenic refrigeration system which employed gaseous 4He as its working fluid. The system had a nominal cooling capacity of 10 W at 20 K; a resistive heater was used to maintain a nominal absolute target pressure of 97 kPa.
Scattered neutrons and recoiling charged particles were observed in coincidence. Protons and deuterons were detected by five telescopes, each consisting of a thin plastic scintillator backed by a pure CsI calorimeter. These detectors were positioned with their front faces 100 cm from the center of the target, at mean laboratory angles of , 30∘, 36∘, 42∘ and 48∘. The scintillators were 0.25 cm in thickness, and provided accurate information on the particle arrival time with an efficiency close to 100%. Their active areas of cm2 defined the solid angle for charged particle detection. The CsI calorimeters were 30 cm in depth, and provided a measure of both the particle energy and its arrival time.
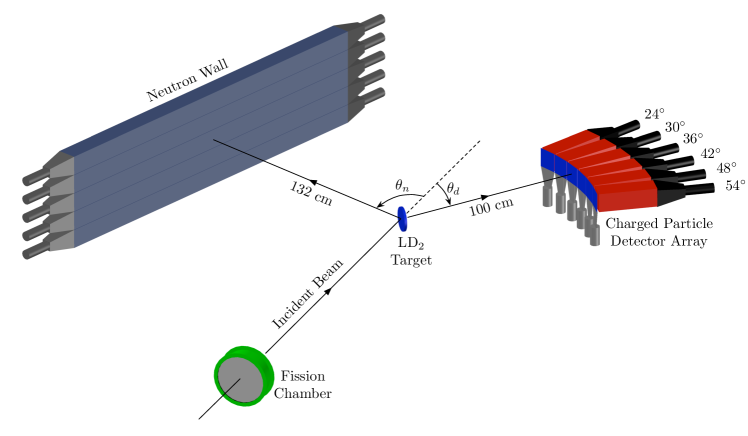
The scattered neutrons were detected with five plastic scintillator bars, each 10 cm high 10 cm thick 200 cm wide. The bars were stacked vertically to form a “wall” 200 cm wide 50 cm high. Photomultiplier tubes were attached to the ends of each bar to allow both the neutron hit position and its time-of-flight to be determined. The center of the neutron wall was positioned at a distance of 1.32 m from the target, and spanned a laboratory angle range from 34∘ to 108∘. The face of the neutron wall was covered by four thin plastic veto scintillators to eliminate events produced by charged particles. The energy threshold of each bar was determined with low energy gamma-ray sources, and the photomultiplier gains were continuously monitored using cosmic-ray triggers. The experimental setup is illustrated in Figure 1. For elastic scattering, the average neutron angles in the laboratory and center of mass systems corresponding to each recoil deuteron detector are given in Table 1.
| (Lab) | (Lab) | (CM) |
|---|---|---|
| 24 | 100 | 131 |
| 30 | 86 | 119 |
| 36 | 75 | 107 |
| 42 | 65 | 95 |
| 48 | 56 | 83 |
Data acquisition was performed using standard NIM and CAMAC modules. A pre-scaled fraction of the “singles” counts in each detector arm was read out by the electronics in addition to the coincidence events. Empty-target runs were interspersed throughout the experiment to provide a measure of background. The target was filled with LD2 for the elastic scattering cross section measurements and with LH2 for normalization purposes. The experiment has been described in detail in M. B. Chtangeev (2005).
III Data Analysis
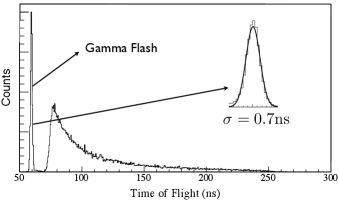
Identification of and elastic scattering events was achieved using a succession of cuts based on the charged particle and neutron detector pulse height and time information. The sequence began with a cut on the neutron beam energy. When the proton beam impinged on the tungsten spallation target, a time reference signal, called , was generated. Since gamma rays as well as neutrons and charged particles were produced in the spallation target, the “gamma flash” was easily identifiable as the leading peak in the time-of-flight spectra such as that shown in Figure 2. The position of this peak could be used to establish the time offset calibration for each detector with an uncertainty of 0.67 ns (stat) 0.20 ns (sys). The neutron beam energy for each event trigger was then deduced using the measured time between and the trigger observed in the scintillator. This calculation assumes elastic scattering kinematics, and includes a small time correction determined by Monte Carlo simulation for the charged particle energy loss. The uncertainty in incident energy using this method was estimated to be 2 MeV. Scattering cross sections were ultimately extracted in bins of 10 MeV width.
III.1 Neutron-proton Scattering Analysis
Elastic neutron-proton scattering, using a LH2 target, was observed primarily in order to determine the neutron beam flux and the target thickness. Although both of these quantities were measured, several factors contributed to the uncertainty in these measurements. The fission chamber was well calibrated for neutron energies below 100 MeV, but uncertainties in the 238U fission cross section limited the accuracy of the calibration at higher energies. The physical thickness of the cryogenic target could be measured precisely at atmospheric pressure and room temperature, but not when the target was under vacuum and filled with liquid hydrogen or deuterium. Visual inspection of the target through the window of the scattering chamber under operating conditions revealed two effects, a bulging-outward of the cell windows and a steady stream of rising bubbles, both of which would change the effective target thickness.
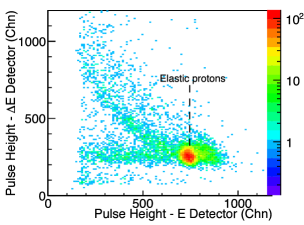
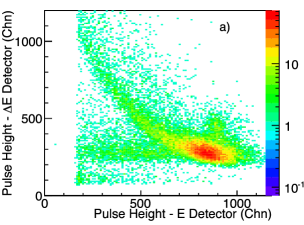
After the cut on the neutron beam energy, graphical cuts were applied on the histograms for the five charged particle telescopes. An example is shown in Figure 3. Since the event rate was dominated by elastic scattering, the recoil protons clearly stand out over backgrounds from protons elastically and inelastically scattered by other materials (curved band) and from protons experiencing strong interactions in the detectors as well as particles other than protons (horizontal band). For the data taken with hydrogen, these cuts were sufficiently selective to provide a good measure of the efficiency for charged particle detection, even when using the proton singles trigger in which information from the neutron detectors was not considered. This was particularly true after the backgrounds, determined from data taken with the target evacuated, were subtracted.
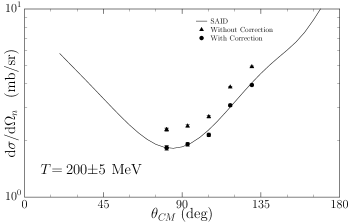
The measured scattering cross sections, with a “floating” absolute normalization, were compared to predictions from the SAID multi-energy partial wave analysis Arndt et al. (2000), known to be accurate at the 1% level in this energy regime based on comprehensive fits to the SAID database. Use of alternative partial wave analyses produced little difference in the results. Target thickness being the dominant factor in this renormalization, no strong energy dependence of the renormalization factor is expected; hence an overall renormalization factor of 1.25 was determined and was subsequently applied to the scattering data. Figure 4 shows the cross section obtained from this work before and after renormalization.
Assuming the fission chamber calibration to be substantially correct, the correction factor represents a 25% increase in the effective target thickness.111With regard to the validity of applying the same renormalization factor to the data: the fission chamber calibration and the window-bulging will certainly be the same for both hydrogen and deuterium. Following the experiment, the target cell was observed (at room temperature and atmospheric pressure) to have a permanent deformation; its physical thickness had increased by a factor of 1.45. The reduction of the effective target thickness due to bubbling apparently leads to the factor 1.25. In principle the reduction could be different for LH2 and LD2, since the boiling point temperature for LD2 is lower. However, the systematic error associated with the assumption of a constant renormalization factor is estimated to be 10% at worst, and has been included in the analysis.
III.2 Neutron Detector Efficiency
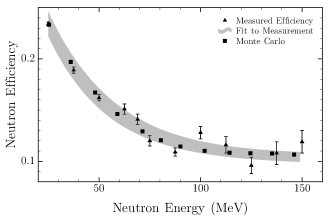
In addition to providing the normalization, the scattering data were used to determine the efficiency of the neutron detectors. This is necessary since the data analysis requires the neutron-charged particle coincidence trigger. Scattered neutron energies were determined by the measured beam energy and the proton scattering angle. The ratio of the number of coincident neutrons observed in the relevant regions of the wall of neutron bars to the total number of measured protons was used to determine the neutron detector efficiency. The results are presented in Figure 5 as a function of neutron energy. Also shown in the figure are the results of a Monte Carlo simulation Cecil et al. (1979). The band shows the range of efficiencies which were found by fitting the data with a decaying exponential. Due to the effect of light attenuation in the scintillator, the efficiency decreases for neutrons incident near the ends of the bar. To account for this position dependence, a separate analysis was performed in which the efficiencies for neutrons with the same energy but different positions were determined. These results provided correction factors for the data obtained at charged particle angles of 24∘ and 30∘. The additional systematic error introduced by this procedure will be discussed later.
III.3 Charged Particle Detection Efficiency
Recoiling charged particles will lose varying amounts of energy in the target depending on the location of the scattering event, and then will suffer further energy losses in the windows, air, and scintillator before being detected in the CsI. For scattering, a Monte Carlo simulation of these effects showed that all deuterons produced with energies greater than 35 MeV are detected. Since the lowest recoil deuteron energy in the present work is about 40 MeV, the efficiency of charged particle detection is assumed to be unity.
III.4 Neutron-deuteron Scattering Analysis
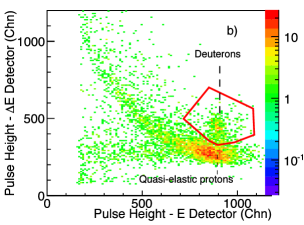
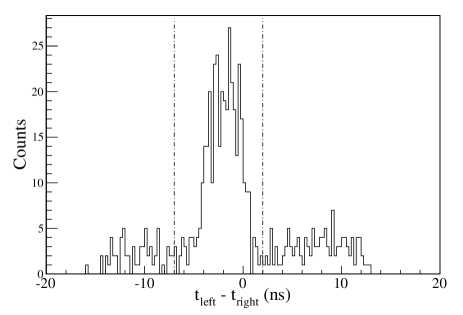
Analysis of the data was more challenging than that of the data, since the elastic scattering cross section is much smaller than the quasi-elastic scattering cross section. Although in principle detection of a deuteron (in singles mode)in a charged-particle telescope is a unique signature of elastic scattering, in practice the limited resolution of these detectors does not allow unambiguous separation of deuterons and protons. This difficulty was resolved by employing the neutron-charged particle coincidence trigger. In coincidence mode, successive cuts were applied on both the difference between and the sum of the arrival times of the pulses at the left and right ends of the neutron bars. The difference provides the location on the bar and the sum the total time-of-flight of the neutrons. The elastically scattered neutrons associated with a given recoil deuteron angle satisfy kinematic conditions with respect to both position and time-of-flight, whereas the values for background events are distributed over the possible range. Typical histograms both before and after these conditions were imposed are shown in Figure 6. The suppression of the quasi-elastic events now allows the recoil deuteron peak to be observed.
A typical measured distribution of neutron scattering angles for neutrons in coincidence with deuterons satisfying the particle-identification cut is shown in Figure 7. In this histogram the neutron scattering angle is represented by the measured difference between the pulse arrival times at the left and right ends of the scintillator bars. Neutrons from the elastic events are easily recognizable above the background. The region of interest is selected, and the events in that region are counted. For the majority of cases the background is relatively constant, allowing it to be easily interpolated under the region of the elastic peak and then subtracted from the total peak yield. In a few cases the background was not uniform, due to the residual quasi-elastic protons which remained inside the deuteron cut. For these cases, a mathematical model was used to estimate the background. This procedure introduced additional systematic errors, estimated to be around 10%.
A correction factor was applied to each measurement to account for a slight degree of polarization in the neutron beam. The neutron polarization on the 15R flight path was measured previously with a CH2 polarimeter using left-right symmetric detection of scattering yields Hough (2001). The average vertical component of the beam polarization was found to be about 0.06, and to vary slightly with energy. The correction factor to the measured yield is given by , where represents the polarization component normal to the scattering plane, and represents the analyzing power for the reaction. This correction was applied to both the and the scattering data. The same partial wave analyses used in the evaluation of cross sections were also used to determine elastic analyzing powers to a precision of about 0.01. The estimated elastic analyzing powers had a greater uncertainty, since they were based on a limited set of available data. Because of the small size of , this uncertainty in constitutes a relatively small systematic uncertainty, even if no correction is made. In the end, the corrections due to polarization are about 1%, and are not significant compared with the other errors.
III.5 Systematic Errors
An error of about 3% was assigned due to small deviations of the detectors from their assumed positions which was simulated with a Monte Carlo study. An error of 5% was due to normalization. As mentioned earlier, the normalization coefficient may not be the same for LH2 and LD2 target due to different boiling points and bubbling levels. Therefore, a generous error of 10% was introduced as there is no way of measuring this effect. The neutron detection efficiency error is about 5% on the average, varying slightly with energy. A separate analysis showed that the error due to the unknown uranium cross section has to be included in addition to the normalization error. The systematic error of interpolation in the unknown cross section region is estimated to be 9%.
Additional errors were introduced for the most backward-angle data. The position dependence in the neutron detection efficiency led to systematic uncertainties of 14% at 24∘, and 11% at 30∘. Moreover, the method used to deal with nonuniform background in the neutron time-of flight difference spectrum at 24∘ introduces about 10% systematic error. Therefore, the results at 36∘, 42∘ and 48∘ carry about 16% total systematic uncertainty, whereas the results at 24∘ and 30∘ have about 24% and 19% total systematic error, respectively.
IV Results
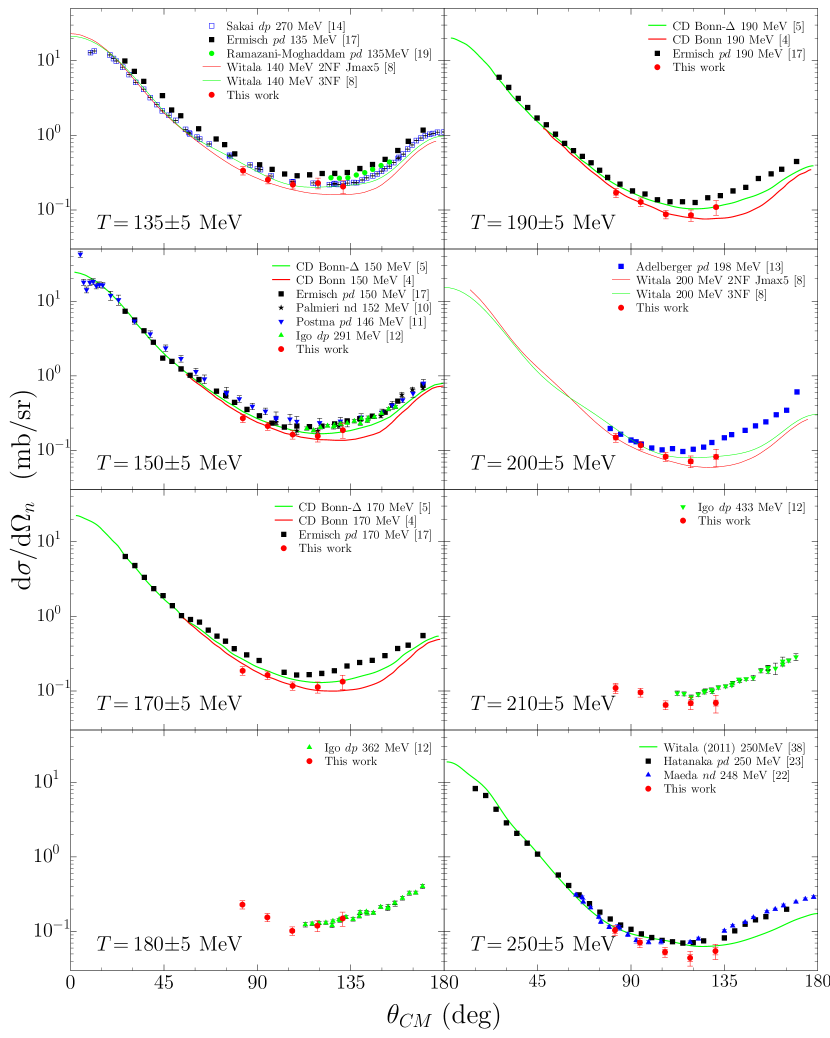
Cross sections for elastic scattering were obtained over the range of neutron (lab) energies from 130 to 255 MeV. At lower energies, the energy loss of the recoil deuterons in the target and air was found to be too large; at energies above 255 MeV, particle identification based on the – plot became unreliable. The data were binned into 5 MeV intervals at each of a total of eight centroid beam energies, and the differential cross sections were then calculated for each of the recoil deuteron angles. These results, and their uncertainties, are listed in Table 2, and are shown as angular distributions in Figure 8. The broad energy coverage apparent in these figures is a unique feature of the present experiment, while the angular range of these new data is observed to fall in all cases within the region of the minimum of the cross section – i.e., where the sensitivity to the effects of three-nucleon forces is expected to be largest.
Also included in these figures are the relevant data from previous , , and scattering experiments. The most extensive comparison that can be made with previous work is with the KVI measurements of references Ermisch et al. (2003, 2005). In nearly all cases these cross sections are larger than the present results. At our lowest energy, 135 MeV, the current results are in good agreement with the RIKEN cross sections Sakai et al. (2000).
Figure 8 also displays the calculated cross sections. At 135 and 200 MeV, the Faddeev calculations of reference Witała et al. (1998); Coon and Glöckle (1981) are shown both with and without the inclusion of 3NF. As expected, these results are significantly different from each other only at angles larger than about 90∘. At both of these energies, the present cross sections are found to be in better agreement with the 3NF results. At 150, 170, and 190 MeV the data are compared with calculations based on the CD Bonn potential without and with the inclusion of a – component Deltuva et al. (2003). At the largest angle where this effect is most significant, the data favor its inclusion.
| Lab | CM | ||||||
|---|---|---|---|---|---|---|---|
| (MeV) | (deg) | (deg) | (b/sr) | ||||
| 24 | 131 | 206 | 6 | 45 | |||
| 30 | 119 | 230 | 6 | 44 | |||
| 36 | 107 | 218 | 5 | 34 | |||
| 42 | 95 | 255 | 7 | 40 | |||
| 48 | 83 | 337 | 14 | 53 | |||
| 24 | 131 | 187 | 6 | 45 | |||
| 30 | 119 | 156 | 5 | 29 | |||
| 36 | 107 | 164 | 5 | 27 | |||
| 42 | 95 | 213 | 6 | 34 | |||
| 48 | 83 | 270 | 9 | 42 | |||
| 24 | 131 | 143 | 5 | 33 | |||
| 30 | 119 | 161 | 5 | 31 | |||
| 36 | 107 | 142 | 5 | 22 | |||
| 42 | 95 | 209 | 7 | 33 | |||
| 48 | 83 | 301 | 9 | 48 | |||
| 24 | 131 | 134 | 6 | 32 | |||
| 30 | 119 | 113 | 5 | 21 | |||
| 36 | 107 | 117 | 5 | 18 | |||
| 42 | 95 | 164 | 6 | 26 | |||
| 48 | 83 | 187 | 8 | 30 | |||
| 24 | 131 | 149 | 7 | 34 | |||
| 30 | 119 | 120 | 6 | 22 | |||
| 36 | 107 | 102 | 5 | 16 | |||
| 42 | 95 | 155 | 6 | 25 | |||
| 48 | 83 | 229 | 9 | 36 | |||
| 24 | 131 | 109 | 6 | 26 | |||
| 30 | 119 | 85 | 5 | 16 | |||
| 36 | 107 | 87 | 4 | 14 | |||
| 42 | 95 | 128 | 6 | 20 | |||
| 48 | 83 | 170 | 12 | 26 |
| Lab | CM | ||||||
|---|---|---|---|---|---|---|---|
| (MeV) | (deg) | (deg) | (b/sr) | ||||
| 24 | 131 | 82 | 6 | 23 | |||
| 30 | 119 | 72 | 5 | 14 | |||
| 36 | 107 | 83 | 5 | 13 | |||
| 42 | 95 | 117 | 6 | 18 | |||
| 48 | 83 | 149 | 11 | 23 | |||
| 24 | 131 | 69 | 6 | 18 | |||
| 30 | 119 | 69 | 5 | 13 | |||
| 36 | 107 | 65 | 4 | 10 | |||
| 42 | 95 | 96 | 6 | 15 | |||
| 48 | 83 | 110 | 11 | 17 | |||
| 24 | 131 | 60 | 6 | 16 | |||
| 30 | 119 | 78 | 5 | 15 | |||
| 36 | 107 | 86 | 4 | 13 | |||
| 42 | 95 | 116 | 6 | 18 | |||
| 48 | 83 | 211 | 9 | 33 | |||
| 24 | 131 | 64 | 6 | 16 | |||
| 30 | 119 | 51 | 6 | 10 | |||
| 36 | 107 | 69 | 6 | 11 | |||
| 42 | 95 | 77 | 7 | 12 | |||
| 48 | 83 | 93 | 11 | 14 | |||
| 24 | 131 | 40 | 6 | 12 | |||
| 30 | 119 | 42 | 5 | 8 | |||
| 36 | 107 | 52 | 4 | 8 | |||
| 42 | 94 | 90 | 5 | 14 | |||
| 48 | 82 | 127 | 8 | 20 | |||
| 24 | 131 | 55 | 6 | 12 | |||
| 30 | 119 | 44 | 5 | 8 | |||
| 36 | 106 | 53 | 4 | 8 | |||
| 42 | 94 | 71 | 5 | 11 | |||
| 48 | 82 | 104 | 10 | 16 |
V Conclusion
In this study, the differential cross section for elastic scattering was measured in a continuous incident neutron energy range from 135 to 250 MeV, by detecting scattered neutrons and recoil deuterons in coincidence, with the aim of elucidating the contribution of three-nucleon forces (3NF), in particular the energy dependence of this effect. The absolute scale of the cross section was determined by concurrent measurements of elastic scattering, which were also used to determine the neutron detection efficiency.
The effect of 3NF is clearly seen in this work. The data at angles near the minimum in the cross section, where the 3NF contribution is most effective, are in excellent agreement at all energies with the theoretical predictions.
The 3NF effect could be further tested by confronting the present data with theoretical predictions for the differential cross section at fixed angles as a function of incident neutron energy.
Acknowledgements.
We wish to acknowledge K. Boddy for her contributions to various aspects of this experiment. We thank the staff of the Los Alamos Neutron Science Center for reliable delivery of beam and for help in preparing the experimental area, particularly in maintaining the liquid deuterium target. This work was supported in part by the U.S. Department of Energy and the National Science Foundation, the Scientific and Technological Research Council of Turkey (107T538), and Bogazici University Research Fund (BAP6057).References
- Arndt et al. (2000) R. A. Arndt, I. I. Strakovsky, and R. L. Workman, Phys. Rev. C 62, 034005 (2000).
- Stoks and de Swart (1993) V. Stoks and J. J. de Swart, Phys. Rev. C 47, 761 (1993).
- Wiringa et al. (1995) R. B. Wiringa, V. G. J. Stoks, and R. Schiavilla, Phys. Rev. C 51, 38 (1995).
- Machleidt (2001) R. Machleidt, Phys. Rev. C 63, 024001 (2001).
- Deltuva et al. (2003) A. Deltuva, R. Machleidt, and P. U. Sauer, Phys. Rev. C 68, 024005 (2003).
- Glockle et al. (1996) W. Glockle et al., Phys. Rep. 274, 107 (1996).
- Kalantar-Nayestanaki et al. (2012) N. Kalantar-Nayestanaki et al., Rep. Prog. Phys. 75, 1 (2012).
- Witała et al. (1998) H. Witała et al., Phys. Rev. Lett. 81, 1183 (1998).
- Coon and Glöckle (1981) S. A. Coon and W. Glöckle, Phys. Rev. C 23, 1790 (1981).
- Palmieri (1972) J. Palmieri, Nuclear Physics A 188, 72 (1972).
- Postma and Wilson (1961) H. Postma and R. Wilson, Phys. Rev. 121, 1229 (1961).
- Igo et al. (1972) G. Igo et al., Nuclear Physics A 195, 33 (1972).
- Adelberger and Brown (1972) R. E. Adelberger and C. N. Brown, Phys. Rev. D 5, 2139 (1972).
- Sakai et al. (2000) H. Sakai et al., Phys. Rev. Lett. 84, 5288 (2000).
- Sekiguchi et al. (2002) K. Sekiguchi et al., Phys. Rev. C 65, 034003 (2002).
- Ermisch et al. (2003) K. Ermisch et al., Phys. Rev. C 68, 051001 (2003).
- Ermisch et al. (2005) K. Ermisch et al., Phys. Rev. C 71, 064004 (2005).
- Sekiguchi et al. (2005) K. Sekiguchi et al., Phys. Rev. Lett. 95, 162301 (2005).
- Ramazani-Moghaddam-Arani et al. (2008) A. Ramazani-Moghaddam-Arani et al., Phys. Rev. C 78, 014006 (2008).
- Mermod et al. (2004) P. Mermod et al., Physics Letters B 597, 243 (2004).
- Mermod et al. (2005) P. Mermod et al., Phys. Rev. C 72, 061002 (2005).
- Maeda et al. (2007) Y. Maeda et al., Phys. Rev. C 76, 014004 (2007).
- Hatanaka et al. (2002) K. Hatanaka et al., Phys. Rev. C 66, 044002 (2002).
- Ermisch et al. (2001) K. Ermisch et al., Phys. Rev. Lett. 86, 5862 (2001).
- v. Przewoski et al. (2006) B. v. Przewoski et al., Phys. Rev. C 74, 064003 (2006).
- Amir-Ahmadi et al. (2007) H. R. Amir-Ahmadi et al., Phys. Rev. C 75, 041001 (2007).
- Stephan et al. (2007) E. Stephan et al., Phys. Rev. C 76, 057001 (2007).
- Sekiguchi et al. (2009) K. Sekiguchi et al., Phys. Rev. C 79, 054008 (2009).
- Sekiguchi et al. (2011) K. Sekiguchi et al., Phys. Rev. C 83, 061001 (2011).
- Kistryn et al. (2003) S. Kistryn et al., Phys. Rev. C 68, 054004 (2003).
- Kistryn et al. (2005) S. Kistryn et al., Phys. Rev. C 72, 044006 (2005).
- Stephan et al. (2010) E. Stephan et al., Phys. Rev. C 82, 014003 (2010).
- Ciepał et al. (2012) I. Ciepał et al., Phys. Rev. C 85, 017001 (2012).
- Wender et al. (1993) S. Wender et al., Nucl. Inst. and Meth. A 336, 226 (1993).
- M. B. Chtangeev (2005) M. B. Chtangeev, M.S. Thesis, Massachusetts Institute of Technology (2005).
- Cecil et al. (1979) R. Cecil, B. Anderson, and R. Madey, Nucl. Inst. and Meth. 161, 439 (1979).
- Hough (2001) J. B. Hough, B.S. Thesis, Massachusetts Institute of Technology (2001).
- Witała et al. (2011) H. Witała et al., Phys. Rev. C 83, 044001 (2011).