Ultrafast tilting of the dispersion of a photonic crystal
and adiabatic spectral compression of light pulses
Abstract
We demonstrate, by theory and experiment, the ultrafast tilting of the dispersion curve of a photonic-crystal waveguide following the absorption of a femtosecond pump pulse. By shaping the pump-beam cross section with a nanometric shadow mask, different waveguide eigenmodes acquire different spatial overlap with the perturbing pump, leading to a local flattening of the dispersion by up to 11 %. We find that such partial mode perturbation can be used to adiabatically compress the spectrum of a light pulse traveling through the waveguide.
pacs:
42.70.Qs, 42.25.Bs, 42.82.-m, 78.67.PtPhysical systems can often be described by their eigenmodes, that is, states of light or matter oscillating with a well-defined frequency. For instance, the quantum-mechanical eigenstates of an electron spin are spin-up and spin-down KittelBook , while the optical eigenmodes of a photonic crystal are Bloch waves characterized by their wavevector and angular frequency JoannopoulosBook . Controlling the eigenfrequencies allows for the reversible manipulation of light and matter, provided the dynamics evolve adiabatically, without exchange of energy between the eigenmodes. As an example, adiabatically changing the frequency spacing of spin states is nowadays routinely employed to cool solids KittelBook or to control the precession of a single spin BerezovskyScience . The state-dependent change in eigenfrequencies is realized by an external magnetic or electric field which couples differently to spin-up and spin-down states.
Usually, however, optical eigenmodes (such as those of photonic crystals or microresonators) are perturbed by a homogeneous and isotropic stimulus, leading to one and the same shift of all the eigenfrequencies MazurenkoPRL ; VlasovNature ; LinOE ; TanabePRL ; TobiasPRA ; UphamAPEX . A much higher level of control could be achieved if one allows for a spatially varying perturbation that has different overlap with the light field of different modes. Such a process would result in a modified frequency spacing and density of states TanPRB , which is particularly interesting for a photonic crystal with its continuum of modes . Figure 1(a) shows that a -dependent mode-shift would lead to a local tilting of the photonic dispersion . A light pulse being a superposition of these wavefunctions could then be spectrally compressed and temporally stretched, provided the dynamics were adiabatic. Moreover, as first proposed by Yanik and Fan YanikPRL , such pulse could be also slowed down beyond the classical delay-bandwidth limitation.
In this Letter, we demonstrate that perturbing selected regions of a photonic-crystal waveguide (PCW) by means of a spatially shaped femtosecond laser pulse can locally flatten or steepen the dispersion curve. This novel procedure is akin to altering the shape of the “potential” confining the wavefunctions, thereby realizing a new dispersion relationship and density of states JoannopoulosBook . Such partial mode perturbation (PMP) can be used to compress or expand the spectrum of a picosecond light pulse traveling through the waveguide. As this operation proceeds adiabatically, it is reversible and features high conversion efficiency.
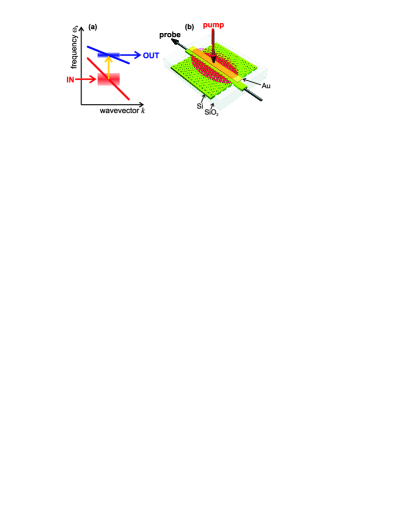
Our nanophotonic approach is schematically shown in Fig. 1(b). Whilst a light pulse travels through a PCW, a pump pulse incident from above generates an electron-hole plasma in the Si parts of the structure, thereby reducing the refractive index. The index change does not occur in the waveguide center as a shadow mask keeps pump light away from that region. Since PCW eigenmodes have a strongly -dependent lateral extent [Fig. 2(a)], each mode has a different spatial overlap with the pumped Si volume, resulting in a pronounced variation of the mode-shift with respect to . Note that the dynamics of the probe pulse inside the waveguide will proceed adiabatically because the pump pulse respects all spatial symmetries of the PCW TobiasPRA ; YanikPRL . Breaking these symmetries would result in energy transfer between different modes DanielJOSAB as has been shown in a complementary experiment DongPRL .
Theory. We first explore our approach theoretically. To this end, we consider the frequency shift of mode that results when the pump pulse alters the refractive-index landscape of the photonic crystal by an amount . Here, reflects the normalized spatial distribution of the absorbed pump energy, which induces a change in the real part of the refractive index at positions where . Perturbation theory JoannopoulosBook then predicts a relative eigenfrequency shift
| (1) |
which is directly proportional to the spatial overlap
| (2) |
between the profiles of perturbation and eigenmode. In these relations, denotes the refractive index of the unpumped Si, and is the energy density of mode normalized according to .
In order to tilt the dispersion, needs to be -dependent. More precisely, we have to realize a relative change in the local slope of the dispersion curve that is much larger than the perturbation . Note that also quantifies the relative velocity change and relative spectral compression [Fig. 1(a)] of a light pulse encountering the dispersion change on-the-fly. In this respect, PCWs offer two unique benefits. First, the lateral mode extent depends strongly on as seen in Fig. 2(a) PetrovOE ; LiamOE . Second, using the slow-light modes with low group velocity means that can be enhanced for a given TobiasPRA .
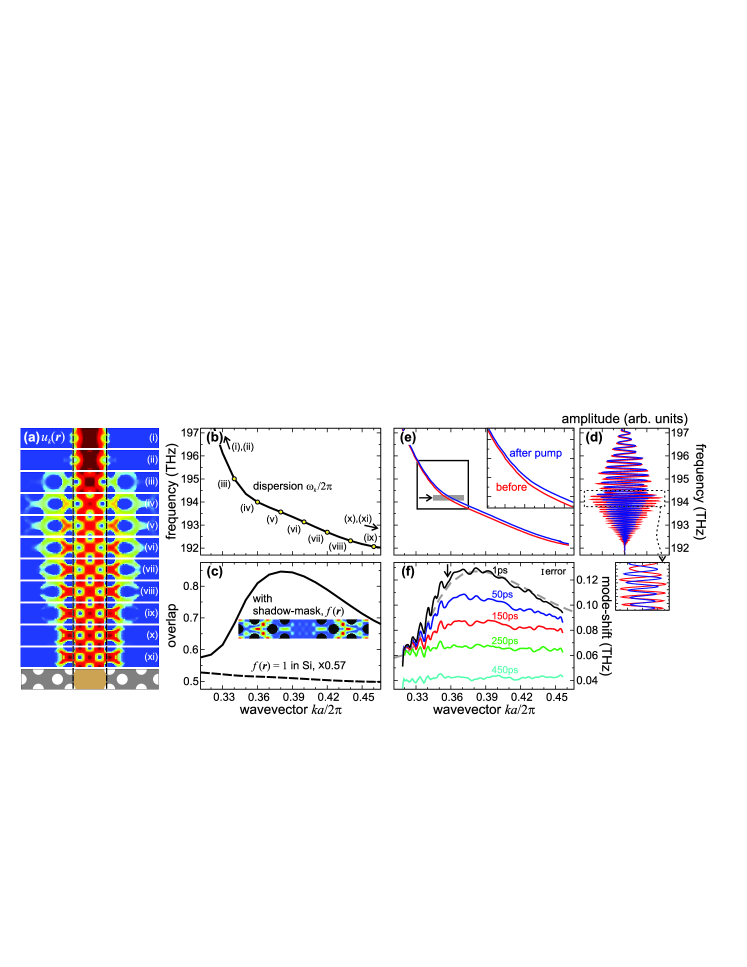
We calculated the eigenmodes MPB of a PCW [Fig. 1(b)], which can be pictured as a missing row of holes in a Si membrane (thickness 220 nm), perforated with a hexagonal pattern of holes (lattice period nm, hole diameter 220 nm). The PCW (length m) has a 600-nm thick SiO2 cladding on top of which a Au stripe (675 nm wide, 20 nm thick) serves as a shadow mask. The overlap and, thus, the interaction between mask and the evanescent tail of light inside the waveguide are negligible. Figure 2(a) displays the unit cell of the PCW and the profile of the electromagnetic energy density for several modes . The respective values of can be inferred from the points labeled (i) to (xi) in the dispersion curve of Fig. 2(b). With increasing , the slope of and, thus, the group velocity decrease continuously, ending up in a flat dispersion being characteristic of slow light ( at ) BabaNP . As seen in Fig. 2(a), the transition from fast to slow light is accompanied by drastic changes in the spatial mode profile PetrovOE ; LiamOE . Whereas the light field of modes (i) and (ii) lies nearly entirely under the shadow mask, it spreads out into the surrounding lattice of holes for modes (iii) to (v) and then starts to contract again for modes (vi) to (xi).
The -dependent lateral mode spread should be also reflected by the overlap of mode profile and pump pattern, as long as the mask’s shadow on the Si surface is not washed out by diffraction of the pump beam. Finite-difference time-domain simulations Rsoft of the pump-pulse propagation indeed verify that roughly follows the shape of the mask’s geometric shadow [inset of Fig. 2(c)]. The resulting overlap [Eq. (2)] of with the waveguide modes is shown in Fig. 2(c) and exhibits the expected behavior: a steep rise for low wavevectors followed by a flatter decay at higher . Thus, any pulse populating these modes will be spectrally compressed or expanded upon the dynamic action of the perturbation. For comparison, the dashed line shows the frequency shift for the case of a homogeneous perturbation profile ( throughout the Si). The dependence of nearly vanishes because the total amount of mode energy inside the Si material is almost independent of .
Experiment. In order to put our PMP scheme to test, we fabricated a masked PCW with the same geometrical parameters used in the calculations by means of electron-beam lithography and reactive ion etching. After filling with SiO2, a Au shadow mask is placed on top of the SiO2 cladding by metal evaporation and lift-off. In order to excite the PCW, pump pulses (center wavelength 810 nm, duration 100 fs full width at half maximum of the intensity, pulse energy 2 nJ, repetition rate 80 MHz) from a Ti:sapphire laser pass a slit and cylindrical lenses resulting in a 3-m thin line focus on the Si-membrane surface. The slit ensures exclusive and homogeneous excitation along the length of the PCW. To measure the PCW transmittance over a large bandwidth, a Fourier-limited probe pulse (1540 nm, 180 fs, 10 pJ) from an optical parametric oscillator is coupled into the waveguide at a delay after excitation by the pump pulse. We pick up the probe at the output facet and determine the complex-valued Fourier amplitude of its electric field by means of spectral interferometry LepetitJOSAB ; TobiasOL . By varying the delay between pump and probe pulse, we obtain a two-dimensional data set .
Figure 2(d) shows the real part of the measured at 40 ps before PCW pumping ( ps, red line) and at 1 ps after ( ps, blue line). In both cases, two regimes with slow and fast oscillations are observed. Assuming single-mode propagation, the phase acquired by the probe pulse after propagation through the PCW equals . Thus, versus oscillates more rapidly for slower light as the inverse group velocity is larger. Therefore, the fast and slow oscillations in Fig. 2(d) are signatures of slow and fast light, respectively. Solving for the phase of allows us to extract the wavevector as a function of (apart from an unknown offset since only phase differences can be measured). The so-obtained waveguide dispersion is shown in Fig. 2(e) before and after Si pumping. One clearly recognizes the regions of fast and slow light, and the shape of both curves is in very good agreement with that of the one calculated [Fig. 2(b)].
A superficial glance at Fig. 2(e) might lead to the notion that the dispersion directly after PCW pumping ( ps) is just a blueshifted version of the dispersion of the unpumped waveguide. However, a magnified view [inset of Fig. 2(e)] reveals departures from such rigid-shift-type behavior. This observation becomes even more apparent when we subtract one of the dispersion curves from the other. Figure 2(f) presents the resulting pump-induced mode-shift at various delays after PCW pumping. Shortly after excitation ( ps), the mode-shift varies strongly with the wavevector, from THz (at ) to over 0.120 THz (0.38), before dropping back to 0.095 THz (0.45). This curve agrees excellently with the theoretical prediction [solid line in Fig. 2(c), gray dashed line in Fig. 2(f)]. Comparison of the calculated overlap and the measured mode-shift with Eq. (1) allows us to estimate the pump-induced change in the Si refractive index to . Interestingly, at [arrows in Figs. 2(e) and 2(f)], the measured and, thus, have a quite steep slope whereas the slope of is rather flat, resulting in a measured ratio of as much as . This value is more than 80 times larger than the perturbation , showing that our nanophotonic approach [Fig. 1(b)] indeed causes a strongly -dependent frequency shift of the photonic-crystal eigenmodes.
At later times after pump excitation, charge-carrier diffusion and recombination in Si are expected to modify the refractive-index distribution TanPRB . Indeed, with increasing delay , the measured [Fig. 2(f)] undergoes an overall decrease and returns into a flat line ( ps). This final, virtually -independent mode-shift agrees well with the calculated for a homogeneous excitation pattern [dashed line in Fig. 2(c)]. Thus, after about 250 ps, the pump-induced charge carriers have diffused into the Si underneath the 675 nm wide shadow mask, resulting in a homogenous carrier density. These numbers allow us to estimate a mean diffusion constant of , which is in good agreement with previous measurements LiPRB . Whereas the observed flattening of the dispersion change arises from carrier diffusion, the temporal decrease of the -averaged on a time scale of about 500 ps is a consequence of carrier recombination, predominantly taking place at the surface of the PCW TanPRB .
Spectral compression. We finally illustrate how the ultrafast modifications of the PCW dispersion can be used to spectrally compress a light pulse. For this purpose, we consider a Fourier-limited Gaussian pulse with a duration of 1.9 ps and a center frequency of 194.2 THz as PCW input [arrows in Figs. 2(e) and 2(f)] for the following two reasons. First, the spectrum coincides with a part of the dispersion that undergoes a significant pump-induced flattening (see above). Second, this pulse allows one to confine 96 % of its energy within the length of the waveguide as its duration is significantly shorter than its transit time of 5.6 ps.
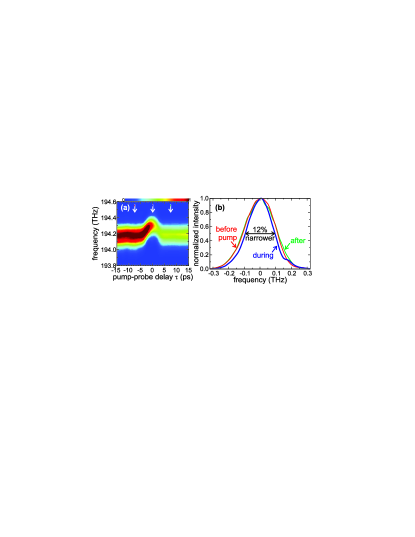
We are able to determine the PCW response to the fictitious 1.9-ps input pulse from the two-dimensional data set [Fig. 2(d)] that was measured using the much more broadband 180-fs probe pulse. This approach TobiasOL ; TobiasPRA merely presumes that the waveguide response to the weak probe pulse is linear, which we have verified experimentally. The extracted output spectrum is shown in Fig. 3(a) as a function of the delay between pump and probe pulse. At delays ps and ps, no dynamics occur as the probe pulse encounters a fully unexcited or excited waveguide, respectively. The energy of the output pulse is smaller in the excited case because free charge carriers lead to additional light absorption. At , the probe pulse is fully contained in the PCW when the pump-induced shift of the dispersion curve occurs. As the light populating these modes is frequency-shifted as well [Fig. 1(a)], we find a clear blueshift of the PCW output around [Fig. 3(a)]. The center frequency increases by 0.12 THz, in good agreement with the magnitude of the measured [Fig. 2(f)].
In order to evaluate further spectral modifications of the blueshifted pulse, Fig. 3(b) displays the extracted output spectra before and after waveguide excitation as well as at [see arrows in Fig. 3(a)]. For better comparison, the spectra are normalized to the same height, and their center frequencies are shifted to frequency . Note that the spectrum of the blueshifted pulse is noticeably narrower than the spectra obtained before and after PCW pumping. The relative spectral decrease of the full width at half maximum amounts to about 11 %, which agrees well with the relative change of 12 % of the slope of the dispersion curve [Figs. 2(e) and 2(f)]. Therefore, our findings are consistent with the adiabatic spectral compression of light as anticipated in Fig. 1(a). The conversion efficiency is better than 60 % and only limited by free-carrier absorption. We note that adiabatic spectral expansion can also be obtained when pulses in the slow-light region at 193.3 THz [Fig. 2(e)] are used (data not shown).
In conclusion, we have demonstrated that partial mode perturbation can be used for all-optical adiabatic pulse-bandwidth compression. This process is significant because it overcomes the fundamental bandwidth-delay constraint in optics YanikPRL . Ultimately, such a process can generate arbitrarily small group velocities for any light pulse with a given bandwidth, without the need for intrinsic material resonances. The unavoidable signal loss due to free-carrier absorption could be prevented by using tuning mechanisms like the instantaneous optical Kerr effect. Besides the dynamical slow-down of light, spectral compression could also find application as a magnifying time lens KolnerOL ; BiancalanaPRE ; FosterNature : the uniform shrinking of the frequency axis by a factor yields an expansion of the pulse by the inverse factor in the time domain. The magnitude of the spectral compression could be enhanced further by optimizing the profiles of the perturbing pump or by modifying the photonic crystal itself. One could repeat the spectral compression in cascaded photonic crystals: the smaller the bandwidth of the pulse becomes, the smaller the slope of the dispersion of the next waveguide-stage can be chosen, leading to a larger relative compression .
We acknowledge funding through the EU FP6-FET “SPLASH” project. This work is also part of the research program of FOM, which is financially supported by the NWO.
References
- (1) C. Kittel, Introduction to solid state physics, Wiley (2005).
- (2) J. D. Joannopoulos, Photonic crystals: molding the flow of light, Princeton University Press (2008).
- (3) J. Berezovsky, M. H. Mikkelsen, N. G. Stoltz, L. A. Coldren, and D. D. Awschalom, Science 320, 349 (2008).
- (4) D. A. Mazurenko et al., Phys. Rev. Lett. 91, 213903 (2003).
- (5) Y. A. Vlasov, M. O Boyle, H. F. Hamann, and S. J. McNab, Nature 438, 65 (2005).
- (6) Q. Lin, T. J. Johnson, C. P. Michael, and O. Painter, Opt. Express 16, 14801 (2008).
- (7) T. Tanabe, M. Notomi, H. Taniyama, and E. Kuramochi, Phys. Rev. Lett. 102, 043907 (2009).
- (8) T. Kampfrath et al., Phys. Rev. A 81, 043837 (2010).
- (9) J. Upham, Y. Tanaka, T. Asano, and S. Noda, Appl. Phys. Express 3, 062001 (2010).
- (10) H. W. Tan, H. M. van Driel, S. L. Schweizer, and R. B. Wehrspohn, Phys. Rev. B 72, 165115 (2005).
- (11) M. F. Yanik and S. Fan, Phys. Rev. Lett. 92, 083901 (2004).
- (12) B. A. Daniel, D. N. Maywar, and G. P. Agrawal, J. Opt. Soc. Am. B 28, 2207 (2011).
- (13) P. Dong, S. F. Preble, J. T. Robinson, S. Manipatruni, and M. Lipson, Phys. Rev. Lett. 100, 033904 (2008).
- (14) A. Petrov, M. Krause, and M. Eich, Opt. Express 17, 8676 (2009).
- (15) L. O’Faolain et al., Opt. Express 18, 27627 (2010).
- (16) We used the freely available MIT Photonic Bands package, see S. G. Johnson and J. D. Joannopoulos, Opt. Express 8, 173 (2001).
- (17) T. Baba, Nature Photon. 2, 465 (2008).
- (18) We used the commercially available software Fullwave by Rsoft.
- (19) L. Lepetit, G. Ch riaux, and M. Joffre, J. Opt. Soc. Am B 12, 2467 (1995).
- (20) T. Kampfrath, D. M. Beggs, T. F. Krauss, and L. Kuipers, Opt. Lett. 34, 3418 (2009).
- (21) C.-M. Li, T. Sjodin, and H.-L. Dai, Phys. Rev. B 56, 15252 (1997).
- (22) B. H. Kolner and M. Nazarathy, Opt. Lett. 14, 630 (1989).
- (23) F. Biancalana, A. Amann, A. V. Uskov, and E. P. O’Reilly, Phys. Rev. E 75, 046607 (2007).
- (24) M. A. Foster et al., Nature 456, 81 (2008).