pt \linenumberwidth3pt
Proton and Neutron Irradiation Tests of Readout Electronics of the ATLAS Hadronic Endcap Calorimeter
Abstract
The readout electronics of the ATLAS Hadronic Endcap Calorimeter will have to withstand the about ten times larger radiation environment of the future high-luminosity LHC (HL-LHC) compared to their design values. The GaAs ASIC which comprises the heart of the readout electronics has been exposed to neutron and proton radiation with fluences up to ten times the total expected fluences for ten years of running of the HL-LHC. Neutron tests were performed at the NPI in Řež, Czech Republic, where a proton beam is directed on a thick heavy water target to produce neutrons. The proton irradiation was done with protons at the PROSCAN area of the Proton Irradiation Facility at the PSI in Villigen, Switzerland. In-situ measurements of S-parameters in both tests allow the evaluation of frequency dependent performance parameters – like gain and input impedance – as a function of the fluence. The linearity of the ASIC response has been measured directly in the neutron tests with a triangular input pulse of varying amplitude. The performance measurements and expected performance degradations under HL-LHC conditions are presented.
I Introduction
The electronics for the Hadronic Endcap Calorimeter (HEC) [1] of the ATLAS Experiment [2] has been designed to withstand ten years of operation of the LHC at center-of-mass energies of with peak luminosities of corresponding to an integrated luminosity of . The foreseen upgrade to the high-luminosity version of the LHC (HL-LHC) exceeds these limits by up to an order of magnitude. The expected radiation levels for integrated luminosities of in the region of the amplifier electronics located inside the cryostat of the HEC are for hadrons above , including safety factors of in total to account for simulation uncertainties, while the corresponding number for equivalent neutrons in silicon is , about an order of magnitude larger. The expected total ionization dose (again evaluated for silicon and including the same safety factor of ) is . Proton and neutron irradiation tests have been performed to evaluate the limits of the current readout electronics under HL-LHC conditions.
In addition to the in-situ measurements during the irradiation which took place at room temperature, the neutron irradiated boards were re-measured months after the neutron tests, immersed in liquid nitrogen to simulate the conditions inside the ATLAS endcap cryostat where the readout electronics of the HEC are located.
II Proton Tests
A proton beam of at the Proton Irradiation Facility (PIF) at PSI with a narrow beam profile of and at the position of the devices under test has been used to evaluate the radiation hardness against hadrons up to a fluence of after of beam time. A mount with 14 equidistant slots with a slot spacing of has been placed in the beam line. The boards closest to the beam window housed transistors in SiGe bipolar and Si CMOS FET technology and the GaAs FET based ASICs (BB96) [3]. The BB96 ASICs are currently used in ATLAS for the HEC readout. Slots and were equipped with radiation diodes for dose measurements, and slots with test structures for the HEC power supplies. A picture of the setup prior to final alignment is shown in Figure 1.
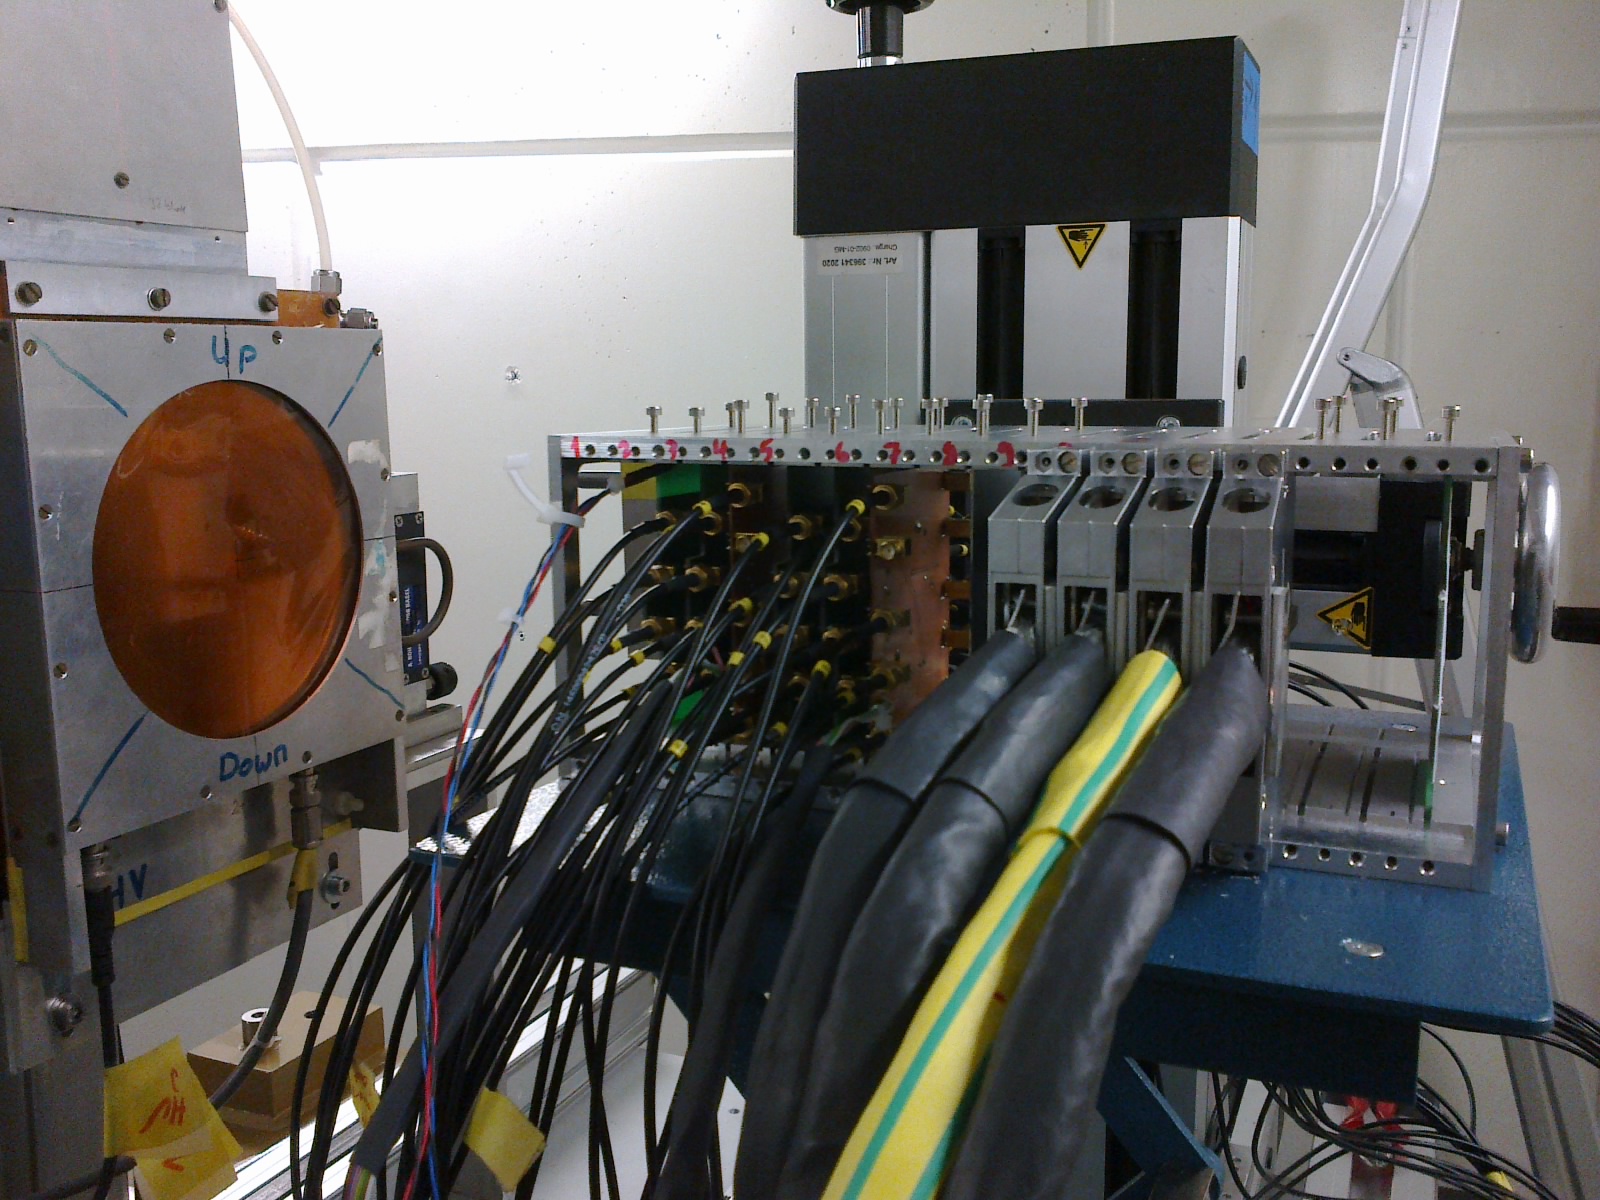
The beam position and width has been measured with sheets of EBT2 radiation film placed for minutes in the beam at different positions. The total beam flux was measured and calibrated by the PIF group with ionization chambers. The raw ionization chamber current measurements in intervals and the conversion factor to the proton beam current was used to calculate the accumulated proton charge as function of time. Together with the beam width and position measurements from the radiation films the fluence for the devices under test in each slot could be derived. The alignment of the setup was done prior to irradiation by means of two lasers indicating the horizontal and vertical planes containing the beam direction. The laser system was however misaligned for the horizontal plane which led to an offset of in , while the positioning of the boards themselves limited the precision in to about . Taking into account the small variations of the beam profile along the beam line, the offset of the beam in , and the expected losses due to nuclear reactions in the devices under test, the flux was found to be the same for all slots.
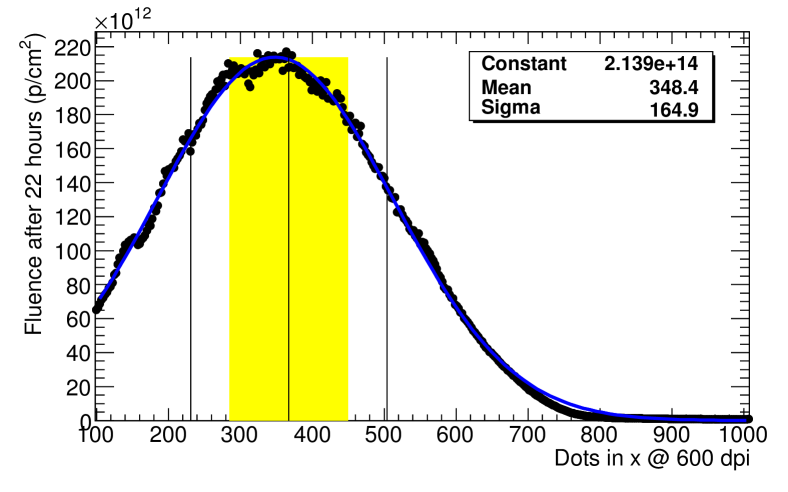
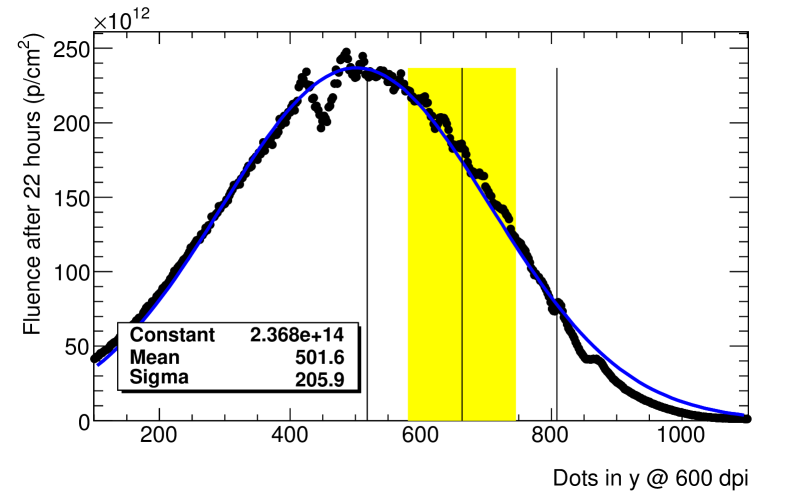
Figure 2 shows the horizontal and vertical profiles of the proton beam as measured by one of the radiation films. Dips in the data distribution are caused by the soldered legs of housings in the upstream slots. The superimposed Gaussian fits show that the profiles are roughly Gaussian in the area of the ASIC.
III Neutron Tests
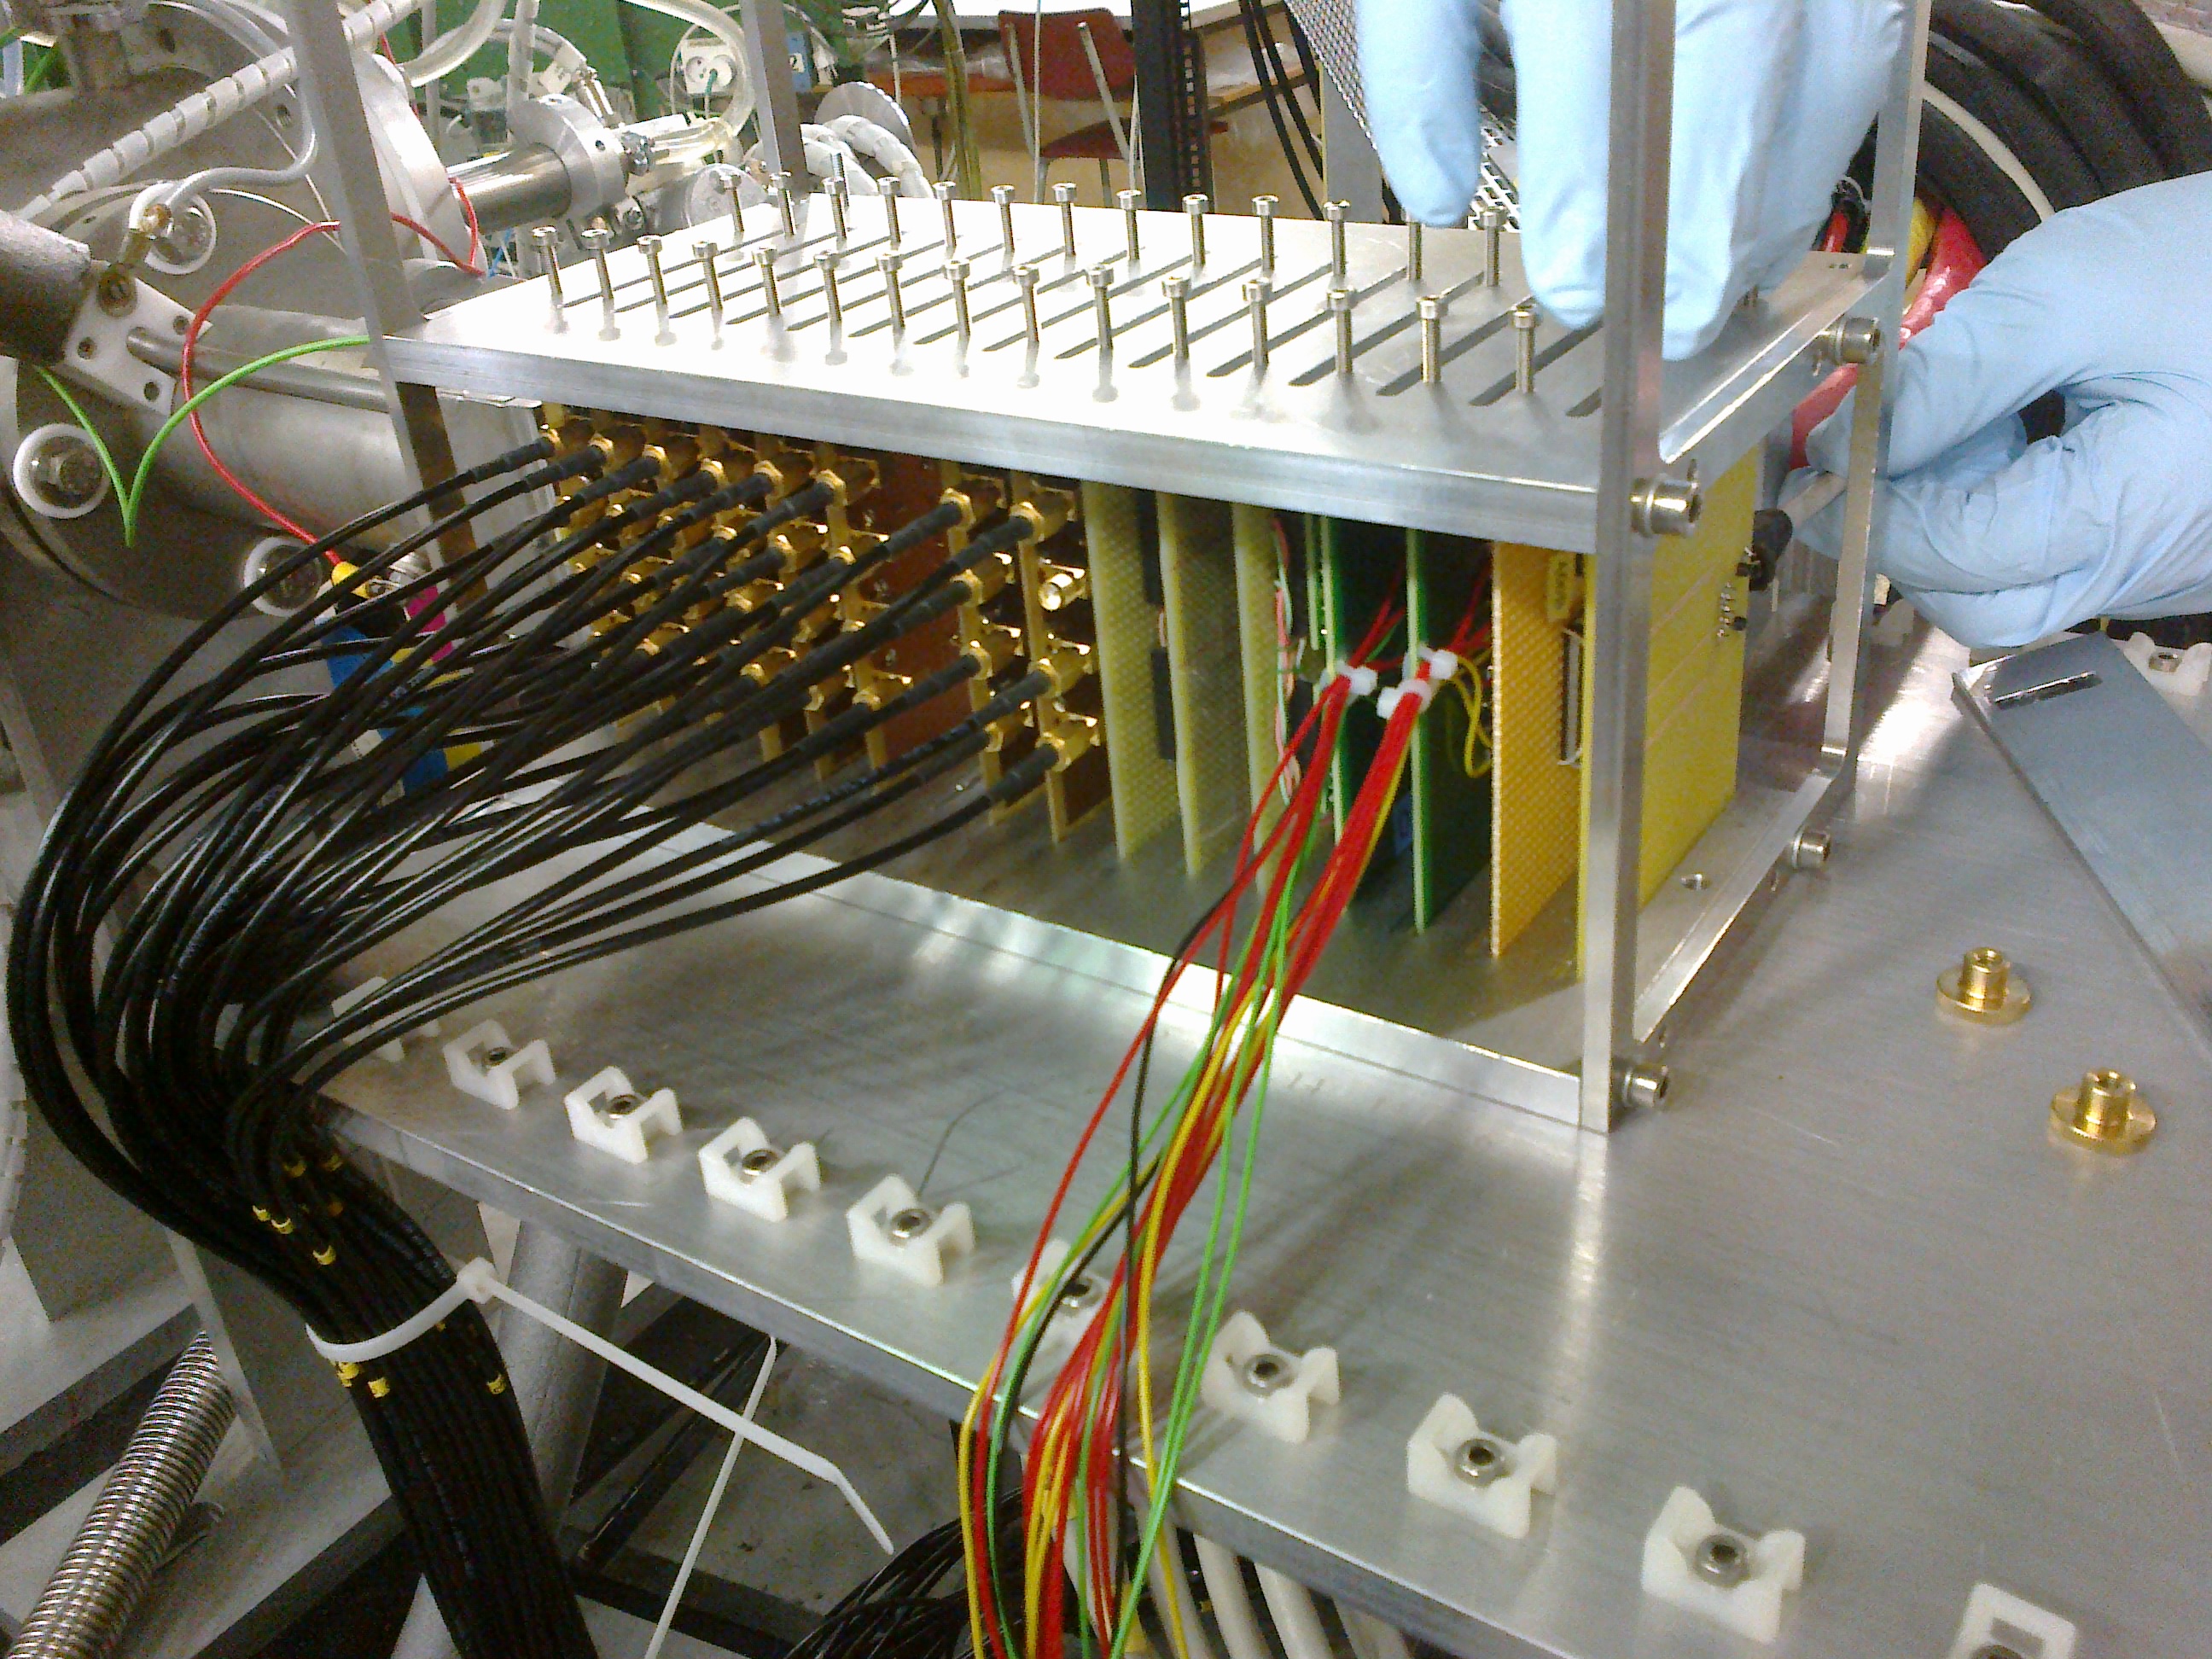
Neutron tests have been performed with a and proton beam of the variable-energy cyclotron U-120 at NPI in Řež hitting a thick target to produce a neutron spectrum with and [4]. Similar to the setup in the proton test, equidistant slots with distances of between adjacent board centers have been equipped and placed in front of the steel plate enclosing the target. The alignment was done prior to mounting the target and the test boards by burning small holes with the proton beam in two calibration boards placed instead of the test structures in the first and last slot. Slots 1–6, 8, and 9 were equipped with the BB96 GaAs ASICs, slots 7 and 11 with radiation diodes and activation foils and the remaining slots with test structures for the HEC power supplies. The setup is shown in Figure 3.
The total collected proton charge in the test was . The neutron flux profile has been measured with sheets of EBT2 radiation film placed for minutes at a reduced machine current of in front of slot 1 and behind all other slots with the exception of slots 7,10, and 11. During a dedicated fluence test run in 2010 with radiation monitors in each slot the following empirical relation of the equivalent neutron fluence in silicon and the machine current as function of the slot number has been found [5]:
| (1) |
where slot is the slot-number (1-16), offset is the distance of the first slot from the target () and the positions are known with precision.
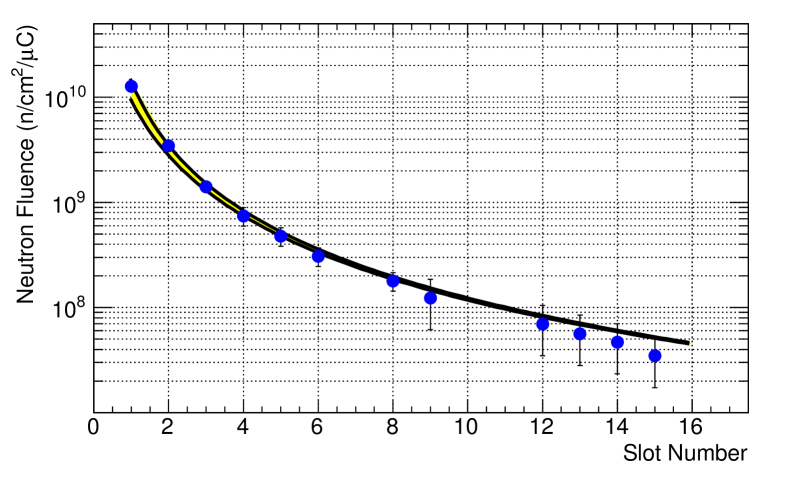
Figure 4 shows this fluence curve superimposed by the relative fluence measurements from the radiation films, normalized to the expected fluence in slot 3.
IV S-Parameter Measurements
During the irradiation the scattering parameters (S-parameters) of the BB96 ASICs have been continuously measured to study their performance as a function of the fluence up the maximum value at the end of the irradiation. The S-parameters have been measured for the frequency range to with a vector network analyzer (VNA) connected via long cables to the devices under test. Each cable pair has been individually de-embedded with the VNA calibration utility moving the plane of calibration to the input connectors of the boards. The most important parameters are the input port reflection coefficient , which can be translated into the input impedance , for our case of vanishing feedback coefficient and low load reflection, and the forward transmission coefficient . The product of the two gives the transimpedance gain in the frequency domain. This can be interpreted as the input current to output voltage signal amplification. It was found that the effect of protons in the GaAs ASICs is similar to that of neutrons with times larger fluence. Since the expected ratio of neutron to proton fluence for the HL-LHC is , the neutron tests provide the most limiting numbers.
V Pulse Measurements
In the neutron test triangular voltage pulses similar to the ionization currents in the LAr gaps in ATLAS with different amplitudes between and and pulse lengths of have been applied over the cables at the BB96 ASICs and both the input and the output pulse have been measured with an oscilloscope (the output pulse again after cable). These measurements were done alternatingly with the S-parameter measurements and provide a more direct way of studying the performance of the electronics. Good agreement with the S-parameter measurements was found for the gain as a function of neutron fluence. The largest expected ionization currents in ATLAS are for a single pre-amplifier and about for a full chain of several pre-amplifiers and one summing amplifier. Up to these values the linearity of the pre-amplifiers and the full system was measured with the pulses. To convert from input voltage pulses to currents the input impedance and cable damping is taken into account. Thus the voltage range of to corresponds to an input current range of to for non-irradiated chips.
VI Warm In-situ Results
The forward transmission coefficient normalized to the value before irradiation and evaluated in the frequency range of the shaper electronics in ATLAS () as measured in situ for the full systems consisting of one pre-amplifier and a summing amplifier during the proton and neutron irradiations is shown in Figure 5 as function of the proton and equivalent neutron fluence in silicon.
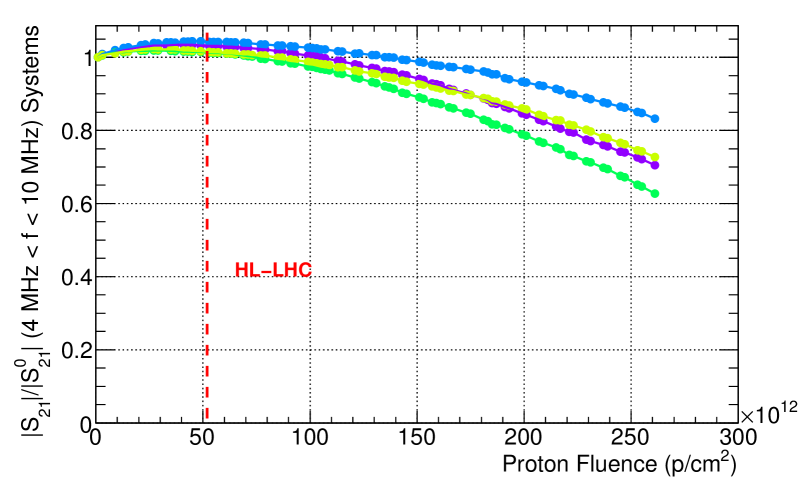
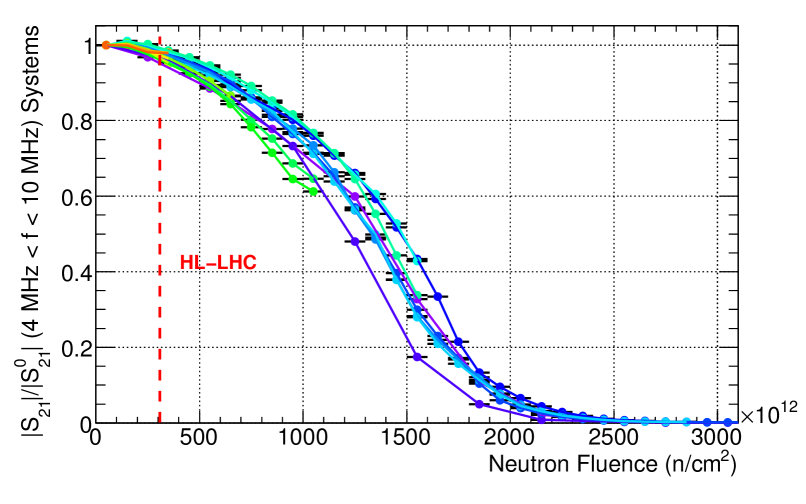
Figure 5 shows that the device-to-device fluctuations increase with irradiation and that the effect of protons is about times larger on the voltage gain compared to that of neutrons at the same fluence values. Input impedances were found to stay close to and real throughout the entire irradiation range for protons and up to for neutrons. The output impedance shows similar behavior and stays roughly twice as long close to . Beyond these limits the impedances stay real but rise quickly resulting in non-matched conditions in ATLAS, where cables connect the detector and the pre-amplifiers and cables carry the signals from the ASIC output to the shaper electronics.
VII Cold Results
About three months after the neutron irradiation tests at NPI in Řež the irradiated boards have been shipped to the lab in Munich and re-tested with the same set of measurements as in situ in both warm and cold (liquid nitrogen) conditions. The three front-most boards received neutron fluences in excess of (Si eq. in Řež). From Figure 5 it can be seen that beyond the ASICs approach voltage gain and therefore the three first boards are dead. The board in the fourth slot was exposed to and this one plus the following four boards from slots 5,6,8, and 9, with respective fluences of , , , and are still operational in warm conditions and still show the same performance as was measured at the end of the run in situ at Řež. In addition to these 5 fluence points non-irradiated ASICs have been measured in warm and cold as well to provide data at zero fluence.
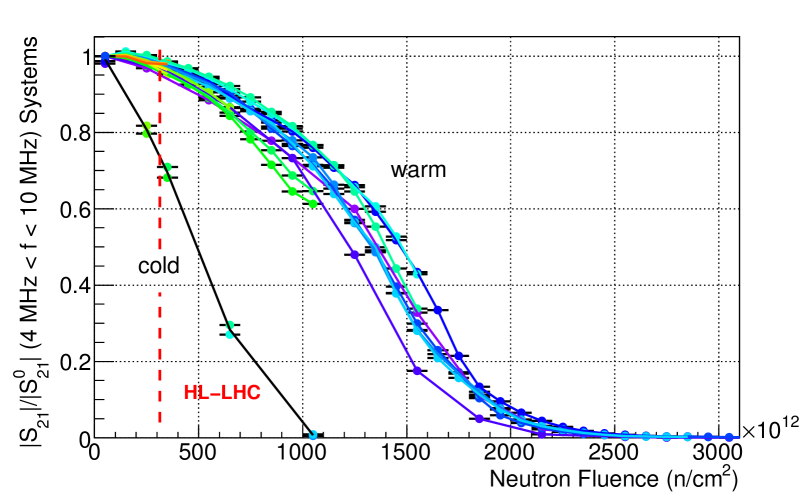
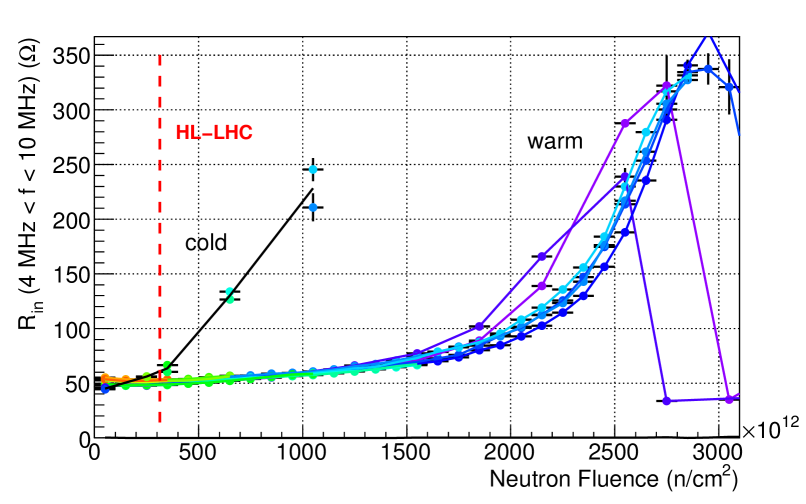
Immersed in liquid nitrogen to emulate the conditions inside the ATLAS cryostat the performance is dramatically worse than in warm conditions. Figure 6 shows the normalized forward transmission coefficient and the input impedance for the systems comprised of one pre-amplifier and a summing amplifier as function of neutron fluence for both warm and cold conditions. The sparse data points on the left indicate the cold measurements, while the denser groups of points extending to larger fluences are the measurements in the warm. The performance in the cold is roughly equivalent to that in warm at times larger fluences. The performance degrades quickly beyond .
The pulse measurements as described in section V have also been repeated with the already irradiated boards in warm and in cold. The pulse amplitudes have been adjusted to lower levels to still correspond to input currents for non-irradiated ASICs for the short () cables used at MPP. The increase of non-linearity of the response was found to be described by a power-law relation of input (in) and output (out) amplitude of the form:
| (2) |
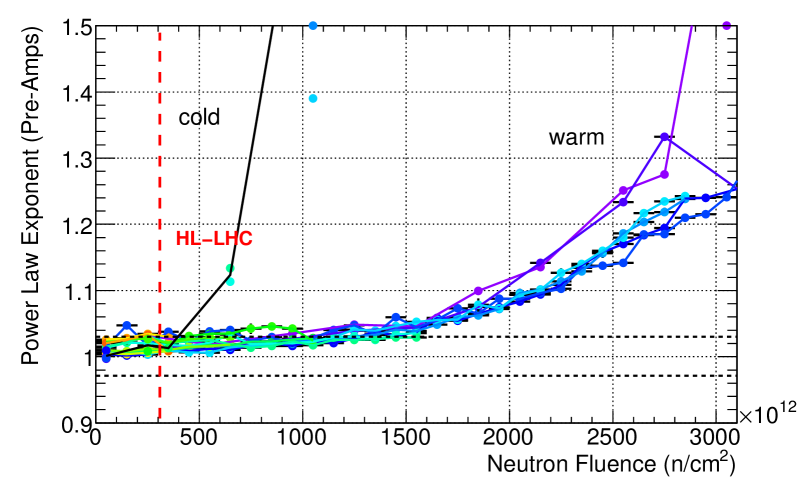
where is a fluence dependent constant and the power-law exponent. Values for deviating from indicate non-linear behavior.
Figure 7 shows this exponent as function of neutron fluence in warm and cold. Like in the case of the forward transmission coefficient the non-linearities for irradiated ASICs are worse in the cold and correspond roughly to those in the warm at times larger fluences. Since up to pre-amplifiers are summed by one summing amplifier in ATLAS the non-linearities for the pre-amplifiers can not be corrected. An exponent of or would correspond to a maximum deviation of the output amplitude from linear expectation normalized to the maximum amplitude of . This original requirement limit for the non-linearity of the pre-amplifiers is indicated by the horizontal lines in Figure 7. Beyond neutron fluences of the non-linearity quickly rises above this level.
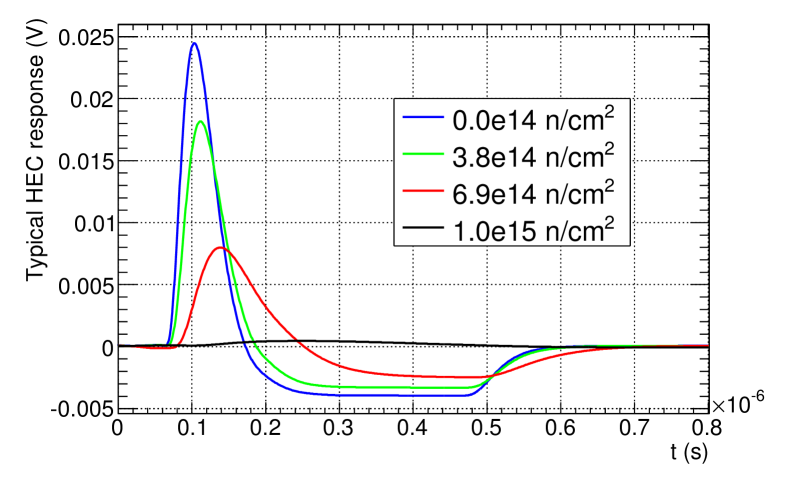
The degraded S-parameter measurements in the full frequency range of have been used to predict the response to a typical ionization signal in the HEC after the full electronics chain for the HEC in ATLAS [6]. Figure 8 shows the simulated response to a triangular current in a typical HEC channel at 4 different fluence values. It can be seen that on top of the gain degradation the pulse shape worsens with increasing fluence leading to a slower rise- and fall-time, a broader and more delayed positive peak.
VIII Fluence Conversion for GaAs
The neutron fluence values given in all the figures presented so far are equivalent fluences evaluated for the neutron spectrum at NPI in Řež [4]. In order to compare these values to expectations for the HL-LHC the fluences have to be converted for the GaAs devices studied here first to the corresponding equivalent fluence in GaAs using the NPI neutron spectrum and the Kerma factor for neutrons in silicon and gallium-arsenide [7]. In a second step using the expected neutron, proton and pion spectra in ATLAS [8] the equivalent neutron fluence in GaAs has to be converted back to Si again using Kerma factors for the relevant radiation in both Si and GaAs. It was found that the conversion from Si to GaAs at NPI energies is and from GaAs to Si at the location of the ASICs in ATLAS . All measured neutron fluences at NPI reported here can thus be converted to ATLAS expectations by multiplying with .
The proton-irradiated boards were not retrievable from PSI and thus cold measurements of the proton irradiated ASICs are not available. Assuming that
-
1.
the results in the cold would be worse compared to the warm in-situ measurements by the same factor of as observed in the neutron tests
-
2.
the effect of with kinetic energy of in GaAs according to the Kerma factor and specific energy loss [9] can be split in equivalent neutron fluence in GaAs and total ionization dose (TID)
it is possible to convert the GaAs numbers back to Si again and estimate the impact of the expected Si TID of in ATLAS at the HL-LHC, which would be equivalent to of the expected degradation due to equivalent neutrons.
IX Conclusions
Irradiation tests of the current readout electronics of the Hadronic Endcap Calorimeter of ATLAS with neutrons and protons with fluence levels exceeding those relevant for the high luminosity upgrade of the LHC have been performed. The most stringent limits have been observed under neutron irradiation and the measurements at liquid nitrogen temperatures show a times faster performance degradation compared to room temperature measurements.
The performance limit in the cold was reached at equivalent in Si for neutrons in Řež, where the forward transmission coefficient reduces to , the input (output) impedance increases by () above the nominal , and the power-law exponent reaches . These levels correspond to equivalent in Si for ATLAS at the position of the ASICs.
With the current safety factor of for the radiation level simulations for ATLAS this limit will be reached at the HL-LHC. The impact on the ATLAS physics performance of the degraded electronics and upgrade options of the readout electronics for the HL-LHC are currently under study.
References
- [1] D. M. Gingrich et al., Construction, assembly and testing of the ATLAS hadronic end-cap calorimeter, JINST 2 P05005 (2007).
- [2] The ATLAS Collaboration, The ATLAS Experiment at the CERN Large Hadron Collider, JINST 3 S08003 (2008).
- [3] J. Ban et al., Cold Electronics for the Liquid Argon Hadronic End-cap Calorimeter of ATLAS, Nucl. Instr.& Meth. A556, 158-168 (2006).
- [4] P. Bém et al., The NPI cyclotron-based fast neutron facility, International Conference on Nuclear Data for Science and Technology 2007, 555-558, http://dx.doi.org/10.1051/ndata:07598 (2007).
- [5] D. Dannheim, n-flux measurement Řež irradiation April 2010, http://indico.mppmu.mpg.de/indico/getFile.py/access?contribId=3&resId =1&materialId=slides&confId=834 (2010).
- [6] L. Kurchaninow, Modeling of the HEC Electronics Chain, ATLAS HEC-Note-109 (2001).
- [7] A. Vasilescu and G. Lindstroem, Displacement damage in silicon, on-line compilation, http://sesam.desy.de/members/gunnar/Si-dfuncs.html, P.J. Griffin et al., SAND92-0094 (1993), A. Konobeyev, J. Nucl. Mater. 186,117 (1992), G.P. Summers et al., IEEE NS 40, 1372 (1993), M. Huhtinen and P.A. Aarnio, Nucl. Instr.& Meth. A335, 580 (1993), A.M. Ougouag et al., IEEE NS 31, 2219 (1990), A.L. Barry et al., IEEE NS 42, 2104 (1995).
- [8] S. Baranov et al., Estimation of Radiation Background, Impact on Detectors, Activation and Shielding Optimization in ATLAS, ATL-GEN-2005-001 (2005).
- [9] J. Beringer et al. (Particle Data Group), 2012 Review of Particle Physics, Phys. Rev. D86, 010001 (2012).