PAndAS in the mist: The stellar and gaseous mass
within the halos of M31 and M33
Abstract
Large scale surveys of the prominent members of the Local Group have provided compelling evidence for the hierarchical formation of massive galaxies, revealing a wealth of substructure that is thought to be the debris from ancient and on-going accretion events. In this paper, we compare two extant surveys of the M31-M33 subgroup of galaxies; the Pan-Andromeda Archaeological Survey (PAndAS) of the stellar structure, and a combination of observations of the H I gaseous content, detected at 21cm. Our key finding is a marked lack of spatial correlation between these two components on all scales, with only a few potential overlaps between stars and gas. The paucity of spatial correlation significantly restricts the analysis of kinematic correlations, although there does appear to the H I kinematically associated with the Giant Stellar Stream where it passes the disk of M31. These results demonstrate that that different processes must significantly influence the dynamical evolution of the stellar and H I components of substructures, such as ram pressure driving gas away from a purely gravitational path. Detailed modelling of the offset between the stellar and gaseous substructure will provide a determination of the properties of the gaseous halo of M31 and M33.
Subject headings:
galaxies: abundances, galaxies: dwarf, galaxies: kinematics and dynamics, Local Group, dark matter1. Introduction
In CDM cosmologies, galactic halos are built up over time through the accretion and cannibalisation of smaller mass systems. Given the complexity of the dynamical interactions, these are studied in detail using computer simulations (e.g. Ibata & Lewis, 1998; Fardal et al., 2008), although, due to the difficulties in modelling baryonic physics, these typically only consider the evolution of dark matter. However, these predict that the outer region of galactic halos should be dominated by extensive tidal streams, whereas the shorter dynamical time scales of the inner halo result in complete destruction and a smooth stellar distribution (e.g. Bullock & Johnston, 2005; Cooper et al., 2010; Font et al., 2011).
The progenitors of substructure could possess a mix of stars and gas, generally more concentrated than the dark matter halos in which they reside. The precise composition of any in-falling halo will depend upon its mass and evolutionary history, and we would expect dwarf galaxies to be stripped of their gas due to interactions within the Local Group, whereas larger galaxies will hold-on to its gaseous component. While stars are effectively collisionless, more complex internal physics influences the evolution of gas, including internal shocking, cooling and collapse, star formation and its associated feedback, as well as ram-pressure stripping due to the presence of hot galactic halo gas (e.g. see Moore & Davis, 1994; Murakami & Babul, 1999; Bekki, 2008; Mastropietro et al., 2009). This is quite apparent in the two major accretion events within the Milky Way halo, with the body and stream of the Sagittarius Dwarf Galaxy possessing no gas, having potentially lost it during its initial interaction with the Galaxy (Burton & Lockman 1999, but see also Putman et al. 2004), while the Magellanic Stream appears to be completely devoid of stars, consisting of stripped gas, although the question of whether this is the result of tidal or ram pressure forces has yet to be decided (Stanimirović et al., 2008; Besla et al., 2010; Diaz & Bekki, 2011). However, while we should expect different distributions for various disrupted components in M31 and M33, the complexities of ram-pressure stripping, which may require full magneto-hydrodynamic approaches to simulate (Ruszkowski et al., 2012), makes drawing robust conclusions difficult.
We are now in an era where large scale surveys are providing a global picture of the formation and evolution of galaxies over cosmic time (e.g. see Abraham & van den Bergh, 2001). Given their distances, unraveling the fine details of galactic evolution is below the resolution achievable with the vast majority of galaxies in the Universe. This is unfortunate, as it is on small scales, with the structure within the halos of large galaxies, that have presented the major challenge to the prevailing CDM paradigm (e.g. the missing satellite problem; Klypin et al., 1999; Moore et al., 1999).
Luckily, the large members of the Local Group, the Milky Way, the Andromeda (M31) and Triangulum (M33) galaxies, are close enough for such fine scale detail to be resolvable, although their immense angular scale presents a significant challenge to the observability of their extensive halos. To this end, the last decade has seen the advent of large, detailed surveys of both the stellar and gaseous components of Local Group members, for the first time providing a panoramic view of galaxy formation in action; for the Milky Way, this includes surveys such as RAVE (Siebert et al., 2011), SEGUE (de Jong et al., 2010), GASS (McClure-Griffiths et al., 2009) and others.
In this paper, we present a detailed comparison of the stellar and gaseous matter in the halos of our nearest large companions in the Local Group, M31 and M33, using a new map of stellar structure obtained through the Pan-Andromeda Archaeological Survey (PAndAS) and the most detailed maps of H I, obtained during several telescope campaigns. In Section 2, we outline the observational campaigns that resulted in the data presented, with a summary of their key scientific results. In Section 3 we compare the spatial and kinematic distributions of gaseous and stellar substructure. We present the interpretation of these correlations in Section 4 and our conclusions in Section 5.
2. Observations & Properties
Some galaxies of the Local Group have been known since pre-history (e.g. see Section 3.1 of Geehan et al., 2006)111 Given its proximity, M31 is one of the few galaxies visible to the naked eyes. Its existence was first documented by the Persian astronomer Abd al-Rahman Al-Sufi in his treatise on stellar astronomy titled Kitab al-Kawatib al-Thabit al-Musawwar (Book on the Constellations of the Fixed Stars), published in AD 964, where he both identified its position in the sky and summarized his observations., and have played a pivotal role in our explorations of the workings of the Universe. Reproducing a detailed account of this history is beyond the scope of this article, and the interested reader is directed to recent reviews (e.g. Tolstoy et al., 2009; Wyse, 2010; Tolstoy, 2011; McConnachie et al., 2012a). In the following we will focus upon the recent optical and radio surveys of M31 and M33, with a review of the observational programs and key scientific discoveries to date.
2.1. Stellar Observations
2.1.1 Observational Program
The Pan-Andromeda Archaeological Survey (PAndAS) is a survey of 400 square degrees, covering the halo of M31 out to a distance of , and M33 to a corresponding distance of , undertaken as a large program on MegaCam222cfht.hawaii.edu/Instruments/Imaging/Megacam, mounted on the 3.6-m Canada-France-Hawaii Telescope (CFHT). Integrations were sufficient to achieve photometric limits and at a , reaching several magnitudes below the tip of the Red Giant Branch (RGB) at the distance of M31/M33 (D; Conn et al., 2011)333In the following, we adopt the distances and , each with an uncertainty of , as derived by Conn et al. (2012).. The photometric data-taking was completed in early 2011, with the first published map, covering roughly half of the total observed area, presented in McConnachie et al. (2009), with the (almost) entire dataset first presented in Richardson et al. (2011). The final map and high level data products will be made publicly available in a forthcoming publication (McConnachie et al., 2012a, 2013).
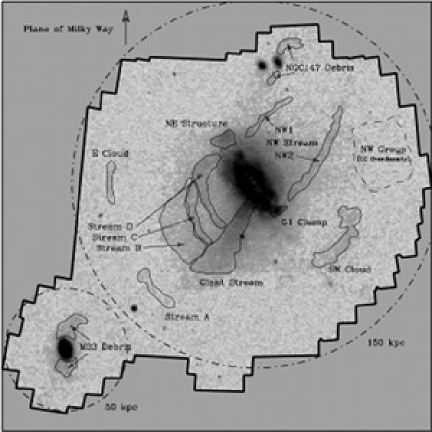
This study focuses upon Red Giant Branch (RGB) stars at the distance of M31 and M33, selected with cuts in color and magnitude (see Ibata et al., 2001, 2007; McConnachie et al., 2009). Figure 1 presents the distribution of RGB stars, overlain by a schematic map of the prominent stellar substructure; note that a non-linear scaling has been applied to the RGB density, to bring out faint substructure, and contains a broad swath of metallicities to reveal metal-poor , intermediate and metal-rich substructure (c.f. Ibata et al., 2007). The thick solid line is the entire PAndAS footprint, with stellar substructure as labelled thin solid lines. The dashed curve represents a significant over-density of globular clusters identified as the NW Group by Mackey et al. (2010). The large dot-dashed line corresponds to a circle of radius of from the center of M31, whereas the smaller dot-dashed circle represents a distance of from the center of M33. It is very apparent that accompanying M31 and M33 is a wealth of substructure consisting of extensive streams and dwarf galaxies [these will be discussed in more detail in Section 2.1.2, and see Richardson et al. (2011)].
The stellar catalog derived from PAndAS is built upon earlier observations with the CFHT/MegaCam & CHFT/CFH12k (see McConnachie et al., 2003; Ibata et al., 2007). In parallel, a number of fields, targeting prominent substructure and dwarfs, were targeted with DEIMOS (Faber et al., 2003) on the 10m Keck-II Telescope (e.g. Chapman et al., 2008; Collins et al., 2011). With a moderate resolution (), observations of 60-90 mins around the prominent CaT absorption lines resulted in a S/N for targets of , with a corresponding velocity resolution of ; these will be described in more detail in Section 3.2.
2.1.2 Stellar Properties
Detailed analysis of the stellar substructure in PAndAS will be presented in Ibata et al. (2012) and McConnachie et al. (2013), so here we focus on the key features.
There is a wealth of substructure apparent in the outer disk/inner halo regions of M31, revealed in the earlier Wide Field Camera on the 2.5-m Isaac Newton Telescope survey of the galaxy (Ibata et al., 2001; Richardson et al., 2008, & see Figure 1), with the most significant structure being an extensive stellar stream, the Giant Stellar Stream (GSS), in the halo of M31. This is seen as a metal-rich substructure wrapped within a more metal-poor halo, and is apparently wraps around the disk of M31 in the north-east (e.g. Ferguson et al., 2002; Ibata et al., 2007; Fardal et al., 2012).
Accompanying the GSS is a series of streams, labelled , and , which lie perpendicular to the Giant Stream (Ibata et al., 2007), plus Stream A, a stellar over-density (in projection) from M31. Further features include the South West (SW) Cloud and the North West (NW) Stream (McConnachie et al., 2009; Mackey et al., 2010). As revealed in Figure 1, and as shown by Richardson et al. (2011), this latter feature appears to loop back towards M31 as the North East (NE) Stream, and intercepts the And XXVII dwarf galaxy; following Carlberg et al. (2011), we identify this entire feature as the North West Stream, and label the two components of it as NW1 and NW2. Finally, also apparent in this image is another significant over-density of stars, named the Eastern (E) Cloud, located a distance of from M31.
As well as the extensive substructure, the PAndAS observations revealed the presence of a smooth stellar halo of M31 out to (Ibata et al. 2007; see also the SPLASH characterisation of the smooth halo by Gilbert et al. 2012). Furthermore, the data reveals a wealth of dwarf galaxies (e.g. Martin et al., 2006, 2007; Richardson et al., 2011), globular clusters and extended clusters (Huxor et al., 2008; Cockcroft et al., 2011; Huxor et al., 2011; Tanvir et al., 2012); while these extended clusters (ECs) are more diffuse than normal globular clusters (Huxor et al., 2005), they appear to have very similar stellar populations (Mackey et al., 2006, 2007), and do not appear to be dominated by dark matter (Collins et al., 2009).
The structure around M33, apparent as a distorted outer disk, was originally presented by McConnachie et al. (2009, 2010). This structure is quite clearly asymmetric about M33, being significantly more prominent in the north than in the south.
The extension of the PAndAS survey towards to north of M31, in the region of the two satellite galaxies, NGC147 and NGC185, reveals the presence of stellar debris that appears to have been torn from NGC147, as well as a new dwarf galaxy, Cass II (also known as And XXX), which is a potential satellite of the 147/185 subgroup, and will be discussed in more detail in a forthcoming publication (Irwin et al., 2012).
2.2. H I Observations
2.2.1 Observational Program
The extended environment of M31 and M33 was observed by Braun & Thilker (2004) using the Westerbork Synthesis Radio Telescope (WSRT) as fourteen single dish telescopes. A region of in RADec was imaged in the H I emission line at an effective resolution of 49 arcmin with an RMS sensitivity corresponding to a column density of cm-2 over . This unprecedented sensitivity permitted detection of H I in emission from column densities that have previously only been probed by Ly absorption toward background QSOs. This low resolution survey has been supplemented by higher resolution total power observations made with the Green Bank Telescope (GBT). A region covering centered on M31 and centered on M33 was observed with GBT during 2002 October with multiple perpendicularly scanned coverages yielding images with angular resolution as high as 9 arcmin. The M31 data have been presented previously by Thilker et al. (2004), while the M33 data were obtained with the same setup and have been reduced in a similar fashion. These moderate resolution data are supplemented with interferometric mosaic observations consisting of a 163 pointing WSRT coverage of M31 (Braun et al., 2009) and Very Large Array (VLA) coverage of M33 consisting of 6 pointings in the B and CS configurations and a 20 pointing mosaic in the D configuration. Some early M33 results based on the B and CS configuration data were presented in Thilker et al. (2002) while an independent reduction of all three VLA configurations has been presented by Gratier et al. (2010). The interferometric data provides resolution as high as 15 arcsec in M31 and as high as 5 arcsec in M33.
2.2.2 H I Properties
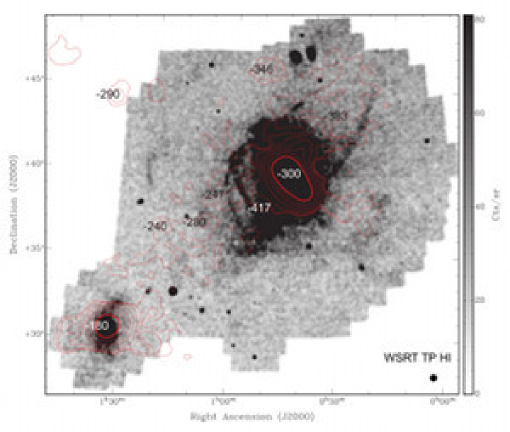
The H I distribution in the extended M31 and M33 environment is overlain as contours on the surface density of RGB stars in the PAndAS survey in Figure 2. The H I contours delineate the diffuse gaseous filament that connects M31 and M33 as well as other filamentary features extending both to the northwest of the M31 disk and to the southwest. Heliocentric radial velocities of various features are indicated with the annotations. The intrinsically diffuse nature of these features has been verified with follow-up observations using the GBT directed at the brightest positions along the M31-M33 filament (Braun & Thilker, 2004). Despite employing a 25 times smaller beam area in these GBT observations, the features were detected at the same low column densities of only a few times cm-2. This rules out the possibility that the filament is simply a collection of unresolved clumps in the discovery observations. Several discrete features are also seen in the northern portion of the field. It is noteworthy that the M31-M33 filament connects the systemic heliocentric velocities of M31 () and M33 ().
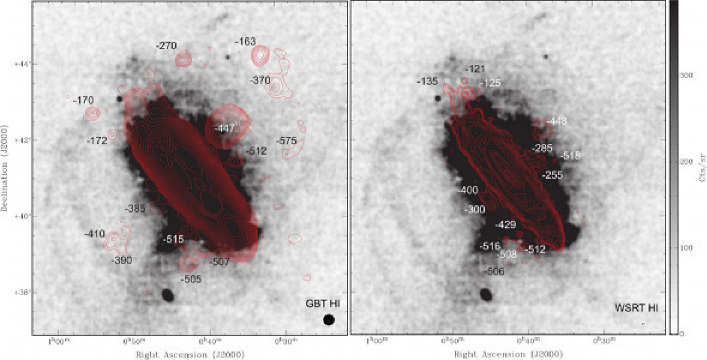
The more immediate H I environment of M31 is illustrated in Figure 3 where the GBT image (left-hand panel) and WSRT mosaic (right-hand panel) are similarly overlain on the PAndAS survey. At these higher angular resolutions, of 18 and 4 arcmin respectively, much of the diffuse gas is not detected but rather only the discrete High Velocity Cloud (HVC) features within about of the disk. Of note is that the radial velocity of discrete HVC features follows the basic pattern of disk rotation with the most negative velocities occurring in the southwest and most positive in the north-east.
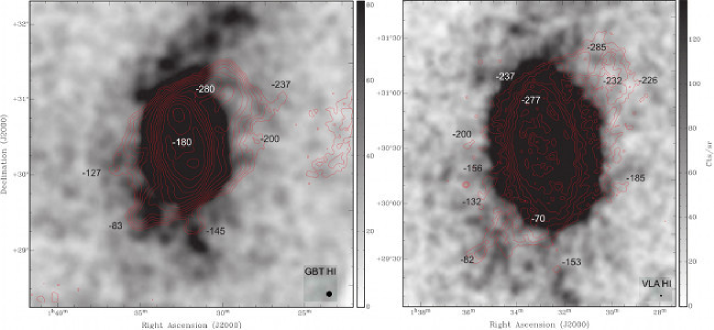
The immediate gaseous environment of M33 is illustrated in Figure 4 where the GBT image at 9 arcmin resolution (left-hand panel) and the VLA mosaic with 2 arcmin resolution (right-hand panel) are overlain on the the PAndAS survey. M33 is not as rich in discrete HVC features as M31 but rather displays a very strong clumpy warp of the outer H I disk oriented toward the northwest and southeast, strongly suggestive of accretion fuelling of the M33 disk by fall-back from the M31-M33 filament.
3. Correlations
3.1. Spatial Correlations
3.1.1 The disk & halo of M31
Firstly, we consider the large scale distribution of RGB stars and H I gas presented in Figure 2, focusing upon material in the vicinity of M31. Leaving aside the inner disk region, which will be examined in detail shortly, it is useful to consider material along the NW axis, connecting M31 and M33, and that which lies off this axis in the the halo of M31.
It is clear that that the eastern portion of the halo possesses one substantial stellar substructure, namely the Eastern Cloud, as well as a number of dwarf galaxies (see Richardson et al., 2011). This section of the halo is effectively devoid of a substantial quantity of H I material, except for a lone clump located to the far north, and some lower level material closer to the disk of M31, with no significant enhancement in the vicinity of any of the dwarf galaxies. Hence, there appears to be no substantive correlation between the stellar and gaseous material in this area of the halo.
The situation is very similar in the western halo, with a one extensive stellar substructure, the SW Cloud, and a population of dwarf galaxies, and some potential, but low level, substructure features. Note that Mackey et al. (2010) also identified a potential over-density of globular clusters, the NW Group, which is not associated with an over-density in the stellar density (see Figure 1). Again, this area is almost devoid of significant H I detections, other than a large spur at to the major axis, extending from the center of M31. Again, there is apparently little stellar substructure along the length of this gaseous spur, except at its tip where it overlies a portion of the SW Cloud. The physical implications of this association will be discussed in Section 4.
The most conspicuous stellar and gaseous substructures lie along the NW-axis, along the line joining M31 and M33. In the region south of M31, there is significant stellar substructure in the form of the GSS, and perpendicular steams, B, C & D, close to the outer disk of M31, and the distant stream A. The gas in this region is significantly more extended, lying all along the axis. There is no significant overlap of H I with the GSS, with the gaseous material extending from the disk of M31 over the inner stream fields and towards M33. Significant H I also extends northwards from the disk of M31, over the region encompassing the NW stream, although the gaseous material is more extensively spread than the stellar substructure in this area.
The two panels in Figure 3 zoom in to the outer disk region of M31, overlain with H I at the two resolutions discussed earlier. While the GSS and Stream C are apparent as stellar substructures, with Stream B stretching back towards M31, there appears to be no significant correlation between the stellar material, and H I gas. Intriguingly, there is some H I emission, apparent as population of distinct clouds, aligned with the Giant Stellar Stream, but offset by ; as will be discussed in Section 3.2.1, this emission is also kinematically correlated with the GSS (see Braun et al., 2009).
Clearly, the H I associated with the stellar disk possesses similar distortions to the underlying stars, including a Northern Spur, located in the outer disk of M31 (close to the NE Structure in Figure 1, see also Figure 1 in Richardson et al. (2008)) and a potential over-density near the G1-clump; however, it is difficult to discern whether either the stellar or gaseous material has recently been accreted or is actually disk material that has been tidally distorted due to interactions (Ibata et al., 2005; Faria et al., 2007).
3.1.2 The disk & halo of M33
At the resolution provided by the Braun & Thilker (2004, Figure 2), the H I emission from M33 is seen to be quite extensive and orientated E-W across the galaxy. The stellar substructure, on the other hand, lies mainly on the NW-axis, joining the disk of M33 at the northern tip of the galaxy.
The situation becomes clearer in Figure 4, which focuses upon the stellar distribution of M33 overlain with H I emission seen with the GBT (left-hand panel) and VLA (right-hand panel) (Thilker et al., 2004, 2002). The striking feature in both the H I and stellar material is the substantial stream pointing towards the NW, as well as a less pronounced component in the SE; this extended H I emission was discussed by Putman et al. (2009), with the conclusion that it results from the tidal interaction between M33 and M31. A similar conclusion with regards to the stellar component was reached by McConnachie et al. (2009), also presenting a numerical model for the tidal interaction of the two galaxies which results in a consistent stellar feature. However, while the stellar and gaseous material possess a similar alignment, they are distinct spatially, with the majority of the gas streaming from the Western edge of M33, whereas the stellar material streams from the Northern tip of the galaxy. Furthermore, while both the Northern and Southern stellar and gaseous components are asymmetrical, it is apparent that the stellar component possesses a much more pronounced asymmetry.
3.2. Kinematic Correlations
While the radio observations provide a global picture of velocities, the nature of multi-object optical spectroscopy ensures that the stellar kinematics are determined in a series of discrete fields. As well as the parallel kinematic survey undertaken by members of the PAndAS team (e.g. Ibata et al., 2004), significant effort has been undertaken by other groups (e.g. the SPLASH survey Kalirai et al., 2009; Gilbert et al., 2009; Kalirai et al., 2010). However, the general lack of distinct spatial correlations (see Section 3.1) means that direct comparison of kinematics at specific locations is not possible, and only a general comparison can be undertaken.
3.2.1 The disk & halo of M31
The most prominent stellar feature in the halo of M31 is the GSS, lying close to the (3-D) distance where it meets the spiral disk, sweeping backwards to over behind (Ibata et al., 2001; McConnachie et al., 2003; Fardal et al., 2012). A stellar kinematic survey of the GSS shows a strong velocity gradient (Ibata et al., 2004); the most distant tip of the stream, 4.5 degrees away from M31’s disk, have velocities of 444In the following, refers to heliocentric velocities, whereas is relative to M31, placing it essentially at rest with regards to M31, while those approaching the disk are travelling at (). While there is no apparent gas associated with the extent of the GSS (Section 3.1), there is significant parallel H I emission. This gas possesses a strong velocity gradient, but different to that of the Giant Stellar Stream (Figure 2); close to the M31 disk, the gas is moving close to systemic velocity of M31, whereas away from the disk, the velocity becomes more positive. The velocity gradient bridges the systemic velocities of M31 and M33, demonstrating a direct connection and common origin.
North of M31, along the M31-M33 axis, there is significant H I emission which seemingly overlaps with North-Western Stream. The velocity of the H I () appears to be a continuation of the gaseous stream connecting the two galaxies. Presently, there are no velocities of the stellar structure in this region, and so it is difficult to comment on any putative connection, although the numerical models suggest that these features are unrelated (Bekki, 2008; McConnachie et al., 2009).
Figure 3 reveals the kinematic structure of the H I in the outer disk and inner halo of M31, where is an enhancement of H I close to, but not completely aligned where the GSS meets the disk of M31 (Section 3.1.1). Intriguingly, while offset spatially, this gas is moving at , similar to the velocity of the stellar content of the GSS, and with . At higher resolution, this gas is decomposed into distinct clumps; this will be discussed in Section 4.
Also seen in stellar maps underlying Figures 3 are Streams C and D. While there is apparently no emission associated with Stream C, there is one blob of emission almost overlaying Stream D with . This emission arises close to two kinematic fields on Stream D obtained by Chapman et al. (2008), both of which yielded velocities of ; given the similarity of these velocities, and their distinct difference from the large scale H I gradient between M31 and M33 (with an expected velocity of ) this is strongly suggestive of an association between the stellar and gaseous material in Stream D.
3.2.2 The disk & halo of M33
There is a gross alignment of the stellar debris and that of the H I emission in the outskirts of M33, although there again is the spatial offset between the two components (Section 3.1 & Figure 4). The kinematic properties of the gaseous material within the disk of M33 can be described with a galactic rotation model (i.e. Corbelli, 2003), and also to the emission beyond edge of the stellar disk. Unfortunately, the only stellar kinematics obtained beyond the optical disk were obtained along the Southern major axis (McConnachie et al., 2006), away from the prominent stellar debris (McConnachie et al., 2009, 2010), and hence no detailed comparison can be made.
4. Interpretation
What does the general lack of spatial and kinematic correlations between stellar substructure and H I tell us about the ongoing accretion in the M31-M33 system? Clearly, the axis connecting these two galaxies contains the majority of the substructure, but it appears that, in this case, the stellar and H I are the result of distinctly different accretion events; the main gaseous bridge through this region arises from the interaction between M31 and M33 alone, with any stellar material too sparsely distributed to be detected (Bekki, 2008; McConnachie et al., 2009). Given M33’s relatively large mass, and potentially large impact-parameter, it has been able to retain the bulk of its stars and gas during the interaction with M31, although the interaction has distorted both the stellar and gaseous disk of M33.
The progenitor of the Giant Stellar Stream, however would have been a lower mass system that has been interacting with M31, and, due to this interaction any progenitor gas was lost long ago, while the remnant stellar debris exists in the form of tidal streams and shell-like caustics. At first glance, the lack of significant gaseous structures corresponding to the GSS and other associated stellar features may seem surprising. However, as noted previously, while the gaseous and stellar components of an orbiting satellite are both subject to gravitational (tidal) forces, gas is also subject to shocks and hydrodynamic drag. One possibility is that ram pressure stripping led to nearly complete loss gas from the GSS progenitor well before the formation of the observed GSS and associated structures. However, even if the ram pressure is not sufficiently efficient to completely strip the progenitor of its gas, hydrodynamic interactions can erase potential spatial and kinematic correlations between the two components. We are presently studying the gaseous and stellar streams using high resolution numerical simulations (Shannon et al., in preparation) and preliminary results suggest that the two components can experience significant dislocation over the course of a single orbit, with the loss of angular momentum and energy due to hydrodynamic forces causing the gas to sink to the center of M31, unlike the much longer-lived stellar structures.
One intriguing correlation occurs where the GSS meets the disk of M31 (see Figure 3). While the gas is spatially offset by , it velocity of is remarkably close to that of the GSS at this point. While they may be unrelated, it is worthwhile examining if it is plausible that they are physically conected. Such a question is complicated by the fact that there appears to be very little gas associated with the GSS, consistent with a lack of recent star-formation (Brown et al., 2006), but, this could be solved if the enhancement of H I marks the (as yet unidentified) progenitor of the GSS, with the offset in the spatial location illustrating the action of ram-pressure stripping; such a conclusion would indicate that the accretion of the GSS is a relatively recent event and has not undergone several complete orbits, or by a progenitor massive enough to retain some of its gas through a prolonged accretion. This latter option is in agreement with the prediction of Fardal et al. (2008) who suggested that the source of the GSS was a rotating disk galaxy with a stellar mass of .
An alternate explanation also requires that the progenitor of the GSS was gas-rich, but that some gas remains orbiting with the stars. This gas would be too tenuous to be visible in the observations presented in this paper, but as the stream is funnelled into the central regions, orbits converge and the local densities of both stars and gas increases. Given this density enhancement, the gas could become visible to our observations. Again, the offset in spatial location probably indicates ongoing ram-pressure, although there may be a delicate balance between the amount of ongoing ram-pressure and the dynamical shepherding by the associated stream of stripped dark matter, so that any can remain associated with the stream. Detailed simulations of the formation and evolution of the GSS, considering realistic gas physics, are required to address these questions.
Away from M31, there is a tantalising correlation between H I and stellar material in the vicinity of the SW Cloud. There are two potential interpretations for this, one with the SW Cloud representing an outwardly moving agglomeration of shredded stars, left over from a close interaction with M31 million years ago. This interaction would have to have been with a relatively pristine, gas-rich progenitor to leave the shredded debris with gas. On the other hand, the SW Cloud could represent the enhancement at the turning point of a stellar stream, and this stream would again have to be gas-rich to exhibit a similar enhancement in the H I. Both scenarios require a relatively recent first passage of M31, ensuring that the progenitor does not lose all its gas through ram-pressure stripping through an extended interaction. The estimated stellar and gas mass in the region of the SW Cloud are and respectively, suggesting that, if this is representative of a recent accretion event, then the progenitor would have properties similar to the dwarf irregular IC10 (McConnachie et al., 2012a).
While we do not have kinematics for the stellar component of the SW Cloud, it does appear to be spatially correlated with three globular clusters (see Mackey et al., 2010) for which velocities have been recently determined (these will be presented in detail in forthcoming publications by Mackey et al. (2012) and Veljanoski et al. (2012)). If we take their velocities, of (PAndAS-7), (PAndAS-8) and (PAndAS-14), each with an error of less than , as being representative to that of the SW Cloud in general, we can compare this gaseous spur velocity of ; which this is broadly consistent with the globular cluster velocity, especially if we expect a velocity gradient along any putative stream connecting the two component. It should be noted, however, the width of the H I in the SW Spur is , again indicative that we may be looking both outbound and inbound gases streams, although until we have stellar kinematics for the SW Cloud, and detailed dynamical modelling, the link between the SW Cloud and SW Spur remains circumstantial.
The distribution of gas within the M31-M33 system, especially the warped gas disk of M33 and the apparent gas bridge connecting M31 to M33, strongly suggests a past interaction of the two galaxies. It has been argued that the misalignment between the inner and outer gaseous disk of M33 and its interpretation as a warped disk could be the result of a recent tidal interaction (this is discussed in more detail below). The faint extension of the stellar disk with a similar alignment as the outer gas disk can be reproduced in interaction models (McConnachie et al., 2009). The gas bridge between the two galaxies has also been modelled in the context of a past interaction (e.g. Bekki, 2008).
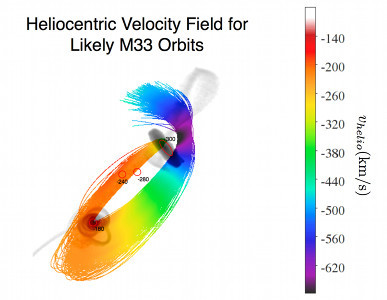
While the interaction hypothesis is a plausible explanation for the phenomenology of the gas in the M31-M33 system it ultimately depends on knowing the orbit of M33. Recent measurements of both the proper motion of M33 (Brunthaler et al., 2005) and M31 (Sohn et al., 2012) provide strong constraints on the M33 orbit within assumed mass models of M31. We have been recently extending the dynamical models described in McConnachie et al. (2009) to describe the distorted outer stellar disk of M33 to a range of mass models for M31 and M33 using a Bayesian analysis to determine the distribution of orbits that are statistically consistent with the observed distance, radial velocities and proper motions of the galaxies. This is a work in progress but we present some preliminary results here relevant to the observed gas distribution. In Figure 5, we present the distribution of orbits and the resulting line-of-sight velocity field consistent with the observations with the constraints that the pericentre for the M33 orbit is in the range of in a mass model of M31 with with kpc. The orbits are computed within the model potentials including a Chandrasekhar drag term to model dynamical friction. The drag coefficients are calibrated against live N-body simulations to ensure their applicability to the Bayesian analysis. We further constrain the distribution to lie within 20 degrees of the plane containing the gas bridge with the implicit assumption that the bridge is created from tidally stripped gas from M33. We have also overlaid the stellar distribution from one N-body simulation including dark matter and stars without gas to orient the orbital distribution as well as illustrate the expected distortion of the outer disk of M33. We note that the complex stellar features seen around M33 in the simulation would be undetectable using current observations but we present an enhanced view to illustrate the complex dynamics. This model succeeds in two points in reference to the gas distribution. First, the model predicts that the outer disk of M33 will be warped and twisted as the result of an interaction while the inner bright disk will remain unscathed. Second, tidally stripped stars result in a tidal tail extending to the SE and a tidal bridge that falls back onto M31. While we have not modelled the gas in this simulation, we expect stripped gas to follow approximately ballistic trajectories similar to the stars. The heliocentric velocity of the distribution of orbits is consistent with the observed velocities of -240 and -280 km/s seen in prominent gas features in the bridge. A tidal bridge of gas falling back onto M31 leading the position of M33 on its orbit after a past interaction is a plausible description of these features.
Finally, we look more closely at the stellar and gaseous material in the outskirts of M33, with distinct features visible in both the NW and SE (see Figure 4). The position angle of the H I feature is offset from that of the disk by , and has been interpreted as a warped disk in projection and modelled in terms of tilted rings by Corbelli & Schneider (1997). The stellar features lie roughly between the disk and H I position angles.
The origin of both the H I and stellar features has been attributed to tidal interactions with M31 during a close encounter (Putman et al. 2009; McConnachie et al. 2009, but see Reakes & Newton 1978 for an early discussion of this possibility), though models of a steady state precessing warp in a model with a flattened halo have also been considered (e.g. Kuijken, 1991). Competing with tidal effects is the gravitational field of the M33 disk and dark halo. In addition, the H I disk experiences ram pressure due to its interaction with the gaseous halo of M31. We can distinguish between three regions: The outermost part of the disk where tidal interactions and ram pressure strip material from M33 leaving behind a stream, which roughly traces the M33 orbit; an intermediate region, where material is stripped from the M33 disk but remains bound to the galaxy; and a close-in region, where the disk is warped but material remains on roughly circular orbits.
In this simplified argument, we consider an element of the M33 gas disk at galactocentric radius with surface area and surface density . The tidal force on this element due to M31 is
| (1) |
where is the perigalactic distance between M31 and M33. In deriving this expression we have assumed that and that M31 has a flat rotation curve with a circular velocity . The ram pressure force is
| (2) |
where is the density of the M31 gaseous halo. The gravitational restoring force due to the M33 disk is
| (3) |
where is the total surface density of the disk. If we assume an exponential disk, then . The restoring force due to M33 as a whole is
| (4) |
where we assume that M33 also has a flat rotation curve. Setting yields an estimate for the tidal radius: .
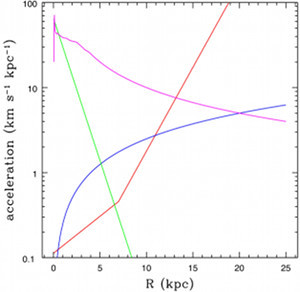
The different forces are shown in Figure 6, and for purely illustrative purposes, we set , , , , , , and . The forces due to the M31 tidal field and due to M33 itself are equal at the tidal radius . Ram pressure can disrupt the disk at and strip material from M33 .
While these arguments represent order-of-magnitude estimates, they appear to roughly correspond to the observed structures in M33. However, a full exploration of the M31-M33 interaction, especially with regards to the stripping of M33, using models including gas, stars and dark matter, are required to fully understand the complex dynamics on display; this will form the basis of an upcoming paper (Dubinski et al. 2012).
5. Conclusions
We have presented the spatial and kinematic correlations of the stellar and gaseous substructure within the haloes of M31 and M33. While significant substructure is apparent in each component, and there is a gross alignment of significant features, mainly along the axis connecting M31 and M33, there is a distinct lack of correlation between the detailed structures.
The lack of a truly global kinematic survey of the stellar substructure within the halos of M31 and M33 limits a detailed comparison of stars and gaseous material, although the growing number of “key-hole” observations with 10-m class telescopes is addressing this. However, this situation will be resolved with the advent of wide-field spectroscopy on large telescopes, such as the proposal to build the ngCFHT555orca.phys.uvic.ca/pcote/ngcfht, ushering in a new era in understanding galactic archaeology.
The resulting conclusion of this study, therefore, is that the gaseous and stellar substructure within the halos of M31 and M33 have been built through a number of distinct accretion events, but differing physical processes have driven the disruption of the stellar and gaseous components of any particular substructure, with the latter suffering the additional forces of shocking and ram-pressure stripping. Given that, through the use of high-resolution numerical simulations, our understanding of the differing processes driving the disruption of stellar and gaseous material, a comparison of their distribution through the halo should allow us to dynamically date the accretion; this will be the subject of a future contribution.
References
- Abraham & van den Bergh (2001) Abraham, R. G., & van den Bergh, S. 2001, Science, 293, 1273
- Bekki (2008) Bekki, K. 2008, MNRAS, 390, L24
- Besla et al. (2010) Besla, G., Kallivayalil, N., Hernquist, L., et al. 2010, ApJ, 721, L97
- Braun & Thilker (2004) Braun, R., & Thilker, D. A. 2004, A&A, 417, 421
- Braun et al. (2009) Braun, R., Thilker, D. A., Walterbos, R. A. M., & Corbelli, E. 2009, ApJ, 695, 937
- Brown et al. (2006) Brown, T. M., Smith, E., Ferguson, H. C., et al. 2006, ApJ, 652, 323
- Brunthaler et al. (2005) Brunthaler, A., Reid, M. J., Falcke, H., Greenhill, L. J., & Henkel, C. 2005, Science, 307, 1440
- Bullock & Johnston (2005) Bullock, J. S., & Johnston, K. V. 2005, ApJ, 635, 931
- Burton & Lockman (1999) Burton, W. B., & Lockman, F. J. 1999, A&A, 349, 7
- Carlberg et al. (2011) Carlberg, R. G., et al. 2011, ApJ, 731, 124
- Chapman et al. (2008) Chapman, S. C., et al. 2008, MNRAS, 390, 1437
- Cockcroft et al. (2011) Cockcroft, R., et al. 2011, ApJ, 730, 112
- Collins et al. (2009) Collins, M. L. M., et al. 2009, MNRAS, 396, 1619
- Collins et al. (2011) Collins, M. L. M., Chapman, S. C., Rich, R. M., et al. 2011, MNRAS, 417, 1170
- Conn et al. (2011) Conn, A. R., Lewis, G. F., Ibata, R. A., et al. 2011, ApJ, 740, 69
- Conn et al. (2012) Conn, A. R., et al. 2012, ApJ, Accepted
- Cooper et al. (2010) Cooper, A. P., Cole, S., Frenk, C. S., et al. 2010, MNRAS, 406, 744
- Corbelli & Schneider (1997) Corbelli, E., & Schneider, S. E. 1997, ApJ, 479, 244
- Corbelli (2003) Corbelli, E. 2003, MNRAS, 342, 199
- Davies (1975) Davies, R. D. 1975, MNRAS, 170, 45P
- de Jong et al. (2010) de Jong, J. T. A., Yanny, B., Rix, H.-W., et al. 2010, ApJ, 714, 663
- Diaz & Bekki (2011) Diaz, J., & Bekki, K. 2011, PASA, 28, 117
- Faber et al. (2003) Faber, S. M., Phillips, A. C., Kibrick, R. I., et al. 2003, Proc. SPIE, 4841, 1657
- Fardal et al. (2008) Fardal, M. A., Babul, A., Guhathakurta, P., Gilbert, K. M., & Dodge, C. 2008, ApJ, 682, L33
- Fardal et al. (2012) Fardal, M. A., Guhathakurta, P., Gilbert, K. M., et al. 2012, MNRAS, 423, 3134
- Faria et al. (2007) Faria, D., Johnson, R. A., Ferguson, A. M. N., et al. 2007, AJ, 133, 1275
- Ferguson et al. (2002) Ferguson, A. M. N., Irwin, M. J., Ibata, R. A., Lewis, G. F., & Tanvir, N. R. 2002, AJ, 124, 1452
- Font et al. (2011) Font, A. S., McCarthy, I. G., Crain, R. A., et al. 2011, MNRAS, 416, 2802
- Geehan et al. (2006) Geehan, J. J., Fardal, M. A., Babul, A., & Guhathakurta, P. 2006, MNRAS, 366, 996
- Gilbert et al. (2009) Gilbert, K. M., Guhathakurta, P., Kollipara, P., et al. 2009, ApJ, 705, 1275
- Gilbert et al. (2012) Gilbert, K. M., Guhathakurta, P., Beaton, R. L., et al. 2012, arXiv:1210.3362
- Gratier et al. (2010) Gratier, P., Braine, J., Rodriguez-Fernandez, N. J., et al. 2010, A&A, 522, A3
- Huxor et al. (2005) Huxor, A. P., Tanvir, N. R., Irwin, M. J., et al. 2005, MNRAS, 360, 1007
- Huxor et al. (2008) Huxor, A. P., Tanvir, N. R., Ferguson, A. M. N., et al. 2008, MNRAS, 385, 1989
- Huxor et al. (2011) Huxor, A. P., Ferguson, A. M. N., Tanvir, N. R., et al. 2011, MNRAS, 414, 770
- Ibata & Lewis (1998) Ibata, R. A., & Lewis, G. F. 1998, ApJ, 500, 575
- Ibata et al. (2001) Ibata, R., Irwin, M., Lewis, G., Ferguson, A. M. N., & Tanvir, N. 2001, Nature, 412, 49
- Ibata et al. (2004) Ibata, R., Chapman, S., Ferguson, A. M. N., Irwin, M., Lewis, G., & McConnachie, A. 2004, MNRAS, 351, 117
- Ibata et al. (2005) Ibata, R., Chapman, S., Ferguson, A. M. N., et al. 2005, ApJ, 634, 287
- Ibata et al. (2007) Ibata, R., Martin, N. F., Irwin, M., Chapman, S., Ferguson, A. M. N., Lewis, G. F., & McConnachie, A. W. 2007, ApJ, 671, 1591
- Ibata et al. (2012) Ibata, R., et al. 2012, In preparation
- Irwin et al. (2012) Irwin, M. J., et al. 2012, In preparation
- Kalirai et al. (2009) Kalirai, J. S., Zucker, D. B., Guhathakurta, P., et al. 2009, ApJ, 705, 1043
- Kalirai et al. (2010) Kalirai, J. S., Beaton, R. L., Geha, M. C., et al. 2010, ApJ, 711, 671
- Klypin et al. (1999) Klypin, A., Kravtsov, A. V., Valenzuela, O., & Prada, F. 1999, ApJ, 522, 82
- Kuijken (1991) Kuijken, K. 1991, ApJ, 376, 467
- Mackey et al. (2006) Mackey, A. D., Huxor, A., Ferguson, A. M. N., et al. 2006, ApJ, 653, L105
- Mackey et al. (2007) Mackey, A. D., Huxor, A., Ferguson, A. M. N., et al. 2007, ApJ, 655, L85
- Mackey et al. (2010) Mackey, A. D., et al. 2010, ApJ, 717, L11
- Mackey et al. (2012) Mackey, A. D., et al. 2012, In preparation
- Martin et al. (2006) Martin, N. F., Ibata, R. A., Irwin, M. J., Chapman, S., Lewis, G. F., Ferguson, A. M. N., Tanvir, N., & McConnachie, A. W. 2006, MNRAS, 371, 1983
- Martin et al. (2007) Martin, N. F., Ibata, R. A., & Irwin, M. 2007, ApJ, 668, L123
- Martin et al. (2007) Martin, N. F., Ibata, R. A., Chapman, S. C., Irwin, M., & Lewis, G. F. 2007, MNRAS, 380, 281
- Mastropietro et al. (2009) Mastropietro, C., Burkert, A., & Moore, B. 2009, MNRAS, 399, 2004
- McClure-Griffiths et al. (2009) McClure-Griffiths, N. M., Pisano, D. J., Calabretta, M. R., et al. 2009, ApJS, 181, 398
- McConnachie et al. (2003) McConnachie, A. W., Irwin, M. J., Ibata, R. A., Ferguson, A. M. N., Lewis, G. F., & Tanvir, N. 2003, MNRAS, 343, 1335
- McConnachie et al. (2006) McConnachie, A. W., Chapman, S. C., Ibata, R. A., Ferguson, A. M. N., Irwin, M. J., Lewis, G. F., Tanvir, N. R., & Martin, N. 2006, ApJ, 647, L25
- McConnachie et al. (2009) McConnachie, A. W., et al. 2009, Nature, 461, 66
- McConnachie et al. (2010) McConnachie, A. W., Ferguson, A. M. N., Irwin, M. J., Dubinski, J., Widrow, L. M., Dotter, A., Ibata, R., & Lewis, G. F. 2010, ApJ, 723, 1038
- McConnachie et al. (2012a) McConnachie, A. W., 2012, AJ, 144, 4
- McConnachie et al. (2013) McConnachie, A. W., et al., 2013, In preparation
- Moore & Davis (1994) Moore, B., & Davis, M. 1994, MNRAS, 270, 209
- Moore et al. (1999) Moore, B., Ghigna, S., Governato, F., Lake, G., Quinn, T., Stadel, J., & Tozzi, P. 1999, ApJ, 524, L19
- Mori & Rich (2008) Mori, M., & Rich, R. M. 2008, ApJ, 674, L77
- Murakami & Babul (1999) Murakami, I., & Babul, A. 1999, MNRAS, 309, 161
- Putman et al. (2004) Putman, M. E., Thom, C., Gibson, B. K., & Staveley-Smith, L. 2004, ApJ, 603, L77
- Putman et al. (2009) Putman, M. E., et al. 2009, ApJ, 703, 1486
- Reakes & Newton (1978) Reakes, M. L., & Newton, K. 1978, MNRAS, 185, 277
- Richardson et al. (2008) Richardson, J. C., et al. 2008, AJ, 135, 1998
- Richardson et al. (2011) Richardson, J. C., et al. 2011, ApJ, 732, 76
- Rogstad et al. (1976) Rogstad, D. H., Wright, M. C. H., & Lockhart, I. A. 1976, ApJ, 204, 703
- Ruszkowski et al. (2012) Ruszkowski, M., Brüggen, M., Lee, D. & Shin, M.-S. 2012, ApJ, Submitted
- Siebert et al. (2011) Siebert, A., Williams, M. E. K., Siviero, A., et al. 2011, AJ, 141, 187
- Sohn et al. (2012) Sohn, S. T., Anderson, J., & van der Marel, R. P. 2012, ApJ, 753, 7
- Stanimirović et al. (2008) Stanimirović, S., Hoffman, S., Heiles, C., et al. 2008, ApJ, 680, 276
- Tanvir et al. (2012) Tanvir, N. R., Mackey, A. D., Ferguson, A. M. N., et al. 2012, MNRAS, 422, 162
- Thilker et al. (2002) Thilker, D. A., Braun, R., & Walterbos, R. A. M. 2002, Seeing Through the Dust: The Detection of HI and the Exploration of the ISM in Galaxies, 276, 370
- Thilker et al. (2004) Thilker, D. A., Braun, R., Walterbos, R. A. M., et al. 2004, ApJ, 601, L39
- Tolstoy (2011) Tolstoy, E. 2011, Science, 333, 176
- Tolstoy et al. (2009) Tolstoy, E., Hill, V., & Tosi, M. 2009, ARA&A, 47, 371
- Veljanoski et al. (2012) Veljanoski, J., et al. 2012, In preparation
- Westmeier et al. (2005a) Westmeier, T., Braun, R., Bruens, C., Kerp, J., & Thilker, D. 2005, Astronomische Nachrichten, 326, 520
- Westmeier et al. (2005b) Westmeier, T., Braun, R., & Thilker, D. 2005, A&A, 436, 101
- Wyse (2010) Wyse, R. F. G. 2010, Astronomische Nachrichten, 331, 526