Antiferromagnetism in EuNiGe3
Abstract
The synthesis and crystallographic and physical properties of polycrystalline EuNiGe3 are reported. EuNiGe3 crystallizes in the noncentrosymmetric body-centered tetragonal BaNiSn3-type structure (space group ), in agreement with previous reports, with the Eu atoms at the corners and body center of the unit cell. The physical property data consistently demonstrate that this is a metallic system in which Eu spins order antiferromagnetically at a temperature K. Magnetic susceptibility data for indicate that the Eu atoms have spin 7/2 with , that the Ni atoms are nonmagnetic, and that the dominant interactions between the Eu spins are ferromagnetic. Thus we propose that EuNiGe3 has a collinear A-type antiferromagnetic structure, with the Eu ordered moments in the -plane aligned ferromagnetically and with the moments in adjacent planes along the -axis aligned antiferromagnetically. A fit of by our molecular field theory is consistent with a collinear magnetic structure. Electrical resistivity data from to 350 K are fitted by the Bloch-Grüneisen model for electron-phonon scattering, yielding a Debye temperature of 265(2) K. A strong decrease in occurs below due to loss of spin-disorder scattering. Heat capacity data at K are fitted by the Debye model, yielding the same Debye temperature 268(2) K as found from . The extracted magnetic heat capacity is consistent with and shows that significant short-range dynamical spin correlations occur above . The magnetic entropy at K is 83% of the expected asymptotic high- value, with the remainder recovered by 30 K.
pacs:
75.50.Ee, 75.10.Jm, 65.40.-b, 72.15.-vI INTRODUCTION
Magnetic susceptibility and magnetization measurements versus temperature and applied magnetic field have been widely used to determine the magnetic properties of materials containing local magnetic moments.Kittel2005 Such measurements give valuable information about the magnetic interactions and magnetic structure of a material. In collinear antiferromagnetic (AF) materials, the qualitative dependence of the anisotropic below the AF ordering (Néel) temperature is well known. In 1941, Van Vleck calculated using molecular field theory (MFT) the anisotropic for a collinear AF containing identical crystallographically equivalent spins interacting by Heisenberg exchange, but only for the special case of a two-sublattice bipartite spin lattice, i.e., in which the nearest-neighbor spins of a spin on one sublattice (“up spins”) are members of the other sublattice (“down spins”).VanVleck1941 He further assumed that spins on one sublattice only interact with the nearest-neighbor spins on the other sublattice and with the same strength.VanVleck1941 Due to its limited applicability, few comparisons of experimental data with these theoretical predictions have been made.
We recently formulated generic predictions using MFT of the anisotropic of both collinear and planar noncollinear AF structures for Heisenberg spin systems containing identical crystallographically equivalent spins with arbitrary exchange interactions between arbitrary sets of spins.Johnston2012 ; Johnston2011 Several comparisons of our theoretical predictions with experimental anisotropic literature data for single crystals of known collinear and noncollinear AFs were made and reasonable agreement was found.Johnston2012 Such comparisons are expected to be most accurate for three-dimensional spin lattices with large spin , which respectively minimize quantum fluctuations associated with low spin lattice dimensionality and/or low spin that are not taken into account by MFT. The MFT that we formulated is also expected to be most accurate for spin-only ions with angular momentum , which minimizes crystalline electric field effects arising from the spin-orbit interaction such as single-ion anisotropy effects. As discussed in Ref. Johnston2012, , the deviation of the MFT prediction from the anisotropic data for Heisenberg spin systems can be used as a quantitative diagnostic for dynamical spin fluctuations and correlations beyond MFT. Comparisons of of an AF compound with MFT predictions have been used in the past to test for the occurrence of such dynamical short-range spin correlations, but usually only at temperatures above .
In Ref. Johnston2012, we pointed out that the same MFT predictions used to extract information about the magnetic interactions and magnetic structures of AFs from analyses of anisotropic data for single crystal AFs should also be useful for analyzing the necessarily isotropic data for polycrystalline AFs. For example, such measurements can distinguish between collinear and planar noncollinear AF structures, even when multiple collinear AF domains occur. They can also be used to estimate the wave vector and turn angle between adjacent planes of spins along the helix or cycloid axis of planar helical or cycloidal AF structures.Yoshimori1959
We report in this paper and measurements of polycrystalline EuNiGe3 and demonstrate that this compound exhibits long-range AF order below K. We analyze the data at using our new MFT as well as at using the conventional Curie-Weiss law, which is also a MFT prediction. We also report x-ray diffraction measurements of the crystal structure of this material, electrical resistivity measurements fitted by the Bloch-Grüneisen model and heat capacity measurements analyzed using the Debye model and correlate the results with the magnetic measurements.
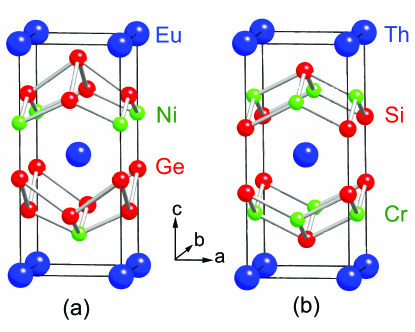
The compound EuNiGe3 crystallizes in the body-centered tetragonal -type structure (space group ) with the Eu atoms at the corner and body-center positions forming a square lattice in the -plane stacked in a zigzag ABA fashion along the -axis as shown below in Fig. 2(a).Oniskovets1987 ; Salamakha1996 No information is available about its physical properties. Recent measurements of the physical properties of the related compounds NiGe3 ( Y, Ce–Nd, Sm, Gd–Lu) with the same stoichiometry but with a different base-centered orthorhombic SmNiGe3-type crystal structure (space group ) have been reported, and most of these are found to order antiferromagnetically.Mun2010 These compounds also contain a square sublattice with a different ABBA zigzag stacking sequence, but which is qualitatively similar to the stacked Eu square lattice in EuNiGe3. Therefore EuNiGe3 also appeared to us to be a candidate for AF ordering as we subsequently confirmed. Also, spin-only Eu+2 ions with have orbital angular momentum , an advantageous property resulting in negligible crystalline electric field effects and a spectroscopic splitting factor .
From analysis of our data for EuNiGe3 at using the Curie-Weiss law, the dominant interactions between the Eu+2 spins are ferromagnetic (FM), in spite of the collinear long-range AF order at suggested by our data at . Taking into account the symmetry of the unit cell, we propose that the Eu spins within a tetragonal -plane interact ferromagnetically but spins in adjacent layers along the -axis interact antiferromagnetically. We further propose that this set of exchange interactions gives rise to a collinear A-type AF structure in which the Eu ordered moments within a layer are aligned ferromagnetically with respect to each other, but are aligned antiferromagnetically with respect to the moments in the two adjacent planes along the -axis.
For the scheme of magnetic interactions in EuNiGe3 that we propose, the FM interactions between spins within an -plane act within the same sublattice, and hence the interactions are not consistent with Van Vleck’s MFT for discussed above, even though both AF structures are collinear. This means that Van Vleck’s prediction for is not appropriate for analyzing such data. Our generic MFT must be used instead. An analysis of for polycrystalline EuNiGe3 cannot determine the orientation of the easy axis of the A-type AF structure with respect to the crystal axes, e.g., along the -axis or within the -plane, although such a determination is possible using data for single-crystal samples. Future magnetic neutron and/or magnetic x-ray scattering measurements can test our model for the A-type AF structure and also determine the direction of the ordered moments. On the basis of the analysis of in terms of the Curie-Weiss law, we obtain estimates of the nearest-neighbor in-plane and out-of-plane Eu-Eu exchange interactions.
II Experimental Details
Polycrystalline EuNiGe3 was prepared from the high purity elements. Eu was obtained from Ames Laboratory and Ni (99.996%) and Ge (99.9999+%) from Alfa Aesar. Eu pieces were surrounded by Ni and Ge powders in a pressed pellet. The pellet was placed in a 2 mL alumina crucible and sealed in an evacuated fused silica tube. The sample was heated at 850 ∘C for 30 h followed by a thorough grinding to ensure homogeneity, and then after pelletizing heated in an evacuated fused silica tube at 900 ∘C for d. All sample handling, except for brief exposures to air to press the pellets and load the silica tubes, was done in a glove box containing high-purity He gas. A single-phase sample (apart from a trace of elemental Ge) was obtained as established from powder x-ray diffraction measurements described in Section III.1 below. Growths of single crystals using Sn and NiGe3 fluxes were attempted but were not successful.
Powder x-ray diffraction (XRD) data were collected using a Rigaku Geigerflex diffractometer with Cu K radiation. Rietveld refinement of the XRD data was accomplished using the FullProf package.Rodriguez1993
measurements versus and were carried out using a superconducting quantum interference device (SQUID) magnetometer (Quantum Design, Inc.). A gel cap was used as sample holder and its small diamagnetic magnetization was measured separately and corrected for in the magnetization data for EuNiGe3 that are presented. We use Gaussian cgs units for the magnetization, magnetic susceptibility and magnetic field throughout, where the magnetic field unit of Tesla, when it appears, is a unit of convenience ().
Heat capacity and electrical resistivity measurements were carried out using a Quantum Design Physical Property Measurement System (PPMS). The sample for measurements was attached and thermally coupled to the addenda with Apiezon N grease. The measurements utilized a four-probe ac technique with the ac-transport option of the PPMS, where a rectangular parallelopiped-shaped sample was cut from the sintered pellet for the measurements using a jeweler’s saw. Platinum electrical leads were attached to the sample using EPO-TEK P1011 silver epoxy and the sample was attached to the resistivity puck with GE 7031 varnish. The measurements were carried out on both cooling and heating to check for hysteresis.
III Experimental Results, Analyses and Discussion
III.1 Crystal Structure Determination
| Atom | Wyckoff position | |||
|---|---|---|---|---|
| Eu | 2a | 0 | 0 | 0.0028(3) |
| Ni | 2a | 0 | 0 | 0.6581(4) |
| Ge1 | 4b | 0 | 1/2 | 0.2582(4) |
| Ge2 | 2a | 0 | 0 | 0.4163(4) |
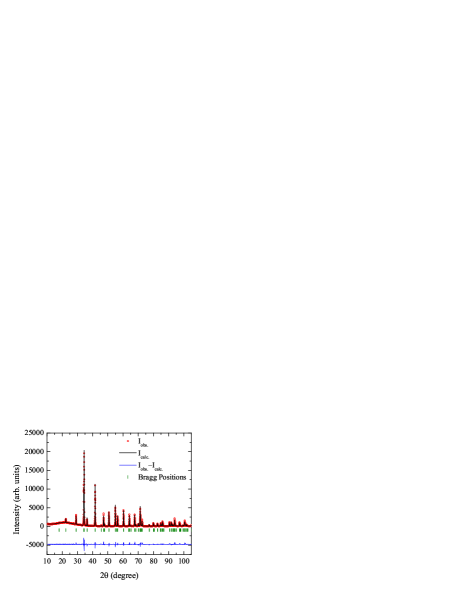
The crystal structure of EuNiGe3 reported in Ref. Oniskovets1987, was used as the starting point for the Rietveld refinement of our powder XRD data. We also observed very weak peaks from an impurity phase with the strongest peaks at diffraction angles and . These correspond to the strongest peaks of pure Ge, indicating the presence of a trace amount of elemental Ge in our sample. During refinement of the XRD data for the EuNiGe3 phase, the thermal parameters of the atoms were fixed at zero. In the final refinement the occupancies of the atoms were fixed at the stoichiometric values because no significant difference in the goodness of fit was obtained when the occupancies were allowed to vary.
A satisfactory Rietveld refinement of the powder XRD data for EuNiGe3 was obtained assuming the body-centered-tetragonal BaNiSn3-type structure (space group ) as shown in Fig. 1, with parameters listed in Table 1. This structure and the common ThCr2Si2-type structure are both derivatives of the BaAl4-type structure.Parthe1983 A comparison between the EuNiGe3 and ThCr2Si2 structures is shown in Fig. 2. The Eu and Th positions are identical in the two structures. The ThCr2Si2-type structure is centrosymmetric whereas the BaNiSn3-type structure is not. In the BaNiSn3-type structure, the transition metal square lattice in the -plane is rotated by with respect to the -plane Cr square-lattice in ThCr2Si2, and the ordering of the Si or Ge layers and the transition metal layers along the -axis is different.
The refined lattice parameters for EuNiGe3 in the caption of Table 1 can be compared with the reported values Å and Å.Oniskovets1987 Our -axis parameter is much smaller by 0.400 Å than the reported value, which we therefore assume is due to a typographical error in Ref. Oniskovets1987, , but the -axis parameters are nearly the same.
III.2 Electrical Resistivity Measurements
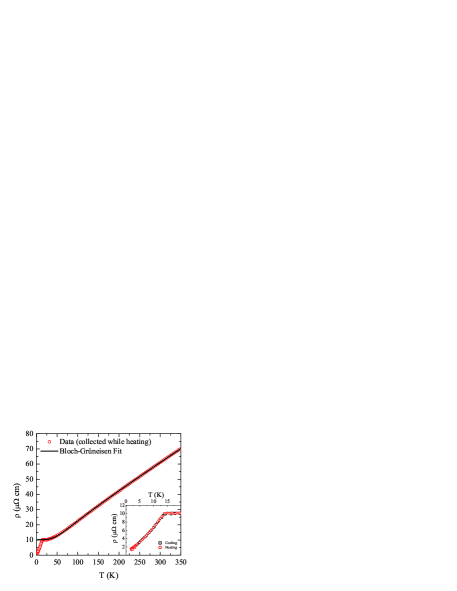
The of EuNiGe3 was measured from to K and the data are presented in Fig. 3. The sample shows a very large residual resistivity ratio indicating that our polycrystalline sample is of good quality for electronic transport measurements. A strong decrease in at occurs due to the loss of spin disorder scattering below K (see also below), as shown on expanded scales in the inset of Fig. 3. The data in the inset also show no hysteresis between heating and cooling runs, indicating that the AF transition is thermodynamically of second order. Above the resistivity due to spin disorder scattering is expected to be constant.Coles1958 Therefore, the dependence above is due to other electron scattering mechanisms. Typical mechanisms are electron-electron scattering which leads to a dependence and electron-phonon scattering with or without simultaneous Umklapp scattering.
The Bloch-Grüneisen model predicts the contribution to due to scattering of electrons by longitudinal lattice vibrations in the absence of Umklapp scattering.Ziman1960 ; Blatt1968 ; Goetsch2012 When additional constant terms are added to account for the residual resistivity () and the spin disorder resistivity at (), the sum is
| (1) | |||||
where is a material-dependent prefactor that is independent of and is the Debye temperature determined from resistivity measurements.
To fit our data by Eq. (1), we utilized a high-accuracy analytic Padé approximant for the Bloch-Grüneisen function in Eq. (1) that we formulated recently.Goetsch2012 As seen in Fig. 3, an excellent fit by Eq. (1) was obtained to the data for . The parameters obtained from the fit are cm, K and cm. The quoted statistical errors on the resistivity contributions do not take into account an estimated systematic error of order 10% arising from uncertainty in the geometric factor and from the porosity and grain boundary scattering of the sintered sample. The excellent agreement of the temperature dependence of the data with the fit indicates that electron-phonon scattering is the primary scattering mechanism giving rise to the dependence of for . This conclusion is supported by the agreement of K with the Debye temperature K obtained below by fitting the lattice heat capacity by the Debye model over approximately the same range.
III.3 Magnetization and Magnetic Susceptibility Measurements
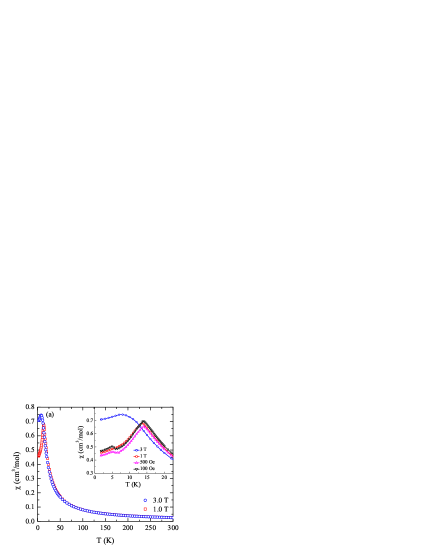
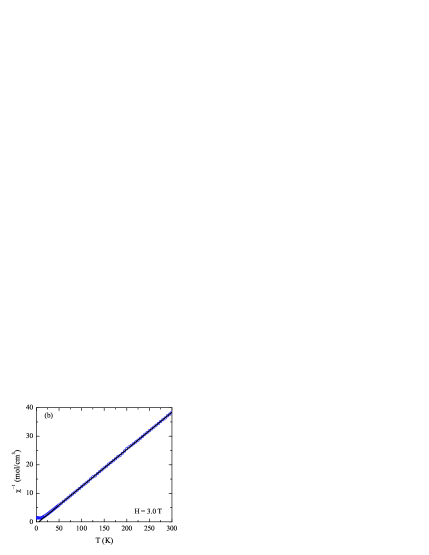
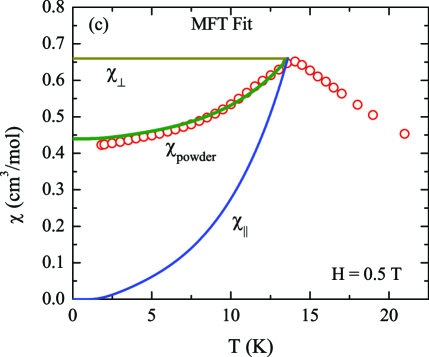
The magnetic susceptibility versus of EuNiGe3 was measured at T and 3 T in the range 1.8–300 K as shown in Fig. 4(a). The inverse susceptibility for T is plotted in Fig. 4(b), and data for T from to 25 K are shown in Fig. 4(c). The sharp peak at K in the data for T in Figs. 4(a) and 4(c) is the signature of AF ordering occurring at this . Another transition at K is observed as a sharp cusp for fields Oe as shown in the inset of Fig. 4(a). The nature of this transition is unclear. There is no evidence of a transition at this in either the data presented above or the data presented below. A similar unexplained feature at about the same temperature was observed in EuPdGe3.Kaczorowski2012 The feature cannot be due to a ferromagnetic EuO impurity phase because the Curie temperature of EuO is 69 K.Liu2012
At , the molar follows the Curie-Weiss law
| (2) |
as shown by the plot of versus in Fig. 4(b) for T, where is the molar Curie constant and is the Weiss temperature. These data decrease linearly with decreasing down to K, below which short-range AF correlations begin to cause a deviation from the Curie-Weiss law. Thefore we fitted the data in Fig. 4(b) by Eq. (2) only from 50 to 300 K. The resulting fit gave cm3 K/mol and K. The value is close to the value cm3 K/mol expected for Eu+2 with and . The agreement of the Curie constant with that expected for Eu+2 with indicates that the Ni atoms are nonmagnetic. The conclusion that the Eu atoms have agrees with the analysis of the magnetic entropy described in Section III.4 below. The ratio is
| (3) |
where we used the precise value K determined from our heat capacity measurements below.
Using the Heisenberg Hamiltonian for a system comprised of identical crystallographically equivalent spins, where the sum is over distinct pairs of spins, from MFT one can write and in terms of the exchange interactions between spin and its neighbors asJohnston2012
| (4a) | |||||
| (4b) | |||||
where is Boltzmann’s constant and is the angle between ordered moments and in the magnetically-ordered state. There is no restriction on the range of the exchange interactions in Eqs. (4), and these can therefore be nearest-neighbor, next-nearest-neighbor, etc., interactions.
From Eq. (4a), the positive value of observed for EuNiGe3 indicates that the dominant interactions between the Eu spins are FM (negative), in spite of the long-range AF ordering. In order to simultaneously satisfy these two conditions within the symmetry constraints of the crystal structure, we propose that the dominant FM interactions are between nearest-neighbor Eu spins in the -plane, with subdominant AF interactions between nearest-neighbor Eu spins in adjacent layers. These interactions give rise to an often-observed A-type AF structure in which FM aligned layers of ordered Eu moments in the -plane are AF aligned with the Eu moments in adjacent Eu planes along the -axis. Our magnetization data for polycrystalline EuNiGe3 cannot determine the axis along which the ordered moments are aligned, but single-crystal measurements could determine that. A-type AF structures were reported for the magnetic Co atoms in single-crystal with the Co ordered moments aligned along the -axis,Cheng2012 ; Ying2012 ; Lamsal2012 and for the magnetic Eu atoms in single-crystal with the Eu ordered moments aligned in the -plane.Xiao2009 Both compounds have the tetragonal -type crystal structure shown in Fig. 2(b).
The Weiss and Néel temperatures for an A-type AF of stacked square lattices as in Fig. 2(a) with only nearest-neighbor interactions are given by Eqs. (4) as
| (5a) | |||||
| (5b) | |||||
where for the A-type stacked square lattice AF, by definition one has for the four nearest-neighbor spin pairs within an plane and for the eight nearest-neighbor spin pairs between adjacent layers along the -axis. In the latter case, due to the lack of a horizontal mirror plane through the body-centered Eu site in the noncentrosymmetric crystal structure in Fig. 2(a), the two values from an Eu spin to the four nearest-neighbor Eu spins in each of the two adjacent -plane layers, respectively, are different. Therefore the derived is an average of the two interplanar interactions. For a spin lattice consisting of square lattices stacked directly above and below each other, the coefficient of in Eqs. (5) would have been 2 instead of 8. From Eqs. (5) one can solve for the two exchange interactions and in terms of the measured values of and , yielding
| (6a) | |||||
| (6b) | |||||
Using K, K and , Eqs. (6) yield
| (7) |
These results quantitatively confirm the above qualitative deduction based on the positive Weiss temperature that the dominant Eu-Eu exchange interactions in the system are ferromagnetic (negative). These we deduce to be the interactions between Eu spins within an -plane layer, whereas the interlayer interactions are antiferromagnetic (positive). In particular, the dominant ( or ) value as well as the dominant value are both negative, where and 8 are the coordination numbers of Eu by Eu for in-plane and out-of-plane , respectively.
For a Heisenberg system of identical crystallographically equivalent spins in the absence of magnetocrystalline anisotropy, our MFT predicts the anisotropic temperature dependence of the susceptibility at for a collinear AF such as the A-type AF to beJohnston2012
| (8a) | |||||
| (8b) | |||||
| (8c) | |||||
| with the Brillouin function and its derivative respectively given by | |||||
where and refer to the magnetic field applied parallel and perpendicular to the easy axis, respectively, the reduced temperature is , and we use the unconventional definition of in Refs. Johnston2011, and Reif1965, . The reduced -dependent ordered moment is where is the magnitude of the ordered moment at and is the saturation moment. The is determined by numerically solving the expression .Johnston2012 ; Johnston2011 Equations (8) predict that and that the susceptibility is isotropic at , i.e., .Johnston2012 The follows the Curie-Weiss law in Eq. (2) and is isotropic for .Johnston2012 ; Johnston2011
In a polycrystalline sample such as ours, it is assumed that the many small crystallites are randomly oriented. Therefore, the can be obtained as the spherical (“powder”) average of the and components to be
| (9) |
This powder average is the same if multiple A-type AF domains occur. Using the values , from Eq. (3) and the observed from Fig. 4(c), the dependence of the powder average susceptibility for obtained from Eqs. (8) and (9) is the green line in Fig. 4(c) with no adjustable parameters. The predicted dependence for in Fig. 4(c) is in reasonable agreement with the measured data (open red circles) plotted in the same figure. The experimental value in in Fig. 4(c) is slightly lower than the MFT prediction, which may arise from a slight deviation from a random distribution of the orientation of the grains in the polycrystalline sample.
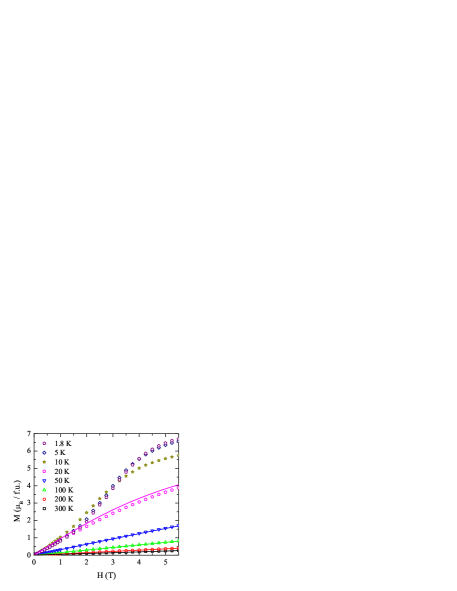
versus isotherms were measured for EuNiGe3 in the range 0–5.5 T at various temperatures as shown in Fig. 5. The MFT prediction per spin in the paramagnetic state at isJohnston2011
| (10) |
where is the magnetization induced in the direction of the applied field by the applied field, and the reduced applied magnetic field is defined as . All of the parameters and in Eq. (10) were already determined above. The isotherms for calculated from numerical solution of Eq. (10), where and is the number of spins, are compared with no adjustable parameters with the corresponding experimental data in Fig. 5. A proportional behavior is predicted and observed for K, whereas negative curvature in is predicted and observed at 20 K. However, the calculated curve for K is slightly above the observed data due to dynamical short-range AF ordering in the sample on approaching K from above, which suppresses the magnetization. Such dynamical short-range ordering effects above are not taken into account in MFT (see also the next section). At temperatures below , the maximum observed magnetization of 6.70 /Eu at K and T is approaching the saturation moment /f.u. expected for Eu+2 with and .
The isotherms below at , 5 and 10 K show an S-shaped dependence on . Qualitatively, this can be explained by a series of field-induced first-order spin-flop transitions where the ordered moments flop to a perpendicular orientation with respect to the applied field. In order for a spin flop transition to occur in a collinear AF, some type of magnetocrystalline anisotropy must be present that aligns the moments along the easy axis at zero field. The first-order spin flop transition does not occur at a single field as observed in a single crystal with the field along the easy axis because of the random orientations of the crystallites in the polycrystalline sample. In a polycrystalline sample, one expects the spin flop field in a grain with its easy axis at an angle to the field to obey . Thus the spin flop field increases with increasing . When the easy axis is perpendicular to the applied field (), a spin flop transition is not possible because the orientation of the ordered moments is already perpendicular (in ) to the field direction. From Fig. 5, we infer that T. A calculation within MFT of the powder-averaged for a polycrystalline sample, incorporating both the anisotropy field and the -dependent distribution of spin flop transition fields, is beyond the scope of the present work.
III.4 Heat capacity measurements
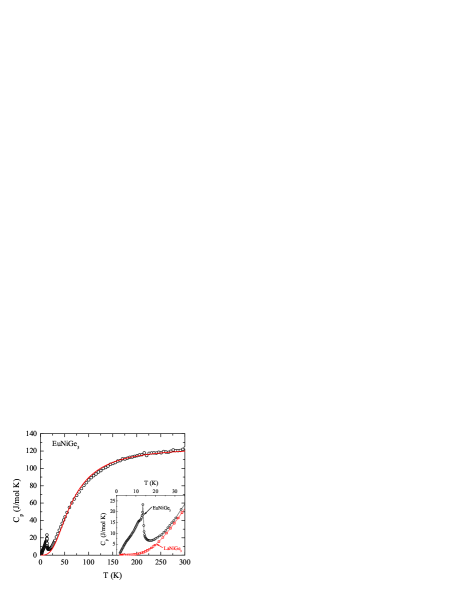
The of EuNiGe3 was measured at in the range 1.8–300 K and the data are plotted in Fig. 6. A sharp -shaped peak is observed at K as shown in more detail in the inset of Fig. 6, confirming that the AF transition observed in the magnetization measurements is a bulk magnetic phase transition. The K) = 122 J/(mol K) is approaching the classical Dulong-Petit high- limit J/(mol K) for the heat capacity of acoustic lattice vibrations at constant volume, where is the number of atoms per formula unit and is the molar gas constant.
The Debye model describes the heat capacity versus due to such lattice vibrations byKittel2005
| (11) |
where is the Debye temperature determined from heat capacity measurements. In addition, for a metal one can add a linear term to Eq. (11) to account for the electronic specific heat contribution, where is the Sommerfeld electronic specific heat coefficient, and for a magnetic material one can add the magnetic contribution .
An accurate analytic Padé approximant of the Debye function that we recently formulated to simplify fitting of experimental data by the Debye theoryGoetsch2012 was used in place of Eq. (11) to fit our data. We fitted our data from to 300 K because below K the magnetic heat capacity contribution becomes significant (see below). Also, because of the presence of , could not be accurately determined from the data. When allowed to vary, it refined to the value 2(2) mJ/mol K2. Therefore, was fixed at zero for the final fit. The only adjustable parameter in the final fit was , which was found to be K. As seen in Fig. 6, a reasonably good fit of the data by the Debye model is obtained over the entire temperature range above 25 K.
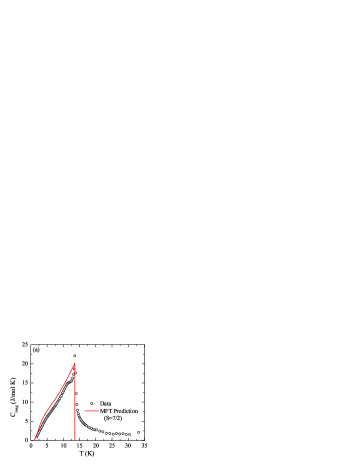
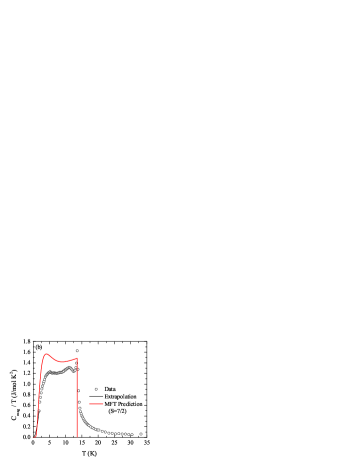
In order to isolate , data for the isostructural nonmagnetic reference compound LaNiGe3 from Ref. Anand2008, was used as a heat capacity background, after correcting for the formula weight (FW) difference by multiplying the temperature scale for of LaNiGe3 by . From the inset of Fig. 6, the renormalized for LaNiGe3 is seen to be a reasonable estimate of the background heat capacity of EuNiGe3. The obtained by subtracting the renormalized of LaNiGe3 from the data for EuNiGe3 is plotted in Fig. 7(a) and is plotted in Fig. 7(b).
MFT predicts that of a Heisenberg spin system containing identical crystallographically equivalent spins, per mole of spins, isJohnston2011
| (12) |
There are no adjustable parameters in this prediction if and are known, as they are here. Comparisons of the predicted and from Eq. (12) with our experimental data are shown in Figs. 7(a) and 7(b), respectively. The hump in the experimental at , which is much more pronounced in the plot of , is reproduced by the MFT calculation. This hump in increases in magnitude as increases, is particularly noticable for , and is not visible for, e.g., .Johnston2011 The hump arises in MFT from the combined effects of the dependence of the energy splitting of the Zeeman levels of the spin due to the dependence of the ordered moment and resulting dependence of the exchange field seen by each moment, together with the dependence of the Boltzmann populations of those levels. The hump in observed at for magnetically ordered compounds containing Eu+2 or Gd+3 with is sometimes misinterpreted as arising from either an electronic magnetic Schottky anomaly that is combined with a magnon contribution to reproduce the observed , as evidence for some type of magnetic phase transition, or as a giant nuclear Schottky anomaly induced by the ordered moments.
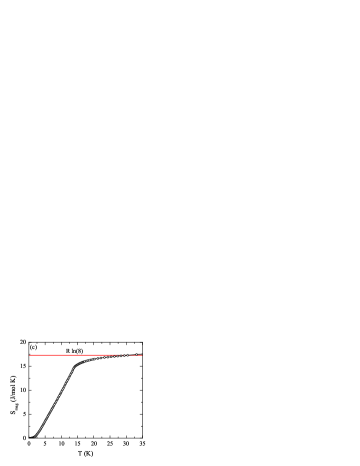
The magnetic contribution to the entropy was calculated from the derived from our experiments according to
| (13) |
Because data were not obtained below 1.8 K, the data were extrapolated from K to using, for simplicity, the dependence predicted by spin wave theory for a three-dimensional AF in the absence of an anisotropy gap. The calculated entropy between and 1.8 K on the basis of this extrapolation is 0.30 J/mol K. This is an upper limit since the presence of an anisotropy gap would instead give an exponential decrease in below 1.8 K. As seen in Fig. 7(c), the molar saturates to the value expected from quantum statistics according to , where for Eu+2. Even though the MFT prediction has significant deviations from the measured data at in Fig. 7(b), the area (magnetic entropy) between the calculated and observed data that is missing below is recovered above . The finite for arises from dynamical spin correlations at , as often observed, that are not taken into account by MFT. As a result, J/mol K is 83% of the asymptotic high- limit, with the remainder recovered by .
IV Summary and Conclusions
| Compound | Ref. | ||||||||
|---|---|---|---|---|---|---|---|---|---|
| (Å) | (Å) | (K) | (K) | (cm3 K/mol) | () | (K) | (K) | ||
| EuNiGe3 | 4.3366(1) | 9.8802(2) | 13.6 | 5.3(3) | 7.66(2) | 7.83(2) | 268(2) | 265(2) | This work |
| EuNi2Ge2 | 30.8 | 9.7 | 7.69 | Budko1999, | |||||
| EuNi2Ge2 | 4.144(3) | 10.15(1) | 30 | 8 | 7.7 | Felner1978, |
A nearly single-phase polycrystalline sample of EuNiGe3 was synthesized and its physical properties were investigated. Rietveld refinements of the powder XRD data confirmed that this compound crystallizes in the body-centered-tetragonal BaNiSn3-type structure with space group as previously reported. The , and measurements consistently reveal an AF ordering transition at K. A summary of some of the results from these measurements is given in Table 2.
The measurements of EuNiGe3 reveal metallic behavior. The large indicates the high quality of the sample. The data for are well-described by the Bloch-Grüneisen theory for the -dependent resistivity arising from electron-phonon scattering. A fit to the data for K by the theory yielded a Debye temperature K. The decreases rapidly on cooling below due to loss of spin-disorder scattering. Since the compound is metallic, the magnetic coupling between the Eu spins likely arises mainly from the indirect RKKY interaction mediated by the conduction electrons.
The and measurements of EuNiGe3 showed the presence of long-range AF order in this system at K. A fit of by the Curie-Weiss law at K revealed a Curie constant consistent with the presence of Eu+2 ions with and , and a positive Weiss temperature K, indicating that ferromagnetic interactions are dominant despite the occurrence of long-range AF ordering. There was no evidence from our measurements that the Ni atoms are magnetic. A low-field measurement at was compared with our predictionJohnston2012 from MFT for the polycrystalline average of the anisotropic of a collinear antiferromagnet below its Néel temperature and good agreement was found. Carrying out such a fit for a polycrystalline AF was one of the goals of this work as discussed in the introduction. A field-induced spin flop transition was inferred from the S-shaped curves at , with a low- onset field of T that was spread out to higher fields due to the polycrystalline nature of the sample.
The presence of dominant FM interactions in EuNiGe3 that orders antiferromagnetically led us to propose that these interactions are between Eu spins within the -plane, with subdominant AF interactions between spins in adjacent planes along the -axis. From these interactions, we propose that the collinear AF structure is A-type, in which the Eu spins within an -plane in Fig. 2(a) are aligned ferromagnetically with respect to each other and the spins in adjacent layers along the -axis are aligned antiferromagnetically to each other. The most likely ordered moment axis is either the -axis or an axis in the -plane. If it is the -axis, magnetocrystalline anisotropy effects would presumably not cause a distortion of the crystal structure on cooling below . However, if the ordered moments are in the -plane, the A-type collinear ordering breaks the fourfold rotational symmetry about the axis of the tetragonal room-temperature crystal structure, and an orthorhombic crystal distortion may be expected to occur on cooling below .
Our data were fitted by the Debye model from K to 300 K, yielding a Debye temperature K. This value is the same within the error bars as the Debye temperature K determined from the measurements, a rare occurrence.Goetsch2012 The data exhibited a sharp -shaped peak at , which allowed the precise value of the Néel temperature to be determined to be K. The magnetic heat capacity contribution and the magnetic entropy were extracted and analyzed by MFT. The high- limiting value of the entropy is consistent with our data that indicated . Significant short-range AF correlations occur above , with about 83% of the maximum magnetic entropy present at and the remaining 17% recovered by .
As shown in Fig. 2, EuNiGe3 crystallizes in the BaNiSn3-type structure which is similar to the ThCr2Si2-type structure. In fact, the compound EuNi2Ge2 crystallizes in the latter structure and its properties have been measured.Budko1999 ; Felner1978 The Eu sublattices in the two compounds are identical and the Ni atoms in both compounds are believed to be nonmagnetic. Therefore, we compare some properties of these two compounds in Table 2. Both compounds contain Eu+2 ions with and and order antiferromagnetically with EuNiGe3 having the lower . A significant difference between these compounds is the positive in EuNiGe3, indicating dominant FM interactions as discussed above, and a negative one in EuNi2Ge2 indicating dominant AF interactions. This difference indicates that the magnetic interactions between the Eu spins are quite different in the two compounds and therefore suggests that the resultant AF structures may also be different. As discussed above, we propose that EuNiGe3 has an A-type AF structure. The anisotropic measurements on EuNi2Ge2 single crystalsBudko1999 suggest that the ordered moments lie in the -plane with a collinear AF structure and multiple AF domains. Alternatively, a comparison of our recent predictionsJohnston2012 of the anisotropic of planar noncollinear AFs with the dataBudko1999 for EuNi2Ge2 suggests that this compound may have a planar noncollinear AF structure with the ordered moments aligned within the -plane. It would be useful and interesting to determine the AF structures of both EuNiGe3 and EuNi2Ge2 by magnetic neutron or x-ray scattering measurements and to correlate the results with the respective data for these compounds.
Acknowledgements.
This research was supported by the U.S. Department of Energy, Office of Basic Energy Sciences, Division of Materials Sciences and Engineering. Ames Laboratory is operated for the U.S. Department of Energy by Iowa State University under Contract No. DE-AC02-07CH11358.References
- (1) C. Kittel, Introduction to Solid State Physics, Eighth Edition (John Wiley & Sons, Inc., New York, 2005).
- (2) J. H. Van Vleck, J. Chem. Phys. 9, 85 (1941).
- (3) D. C. Johnston, Phys. Rev. Lett. 109, 077201 (2012).
- (4) D. C. Johnston, R. J. McQueeney, B. Lake, A. Honecker, M. E. Zhitomirsky, R. Nath, Y. Furukawa, V. P. Antropov, and Y. Singh, Phys. Rev. B 84, 094445 (2011).
- (5) A. Yoshimori, J. Phys. Soc. Jpn. 14, 807 (1959).
- (6) B. D. Oniskovets, O. I. Bodak, and O. E. Goral, Doklady Akademii Nauk Ukrainskoi SSR, Seriya B 8 47 (1987).
- (7) P. Salamakha, M. Konyk, O. Sologub, and O. Bodak, J. Alloys Compd. 236, 206 (1996).
- (8) E. D. Mun, S. L. Bud’ko, H. Ko, G. J. Miller, and P. C. Canfield, J. Magn. Magn. Mater. 322, 3527 (2010).
- (9) J. Rodriguez-Carvajal, Physica B (Amsterdam) 192, 55 (1993); see also www.ill.eu/sites/fullprof/.
- (10) E. Parthé, B. Chabot, H. F. Braun, and N. Engel, Acta Crystallogr. B 39, 588 (1983).
- (11) B. R. Coles, Adv. Phys. 7, 40 (1958).
- (12) J. M. Ziman, Electrons and Phonons (Oxford Univ. Press, New York, 1960).
- (13) F. J. Blatt, Physics of Electronic Conduction in Solids (McGraw-Hill Inc., New York, 1968).
- (14) R. J. Goetsch, V. K. Anand, A. Pandey, and D. C. Johnston, Phys. Rev. B 85, 054517 (2012).
- (15) D. Kaczorowski, B. Belan, and R. Gladyshevskii, Solid State Commun. 152, 839 (2012).
- (16) P. Liu and J. Tang, Phys. Rev. B 85, 224417 (2012).
- (17) B. Cheng, B. F. Hu, R. H. Yuan, T. Dong, A. F. Fang, Z. G. Chen, G. Xu, Y. G. Shi, P. Zheng, J. L. Luo, and N. L. Wang, Phys. Rev. B 85, 144426 (2012).
- (18) J. J. Ying, Y. J. Yan, A. F. Wang, Z. J. Xiang, P. Cheng, G. J. Ye, and X. H. Chen, Phys. Rev. B 85, 214414 (2012).
- (19) J. Lamsal, et al. (unpublished).
- (20) Y. Xiao, Y. Su, M. Meven, R. Mittal, C. M. N. Kumar, T. Chatterji, S. Price, J. Persson, N. Kumar, S. K. Dhar, A. Thamizhavel, and Th. Brueckel, Phys. Rev. B 80, 174424 (2009).
- (21) F. Reif, Fundamentals of Statistical and Thermal Physics (McGraw-Hill, New York, 1965), p. 259.
- (22) V. K. Anand, Z. Hossain, and C. Geibel, Solid State Commun. 146, 335 (2008).
- (23) S. L. Bud’ko, Z. Islam, T. A. Wiener, I. R. Fisher, A. H. Lacerda, and P. C. Canfield, J. Magn. Magn. Mater. 205, 53 (1999).
- (24) I. Felner and I. Nowik, J. Phys. Chem. Solids 39, 767 (1978).