On the cool gaseous haloes of quasars
Abstract
We present optical spectroscopy of projected QSO pairs to investigate the
Mg II and the C IV absorption features imprinted on the spectrum
of the background object by the gaseous halo surrounding the foreground QSO.
We observed 13 projected pairs in the redshift range
spanning projected separations between 60 kpc and 120 kpc.
In the spectra of the background QSOs, we identify Mg II intervening
absorption systems associated to the foreground QSOs in 7 out of 10 pairs,
and 1 absorption system out of 3 is found for C IV.
The distribution of the equivalent width as a function of the impact parameter
shows that, unlike the case of normal galaxies, some strong absorption
systems (EWr1 Å) are present also beyond a projected radius of kpc.
If we take into account the mass of the galaxies as an additional parameter that
influence the extent of the gaseous haloes, the distribution of the absorptions
connected to the QSOs is consistent to that of galaxies. In the spectra
of the foreground QSOs we do not detect any Mg II absorption lines originated by the
gas surrounding the QSO itself, but in 2 cases these features are present for C IV.
The comparison between the absorption features observed in the transverse
direction and those along the line of sight allows us to comment on the
distribution of the absorbing gas and on the emission properties of the
QSOs.
Based on observations undertaken at the European Southern Observatory (ESO) Very Large Telescope (VLT) under Programmes 085.B-0210(A) and 086.B-0028(A).
keywords:
galaxies: haloes — quasars: general — quasars: absorption lines1 Introduction
Absorption lines in quasar (QSO) spectra provide a unique tool for probing the gas and dust content of foreground galaxies and of intergalactic medium at almost any redshift. Since the works of Bahcall & Spitzer (1969) and Boksenberg & Sargent (1978) these features are considered to be linked to large gaseous haloes around galaxies extending up to kpc (see the review by Churchill, Kacprzak, & Steidel, 2005). Despite a number of studies aimed at connecting metal absorption systems (in particular Mg II and C IV) with galaxy properties (e.g., Young, Sargent, & Boksenberg, 1982; Lanzetta, Turnshek, & Wolfe, 1987; Bergeron & Boissé, 1991; Steidel & Sargent, 1992; Steidel, Dickinson, & Persson, 1994; Churchill et al., 1999; Rigby, Charlton, & Churchill, 2002; Nestor, Turnshek, & Rao, 2005; Bergeron, Boissé, & Ménard, 2011), the origin of the absorbing gas is still unclear. However, in the last decades, it is progressively emerging a scenario in which the stronger absorption lines (rest frame equivalent width EWr Å) are linked to winds driven by the star formation activity, while the weaker one are associated with inflows of gas onto the host galaxies.
For instance, Zibetti et al. (2007), stacking SDSS images of 2800 Mg II absorbers with , show that the stronger absorption systems reside preferentially in blue star–forming galaxies, while the weaker ones in red passive galaxies. This result was confirmed by Ménard et al. (2011) in a sample of 8500 Mg II absorption systems present in the SDSS QSO spectra. They discovered a strong correlation between the EWr of the absorbers and the luminosity of the associated [O II] lines, considered as a tracer of the star formation rate (SFR) of galaxies. Prochter, Prochaska, & Burles (2006) investigated the evolution of the number density of Mg II strong absorption systems and found rough correspondence with the evolution of the star formation rate at redshifts between and , suggesting a link between the two phenomena. Recently Nestor et al. (2011) reported clear evidence that ultrastrong Mg II absorbers (EWr Å) reside in galaxies with very high SFRs. In addition to that, spectroscopic observations of highly star forming galaxies reveals the presence of blueshifted Mg II absorption features, further supporting the outflowing winds scenario (Tremonti, Moustakas, & Diamond-Stanic, 2007; Weiner et al., 2009; Rubin et al., 2010; Martin et al., 2012).
The existence of a link between galaxy luminosity/halo mass and strength of absorption features, expected in the infalling scenario, is still debated. Chen, Lanzetta, & Webb (2001) and Chen et al. (2010a) found that the EWr and the extent of Mg II and C IV absorption systems are related to host galaxy luminosity. More directly, Chen et al. (2010a) searched for absorption systems in a sample of 94 galaxies at redshifts between and within kpc from a QSO sightline. The EWr of the systems found (the great majority of which have EWr Å) scales with the stellar mass and only little with the star formation rate of the host galaxies (Chen et al., 2010b). These results are interpreted considering that Mg II absorption systems arise from infalling clouds to fuel star formation. Kacprzak et al. (2011) directly compared the relative Mg II halo gas and host galaxy kinematics for 13 L⋆ galaxies at . They found that these galaxies have low SFRs and a kinematically quiescent interstellar medium containing no outflowing gas. Given that these galaxies live in isolated environment, they suggest a scenario in which the cool gas halo was infalling and providing a gas reservoir that could maintain the low levels of star formation within the host galaxies. Bowen & Chelouche (2011), in a sample of Luminous Red Galaxies (LRGs) with redshifts , found a low covering factor () for absorber with EWr Å and a lack of correlation between EWr and impact parameter or r–band absolute magnitude of the galaxies. They suggested that this is due or to the rich environment of these objects that makes their haloes too hot to maintain cool gas, or to the low rates of star formation that are not intense enough to fill their haloes with Mg II clouds. Cross correlating Mg II absorption systems and the properties of LRGs Bouché et al. (2006) found at redshift an anti–correlation between the halo mass and the EWr of absorbers (most of which have EWr Å), which suggests that the Mg II absorption systems are not virialised within the haloes. These results were further confirmed in larger sample by Lundgren et al. (2009) and by Gauthier, Chen, & Tinker (2009). Intriguingly, Rubin et al. (2012) detect inflow of gas into isolated star–forming galaxies at .
In contrast to the large attention given to absorptions detected around normal galaxies, only few studies have been focused on the properties of the gaseous halo of galaxies hosting a QSO in their centre. The observation of projected QSO pairs allows to probe the properties of the foreground QSO (QSOF, ), through the study of absorption features imprinted on the background QSO spectra (QSOB, ). The standard model on the origin of QSO high luminosity requires an intense gas accretion on a supermassive black hole that dramatically increases its activity. Feasible mechanisms responsible for the gas infall are instabilities caused by strong gravitational interactions and galaxy mergers (e.g., Canalizo et al., 2007; Bennert et al., 2008; Green et al., 2010). The close (few hundreds kiloparsecs) environment of QSOs is expected to be populated by tidal debris, streams, and diffuse cool gas clouds, as commonly observed in interacting galaxies (e.g., Sulentic et al., 2001; Cortese et al., 2006). Given their low surface brightness, most of the properties of these features could be investigated almost exclusively in absorption, especially at high redshift.
Some studies have been performed to analyse the distribution of neutral hydrogen around QSOs. For instance Hennawi et al. (2006), starting from a sample of 149 projected QSO pairs (projected distance: kpc Mpc; redshift: ), found that the probability to have an absorber with cm-2 coincident within 200 kpc with a QSOF is high (), and that the distribution of these absorbers is highly anisotropic (Hennawi & Prochaska 2007, see also Kirkman & Tytler 2008; Prochaska & Hennawi 2009). The study of projected QSO pairs gives also the possibility to investigate the so–called transverse proximity effect: i.e., the expected decrease of absorption systems in the Ly forest of a QSOB due to the ionising flux of a QSOF. Intriguingly the many attempts to measure this effect, with perhaps one exception (Gallerani et al., 2008), have led to only marginal or no detection (e.g., Crotts, 1989; Dobrzycki & Bechtold, 1991; Liske & Williger, 2001; Schirber, Miralda-Escudé, & McDonald, 2004). The presence of a transverse proximity effect for heavier elements is still unclear. For instance it was observed for He II by Worseck & Wisotzki (2006), but not for Mg II (Bowen et al., 2006) or for C IV (Tytler et al., 2009).
Up to now, only a few metal absorption systems associated or near to a QSO have been serendipitously discovered (e.g., Shaver, Boksenberg, & Robertson, 1982; Shaver & Robertson, 1983, 1985; Decarli, Treves, & Falomo, 2009). The limited statistics is due to the little number of known close projected QSO pairs. Even the large spectroscopic QSO catalogue of the Sloan Digital Sky Survey, made of more than 100000 objects (Schneider et al., 2010), contains only 22 QSO pairs with separation less than . One should recall that the fiber collisions prevents the spectroscopic observations of two sources with separations below in a single plate.
Tytler et al. (2009) studied the distribution of metal absorption features (in most case C IV) present in the spectra of 170 close () projected QSO pairs with separations kpc Mpc in order to investigate their Mpc scale clustering properties around QSOs and other absorbers. They found 16 absorbers within km/s from the QSOF, all with kpc, that cluster with an approximately isotropic distribution, with a hint of an excess for systems with redshift .
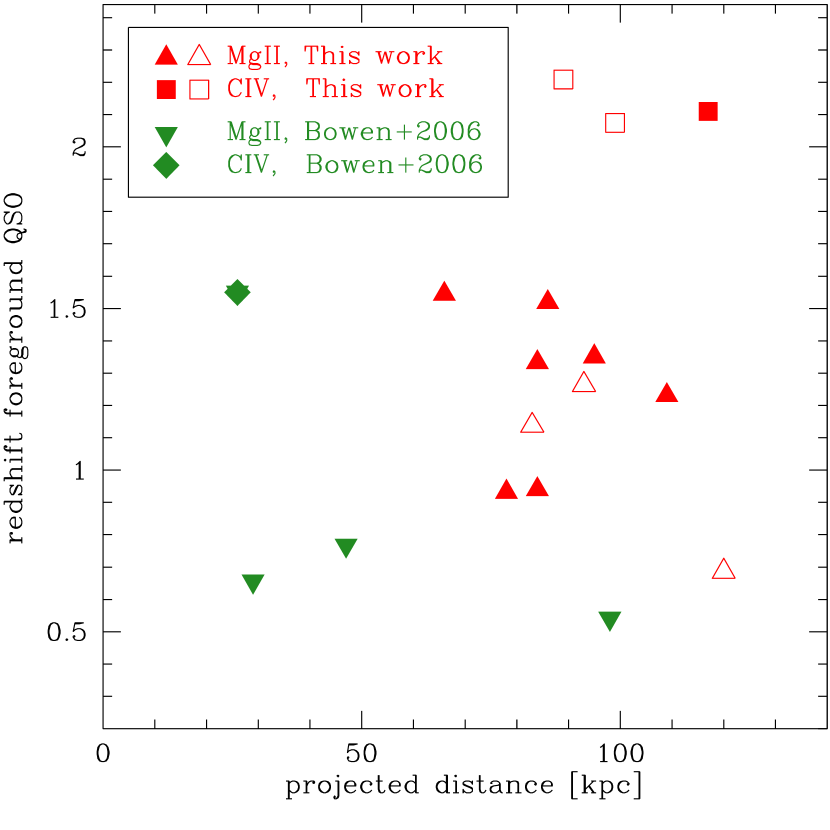
Bowen et al. (2006) select from the sample of projected QSO systems of Hennawi et al. (2006) 4 the pairs with kpc and . In all these systems they detect Mg II absorption lines clearly associated to QSOF (see Figure 1). Despite the small sample size, they speculate that the absence of corresponding absorption lines in the spectra of QSOF involve a non isotropic distribution of the absorbing gas. On the basis of these data Chelouche et al. (2008) proposed that the gas in the outer region of QSOs (i.e., at radius larger than kpc) is distributed in the same way of galaxies, but their thermal and ionisation structure is highly influenced by the central black hole emission.
In this paper we search for Mg II and C IV absorption features in a sample of 13 projected pairs. The aim of this work is to investigate the physical properties and the spatial distribution of the cool gas associated to the halo of QSOs. It is worth noting that the considered ions have very different ionisation energies, probing different gas conditions. The properties of the detected features are compared with those found in normal galaxies (i.e., galaxies not hosting a QSO) in order to investigate the effects of the central black hole emission on the cool gas.
We present our sample in §2 and the data reduction and analysis in §3. In §4 we investigate the properties of the detected absorption systems. In §5 we compare and contrast our results with those found in galaxies. We conclude and summarise in §6.
Throughout this paper we consider a concordance cosmology with H km/s/Mpc, , and .
2 The sample
We searched in the Véron-Cetty & Véron (2010) quasar catalogue for projected pairs that match the following requirements: (i) the angular separation is that, at the redshifts considered in our sample (i.e., ), allows us to explore the outer regions of a typical galaxy halo (i.e., from 60 to 120 kpc); (ii) the redshifts of fore– and back–ground QSOs combine so that the C IV and Mg II emissions of the QSOF fall within the wavelength range observed with FORS2 GRISM 1400V or GRISM 1200R, avoiding important sky features or narrow emission lines in the spectrum of the QSOB; (iii) targets have declination , so that they are visible from the Paranal site; and finally (iv) the QSOB is brighter than m in order to collect spectra with signal–to–noise . The resulting sample consists of 19 close pairs, 13 of which were observed with FORS2 at VLT.
In Table 1 and in Figure 1 we present the general properties of the 13 observed pairs. These are radio quiet QSOs, with an average angular separation of 11.4′′ that corresponds to an average projected distance of kpc. In our sample we do not take into account the presence of absorption a priori, thus it seems suitable to estimate the unbiased frequency of absorption systems.
| QSOF | ID | VF | VB | pd | Lbol,F | MBH,F | See. | S/NF | S/NB | |||
|---|---|---|---|---|---|---|---|---|---|---|---|---|
| [arcsec] | [kpc] | [ erg/s] | [] | [arcsec] | ||||||||
| SDSSJ00022-0053B | QQ01 | 1.542 | 2.205 | -24.83 | -26.66 | 7.8 | 66 | 0.890.04 | 12.3 | 0.71 | 12 | 13 |
| 2QZJ003954-2725C | QQ02 | 1.262 | 2.100 | -24.29 | -23.96 | 11.1 | 93 | 0.560.01 | 6.2 | 0.84 | 20 | 10 |
| 2QZJ004344-3000B | QQ03 | 1.346 | 1.554 | -22.67 | -24.71 | 11.3 | 95 | 0.270.03 | 4.6 | 0.88 | 10 | 14 |
| SDSSJ00541-0946B | QQ04 | 2.113 | 2.113 | -25.59 | -28.05 | 14.1 | 117 | 1.890.02 | 13.7 | 1.41 | 49 | 20 |
| Q0059-2702B | QQ05 | 0.941 | 1.963 | -24.96 | -23.95 | 10.7 | 84 | 2.230.06 | 10.4 | 1.35 | 41 | 22 |
| 2QZJ011050-2719 | QQ06 | 1.332 | 2.254 | -23.59 | -24.86 | 10.0 | 84 | 0.600.02 | 6.8 | 1.36 | 23 | 10 |
| 2QZJ101636-0234A | QQ07 | 1.518 | 3.448 | -25.65 | -26.64 | 10.1 | 86 | 2.110.13 | 9.9 | 0.75 | 15 | 15 |
| 2QZJ102425+0013A | QQ08 | 1.138 | 2.350 | -23.99 | -26.13 | 10.1 | 83 | 0.210.05 | 0.9 | 1.18 | 6 | 9 |
| SDSSJ11318-0222A | QQ09 | 2.198 | 2.353 | -25.65 | -26.95 | 10.8 | 89 | 0.540.11 | 6.5 | 2.35 | 5 | 5 |
| SDSSJ22028+1236A | QQ10 | 2.063 | 2.504 | -26.80 | -26.35 | 11.8 | 99 | 4.090.11 | 24.4 | 0.89 | 31 | 16 |
| SDSSJ22067-0039A | QQ11 | 1.230 | 1.516 | -25.32 | -25.60 | 13.1 | 109 | 1.410.09 | 10.3 | 0.71 | 16 | 11 |
| 2QZJ222446-3200 | QQ12 | 0.689 | 0.731 | -23.32 | -22.99 | 17.0 | 120 | 0.340.03 | 1.3 | 0.79 | 29 | 18 |
| Q2225-4023B | QQ13 | 0.931 | 2.398 | -23.51 | -26.24 | 9.9 | 78 | 0.260.02 | 3.5 | 0.99 | 20 | 22 |
3 Observations and data Analysis
3.1 Observations and data reduction
Spectra of the projected QSO pairs were collected with the VLT Antu telescope at the ESO Paranal observatory. Observations were performed with GRISM 1200R and 1400V on the FOcal Reducer/low dispersion Spectrograph (FORS2, see Appenzeller et al., 1998), yielding a spectral resolution of R(1200R)=2900 and R(1400V)=2800 (with the 1′′ slit). Typical exposure times are seconds ( seconds for fainter objects). The only exceptions are QQ08 and QQ09, for which exposures no longer than 2600 seconds were allowed by poor weather conditions.
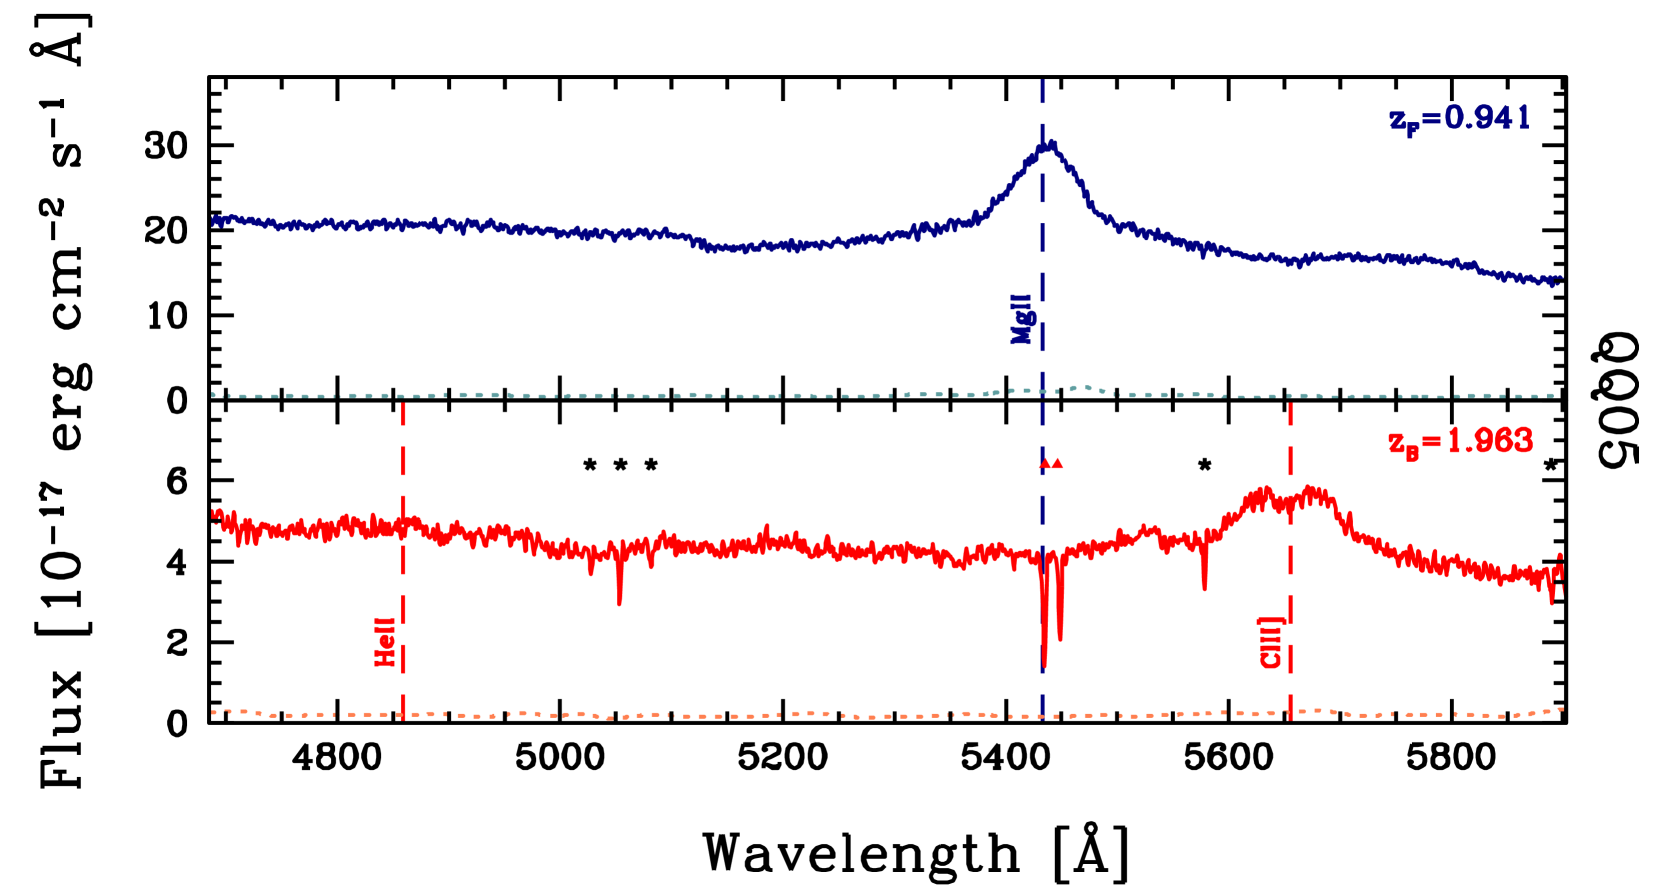
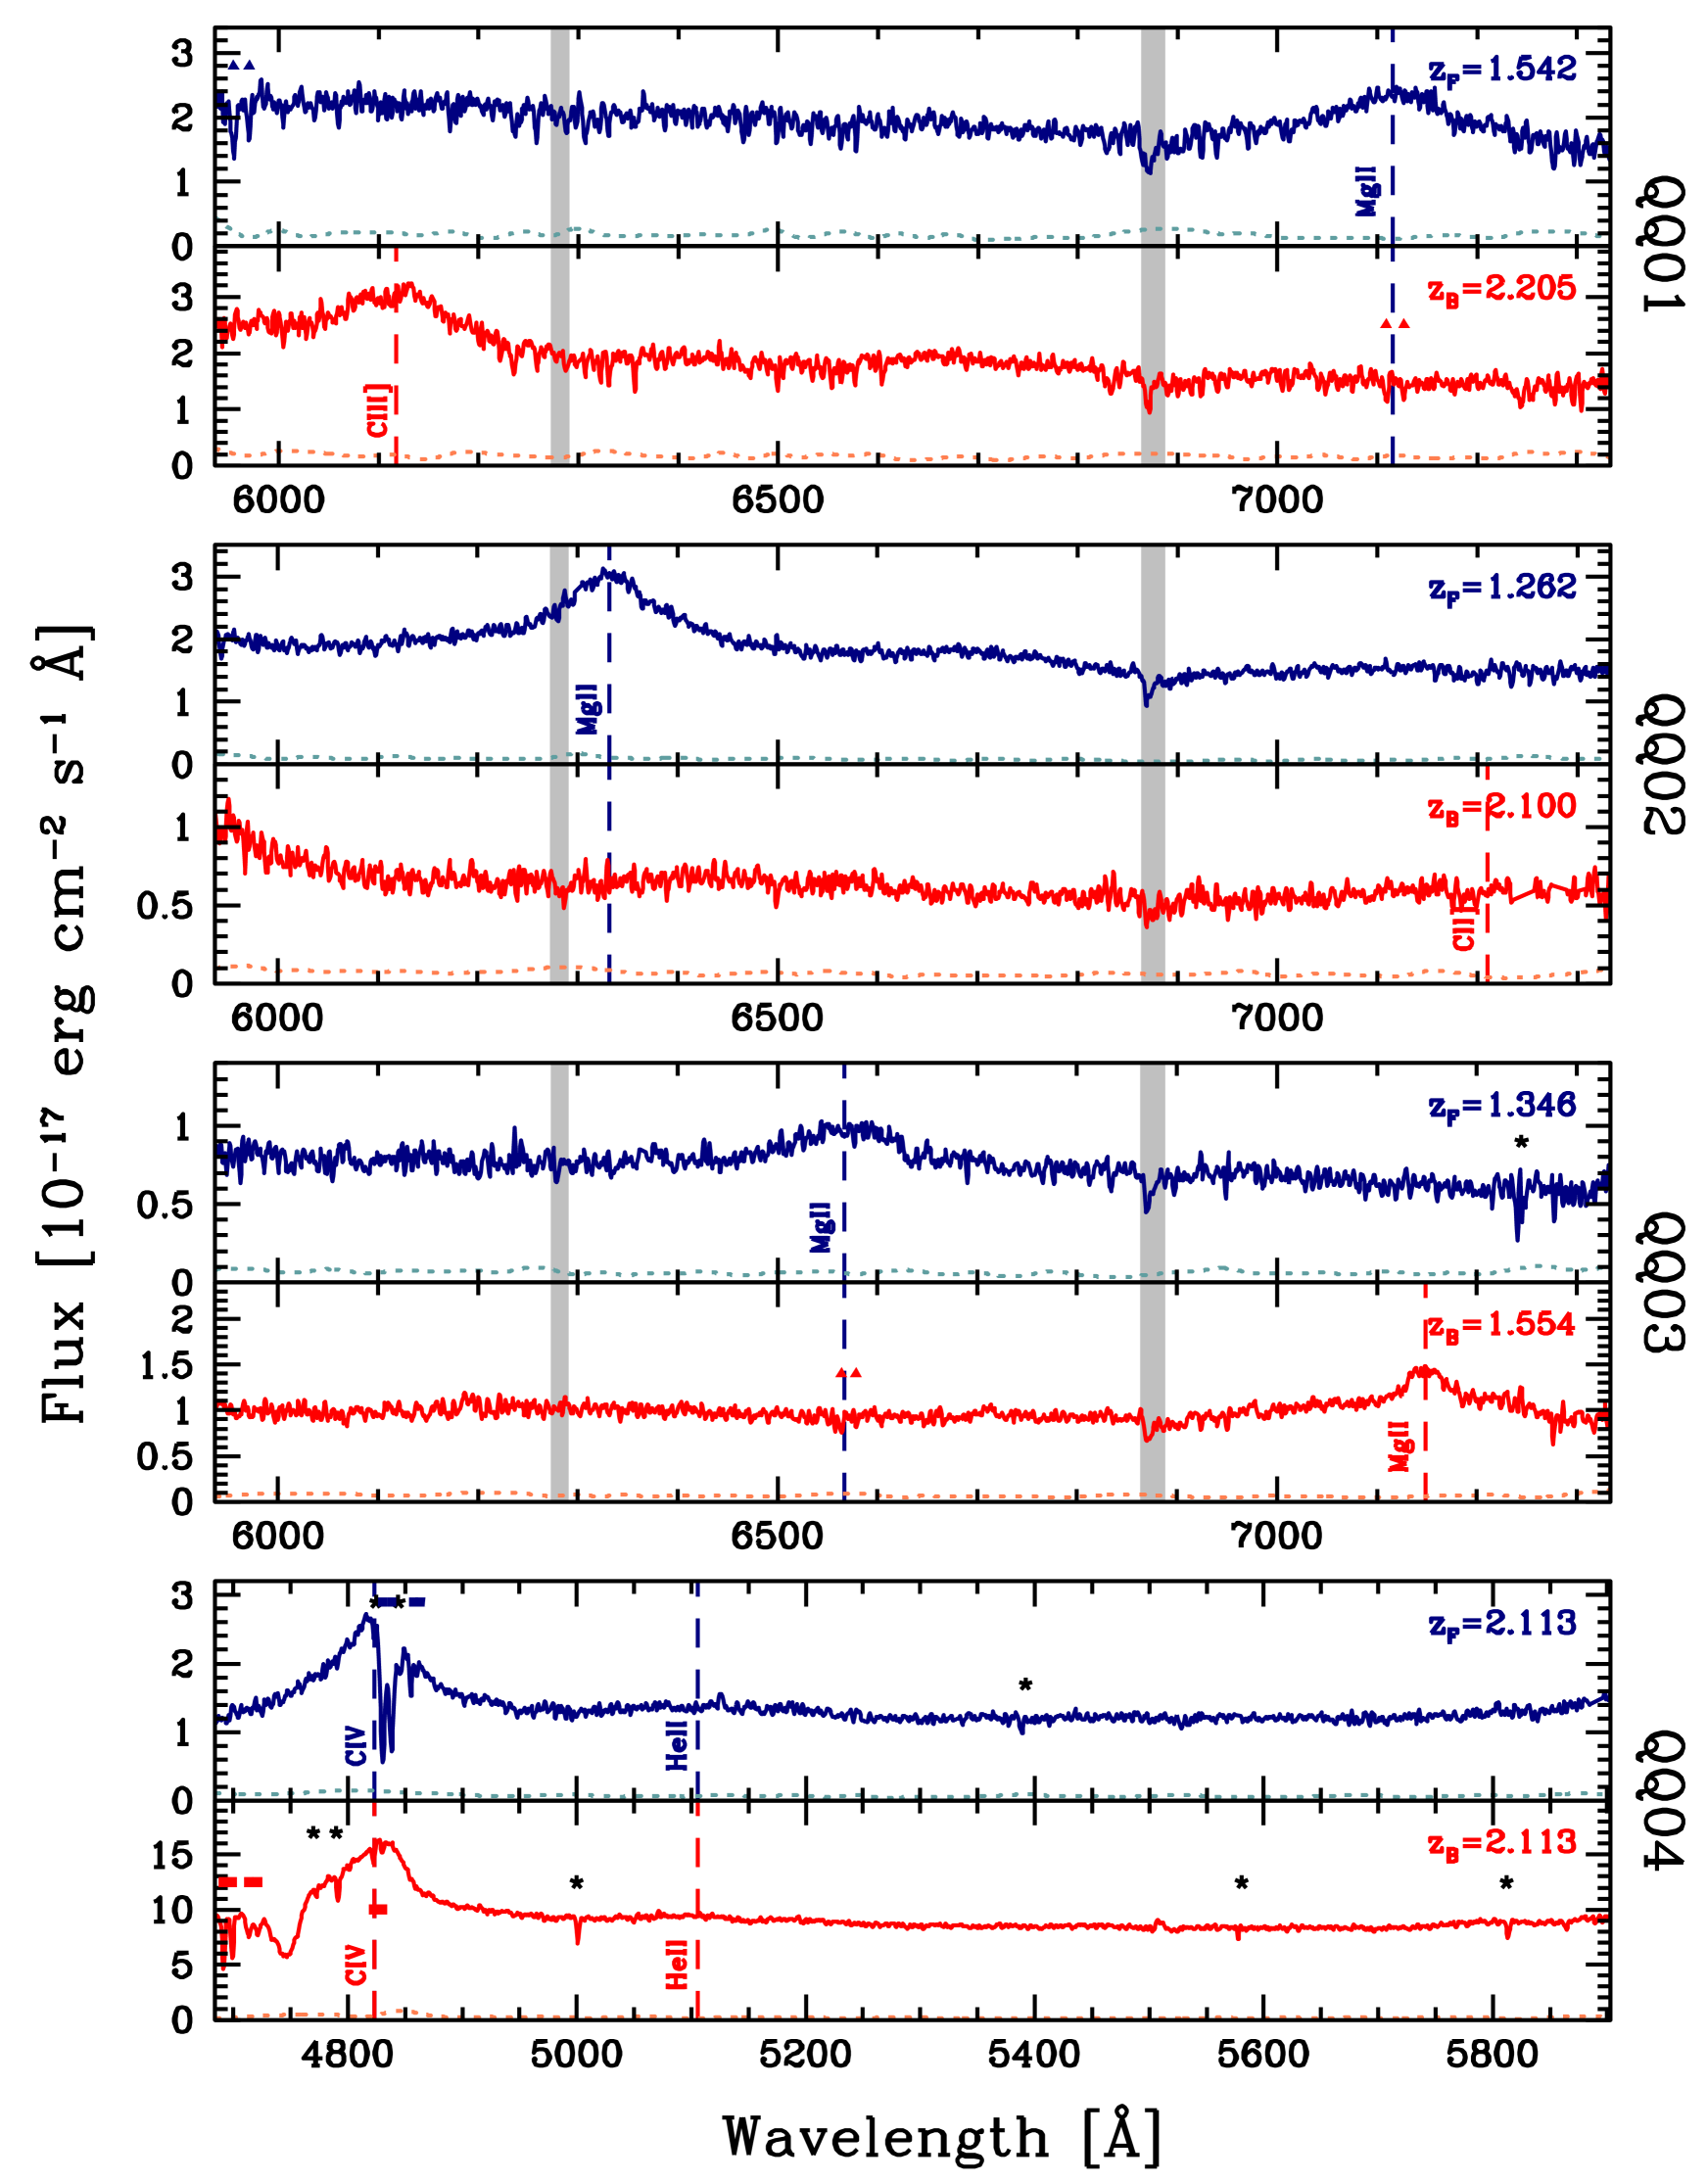
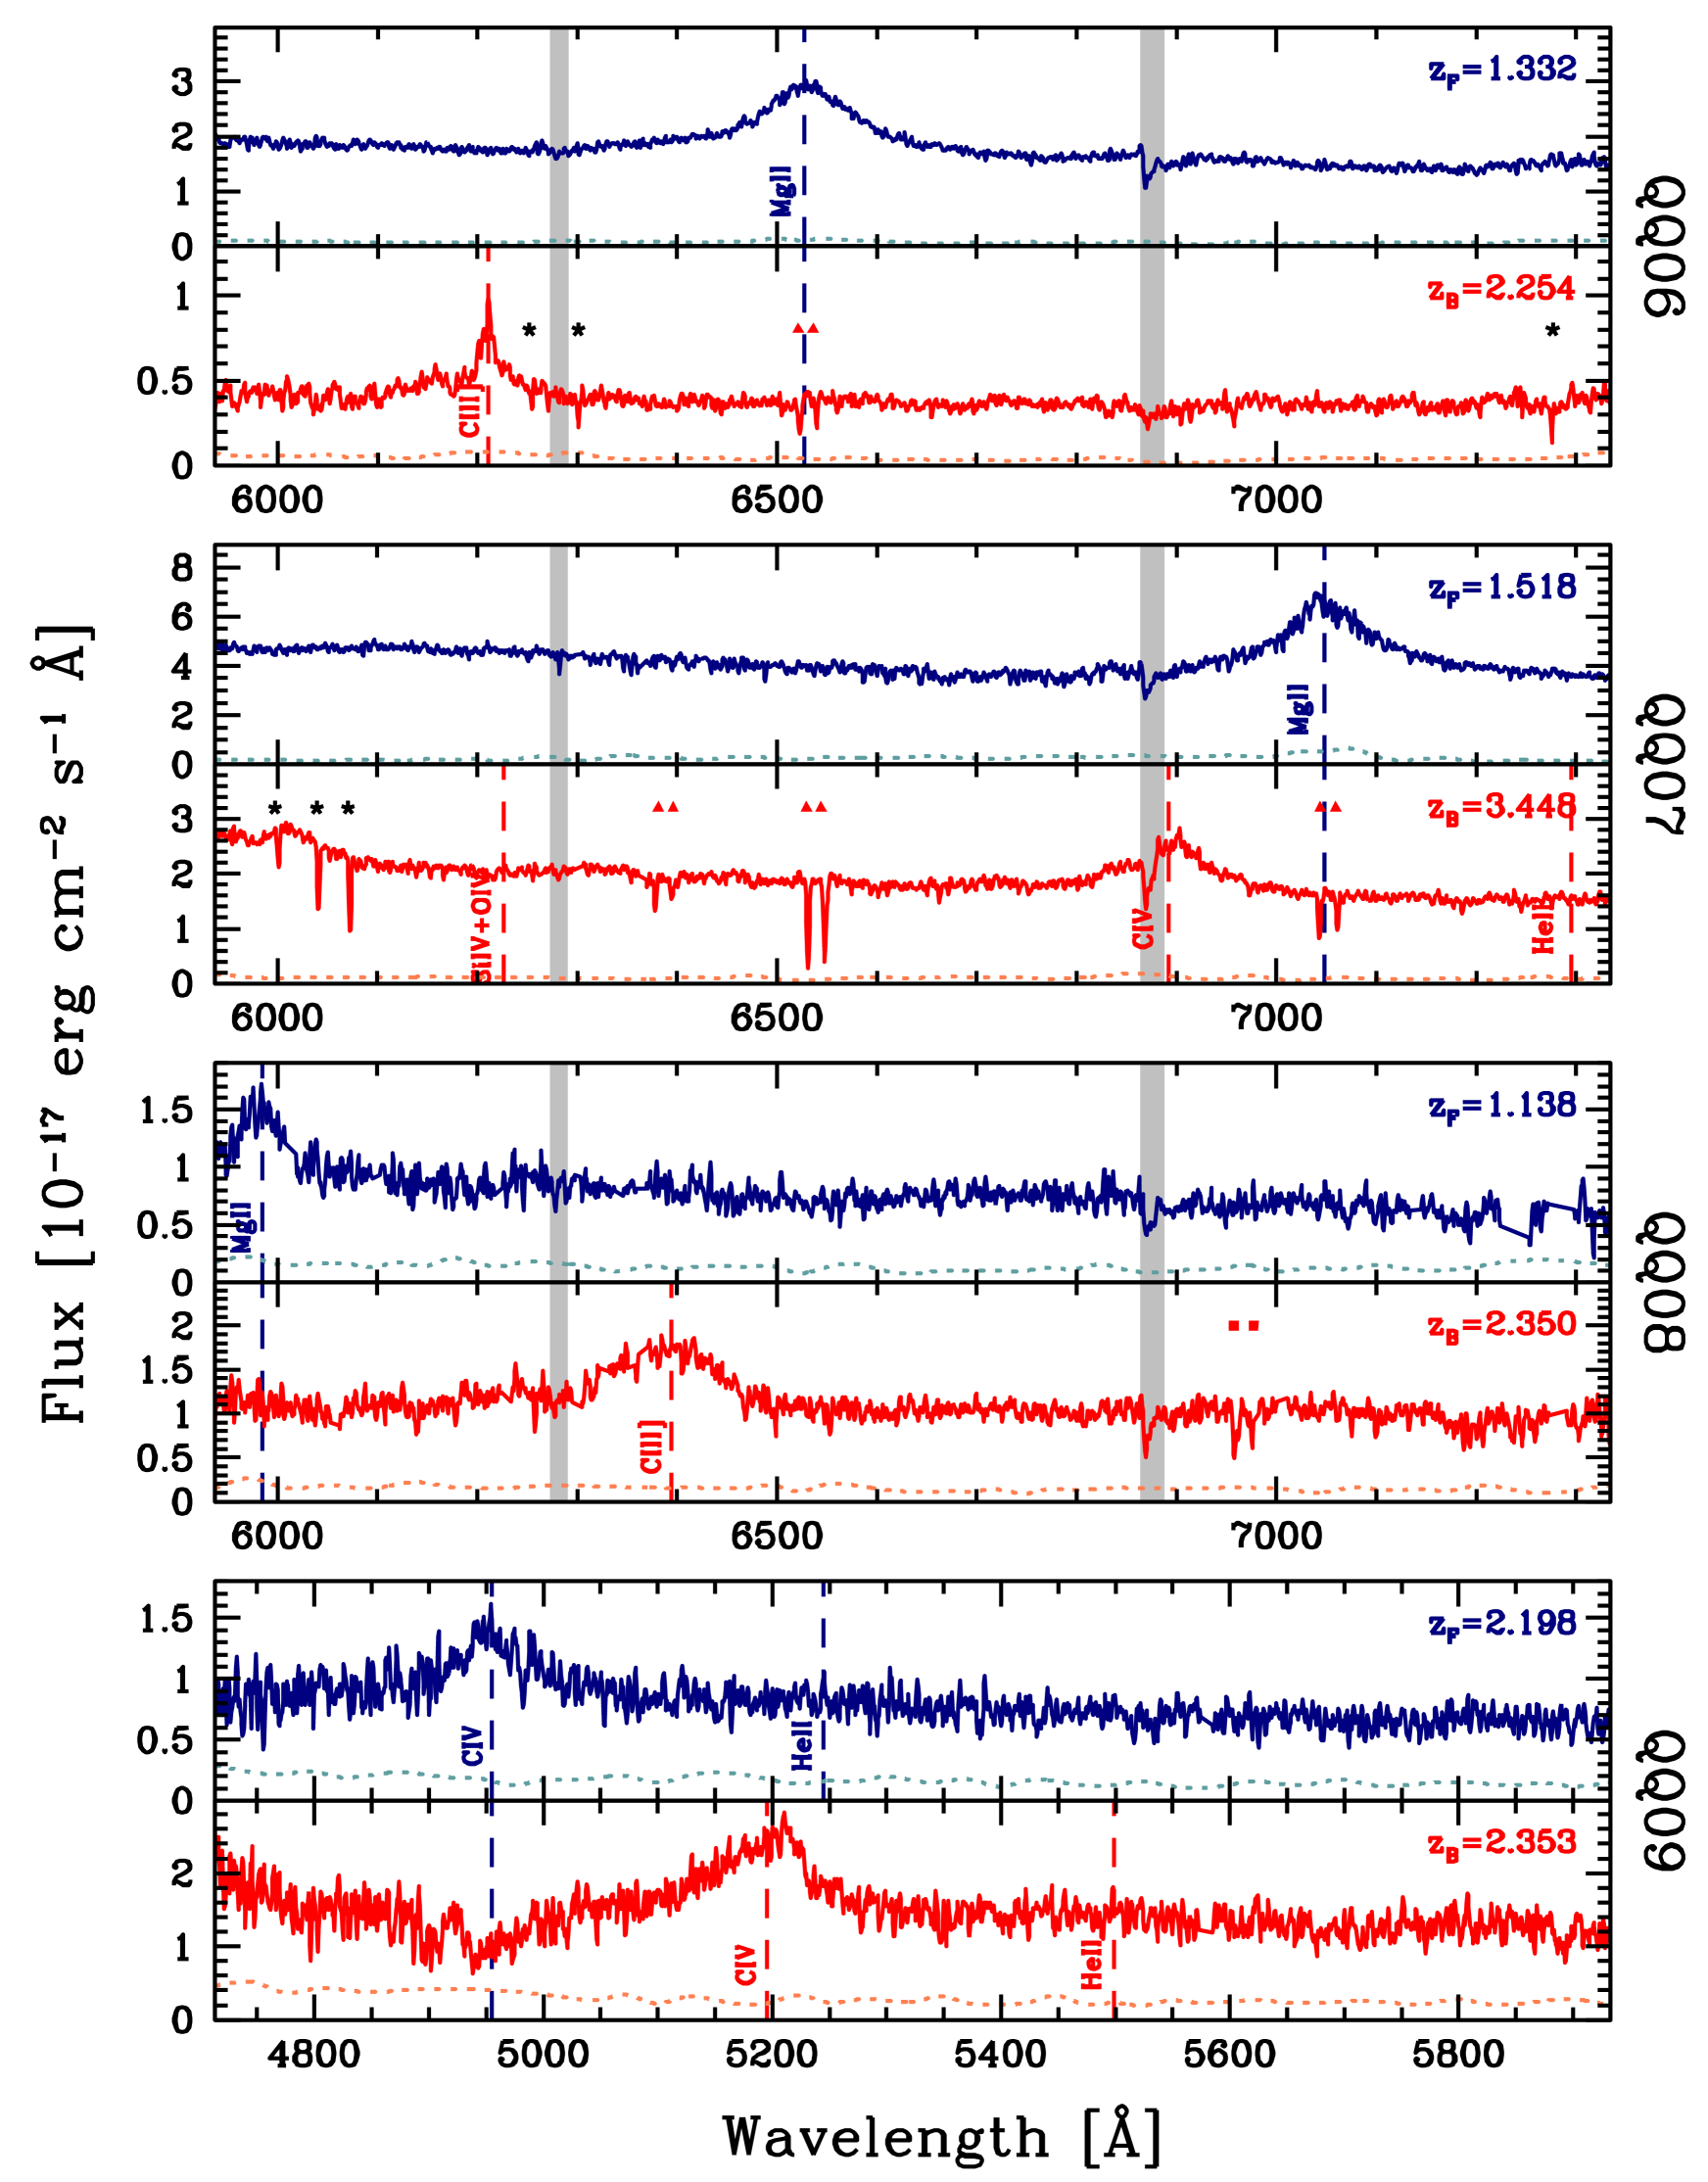
Standard IRAF111IRAF is distributed by the National Optical Astronomy Observatories, which are operated by the Association of Universities for Research in Astronomy, Inc., under cooperative agreement with the National Science Foundation. tools were used in the data reduction. The ccdred package was employed to perform bias subtraction, flat field correction, image alignment and combination. Cosmic rays were eliminated by combining different exposures and by applying the crreject algorithm. The spectra extraction, the background subtraction, and the calibrations both in wavelength and in flux were performed with the twodspec and onedspec packages. Our accuracy in the wavelength calibration is Å. Galactic extinction was accounted for according to Schlegel, Finkbeiner, & Davis (1998), assuming R. The spectra obtained are presented in Figure 2.
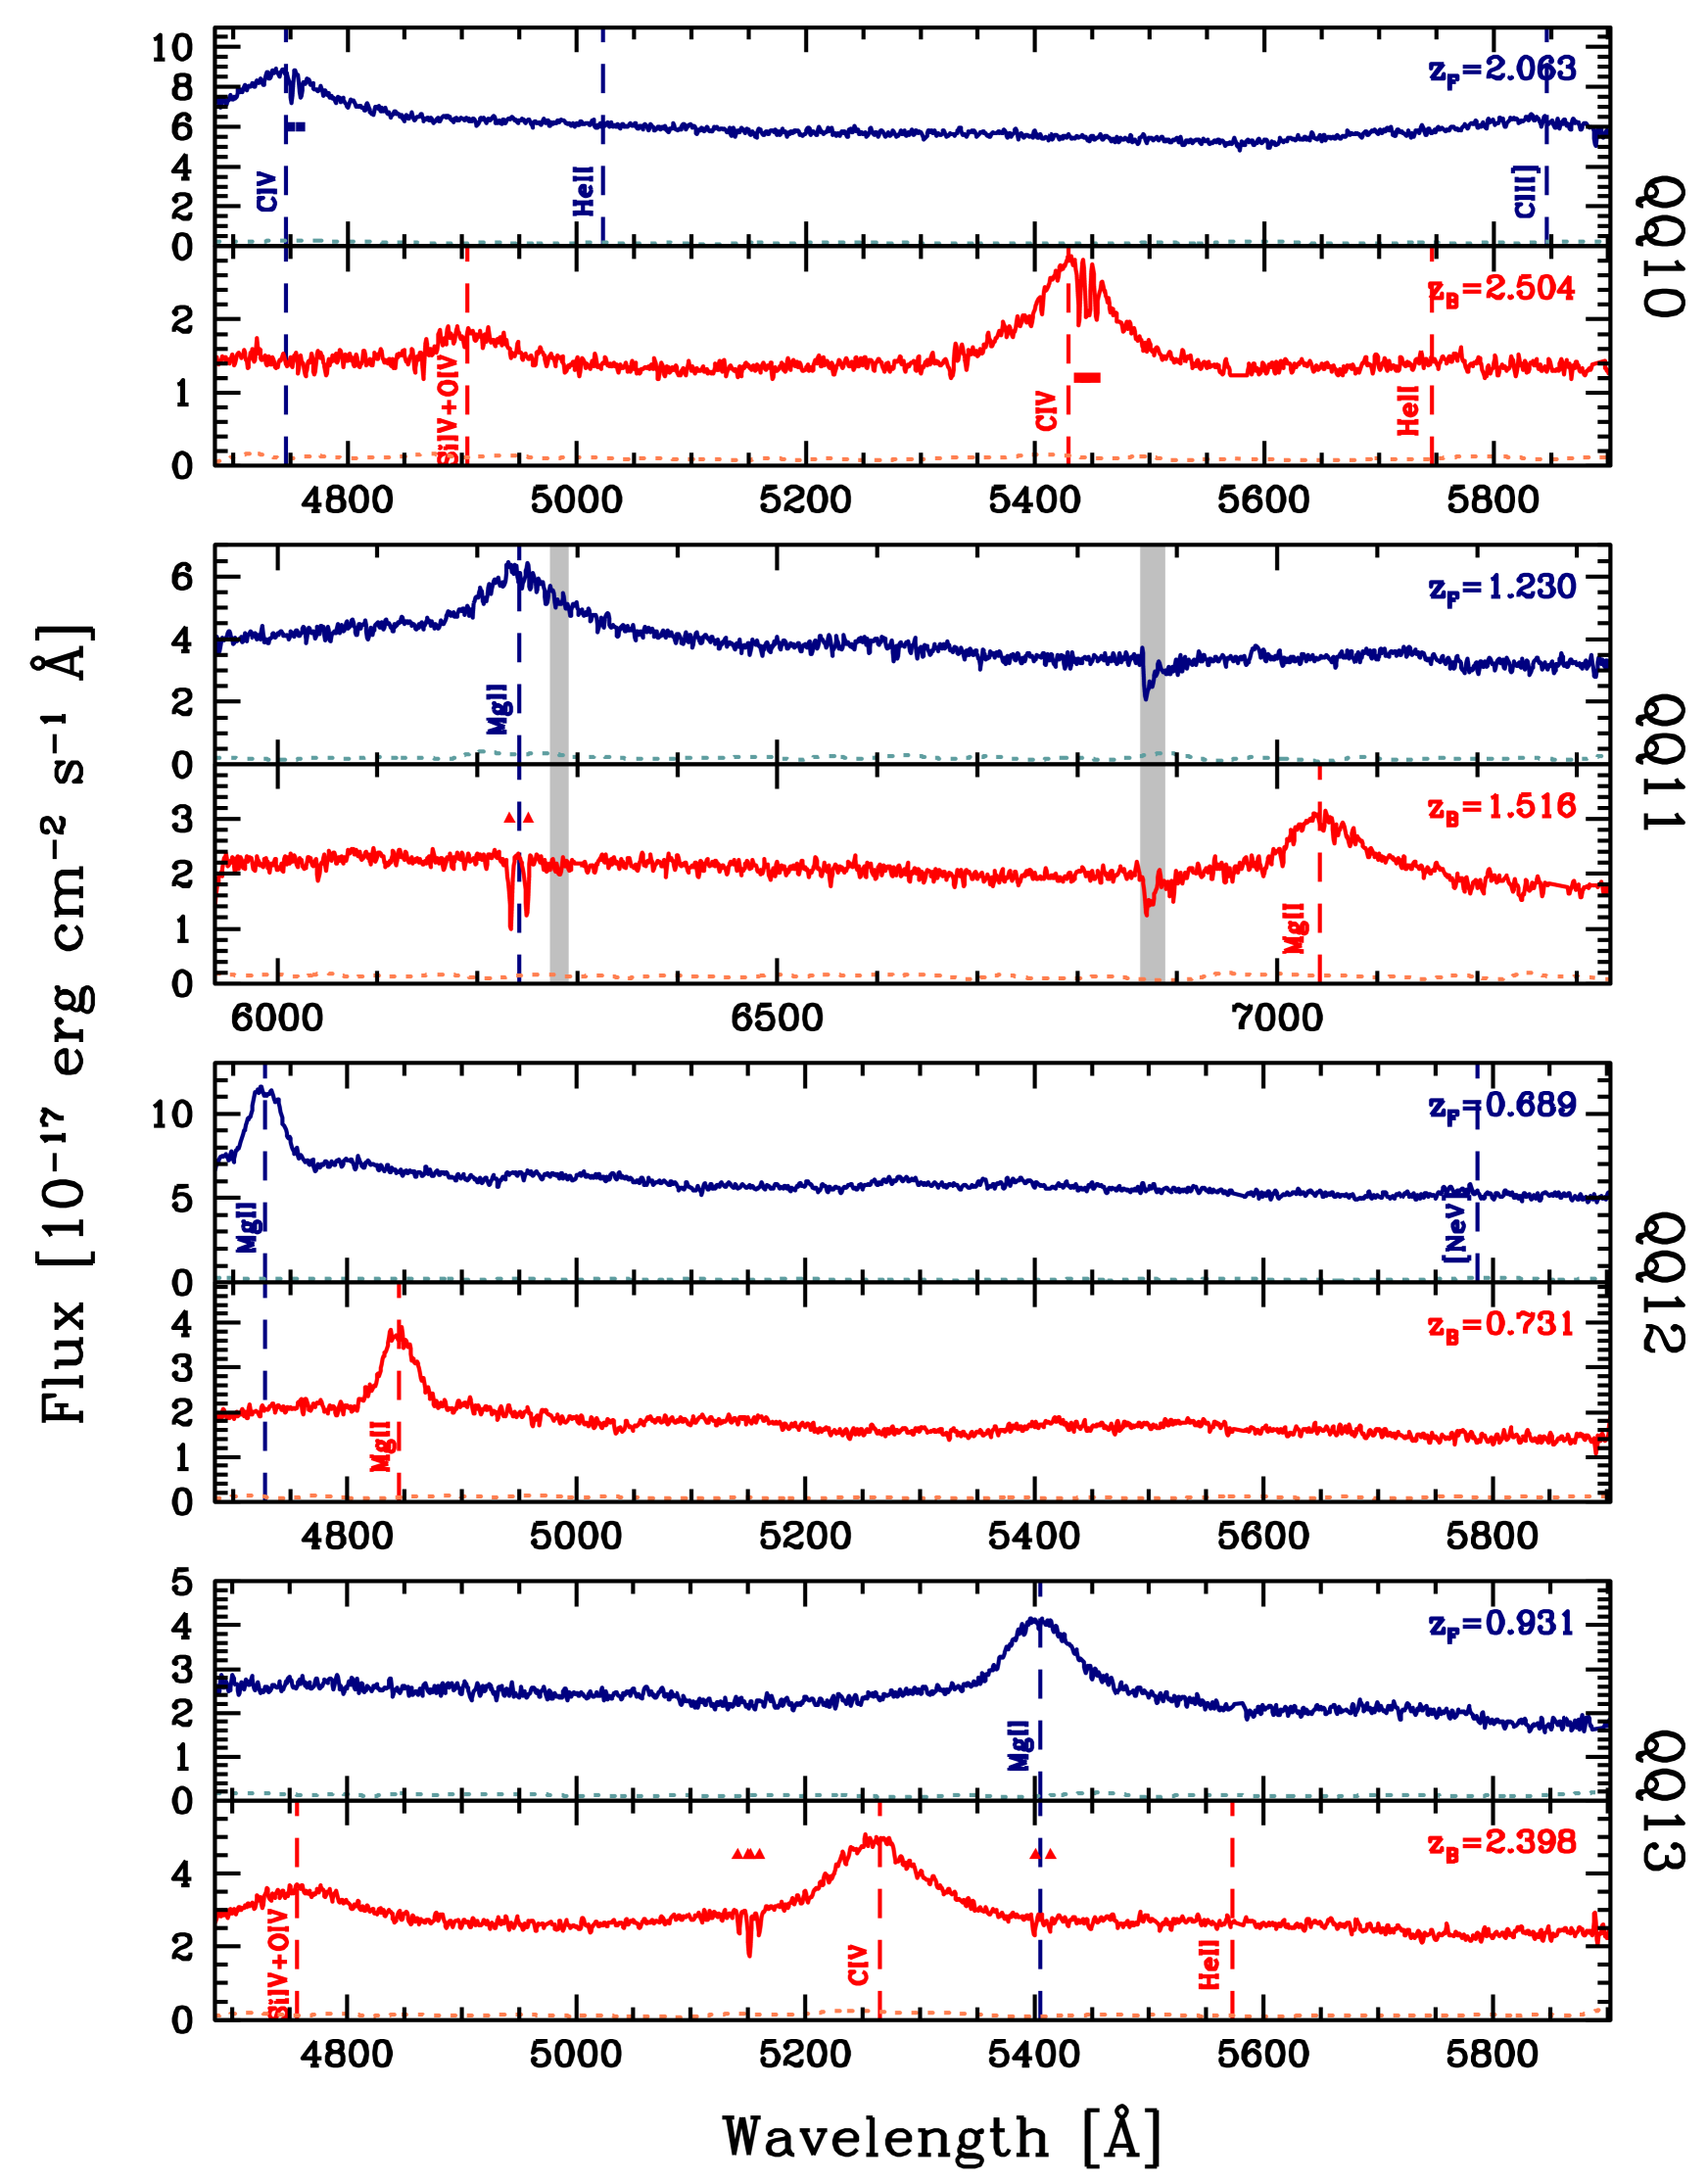
3.2 Analysis of the QSO Spectra
For the analysis of the QSOs spectra we followed the procedure presented in Decarli et al. (2010a) and De Rosa et al. (2011). Namely, data are first inspected by eyes and regions showing apparent absorption features are masked. Then, we designed the continuum with the superposition of: (i) the non thermal power–law–like component; (ii) the host galaxy star light (assuming the elliptical galaxy template of Mannucci et al. 2001); and (iii) the contribution from blended Fe II multiplets (modelled with template of Vestergaard & Wilkes 2001 in the UV band and with our original spectrum of the narrow line Seyfert 1 galaxy I Zwicky 1 in the optical band). Finally, we have fitted broad emission lines with two Gaussian curves with the same central wavelength (see Decarli et al., 2008). Uncertainties on derived quantities are estimated from the errors in both continuum and line fits.
3.3 Analysis of the Absorption Features
Since the width of the absorption lines present in the spectra are smaller than the instrumental profile ( km/s), for the analysis of the absorption features we considered a method similar to that adopted in the HST QSO Absorption Line Key Project (Schneider et al., 1993).
We split the spectrum of QSOs (after masking the apparent absorption features) in intervals of fixed size (20 Å, see for a similar approach Sbarufatti et al., 2005), and we modelled the “continuum” by interpolating the median values of the flux in each bin with a cubic spline function. The equivalent width (EW) of an unresolved absorption feature and the relative uncertainties were calculated by modelling the Instrumental Spread Function (ISF) with a Gaussian with FWHM equal to the spectral resolution. From the redshift of the foreground QSOs, we are able to estimate the expected location of Mg II and C IV absorption features (see §4), thus a 3 threshold imposed on the detection Mg II() and C IV() lines seems adequate to identify the absorption systems (e.g., Churchill et al., 2000).
The EWs and the centroid positions were measured by fitting a single Gaussian function (e.g., Churchill et al., 2000) on the detected absorption lines with our own software that performs a minimisation procedure. The uncertainties were estimated through standard error propagation and assuming that largest source of errors is given by the continuum placement.
4 Absorption systems associated to QSOs
We estimate the covering factor () of cool gas around QSOs basing on the detection of absorbers close to the redshift of the QSOF. It is well known that the redshifts derived from broad emission lines can differ from the systemic redshift by even hundreds km/s (e.g., Tytler & Fan, 1992; Bonning, Shields, & Salviander, 2007), and that absorbers within up to thousands km/s from a QSO are still connected with the QSO itself (e.g., Wild et al., 2008). Thus, as an operational definition, we consider an absorption system as associated to a QSO if its velocity difference with the the broad line redshift is smaller than km/s. Throughout the Paper, we will refer to transverse or to line–of–sight (LOS) absorption features associated to QSOF depending on whether they are observed in the the spectrum of QSOB or of QSOF, respectively.
We can not discriminate between absorbers associated to the QSOF and absorbers that occur by chance coincidence. However, the small separations in both projected distances and relative velocities suggest that we are probing the cool gas strictly related to the QSO.
The properties of the detected absorption systems associated to the QSOF are listed in Table 2.
| Mg II | ||||||
| ID | EW | EW | DR | zabs | ||
| [Å] | [Å] | [Å] | [Å] | |||
| QQ01F | … | … | … | … | ||
| QQ01B | 7109.0 | 0.480.17 | 7126.6 | 0.370.14 | 1.300.35 | 1.54210.0003 |
| QQ02F | … | … | … | … | ||
| QQ02B | … | … | … | … | ||
| QQ03F | … | … | … | … | ||
| QQ03B | 6564.1 | 0.460.12 | 6578.7 | 0.250.14 | 1.860.71 | 1.34700.0003 |
| QQ05F | … | … | … | … | ||
| QQ05B | 5434.5 | 1.210.09 | 5448.6 | 0.770.09 | 1.570.03 | 0.94340.0001 |
| QQ06F | … | … | … | … | ||
| QQ06B | 6522.8 | 0.910.17 | 6539.7 | 0.560.10 | 1.630.11 | 1.33260.0003 |
| QQ07F | … | … | … | … | ||
| QQ07B | 7043.0 | 0.580.07 | 7060.9 | 0.470.09 | 1.230.06 | 1.51860.0001 |
| QQ08F | … | … | … | … | ||
| QQ08B | … | … | … | … | ||
| QQ11F | … | … | … | … | ||
| QQ11B | 6233.4 | 1.360.16 | 6249.5 | 0.950.15 | 1.440.05 | 1.22910.0003 |
| QQ12F | … | … | … | … | ||
| QQ12B | … | … | … | … | ||
| QQ13F | … | … | … | … | ||
| QQ13B | 5399.6 | 0.240.07 | 5413.7 | 0.160.05 | 1.510.28 | 0.93100.0002 |
| C IV | ||||||
| ID | EW | EW | DR | zabs | ||
| [Å] | [Å] | [Å] | [Å] | |||
| QQ04F | 4830.3 | 1.420.12 | 4838.1 | 1.360.12 | 1.040.02 | 2.11980.0003 |
| QQ04B | 4822.4 | 0.120.02 | 4830.1 | 0.060.02 | 2.000.21 | 2.11470.0002 |
| QQ09F | … | … | … | … | ||
| QQ09B | … | … | … | … | ||
| QQ10F | 4751.3 | 0.140.03 | 4759.1 | 0.130.07 | 1.080.35 | 2.06890.0005 |
| QQ10B | … | … | … | … |
4.1 Transverse absorption systems
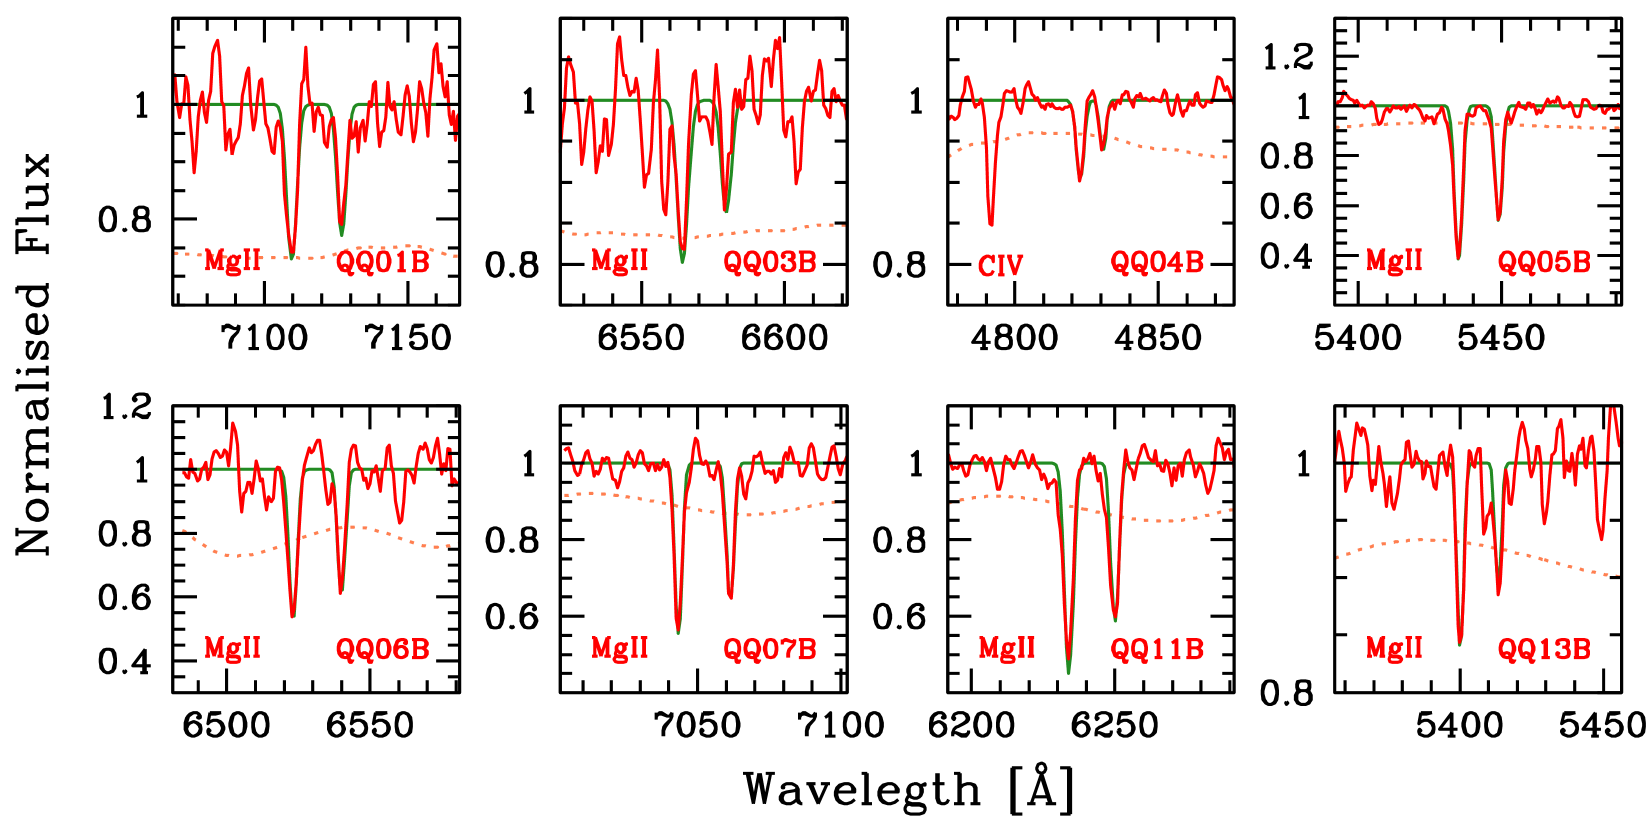
Mg II transverse absorption features are present in 7 out of 10 pairs (see Figure 3). Through the doublet ratio method (see e.g., Chan & Burbidge, 1971; Falomo, 1990), we can estimate an average column density of , assuming a Doppler parameter of km/s (Churchill, 1997).
Excluding QQ08, for which our data do no allow to state significative upper limit to EWr, we estimated covering fraction of for systems with EWr Å. This value is lower than (but consistent within poissonian errors) the 100% found by Bowen et al. (2006) in a sample of 4 QSO pairs. Combining the two results we obtain for EWr Å. It is worth noting that, at higher redshift, Hennawi et al. (2006) found a similar high covering fraction for H I asborbers () in QSO pairs with projected separations kpc. Moreover, if we consider the empirical relation between the H I column densities and the Mg II equivalent widths estimated by Ménard & Chelouche (2009) in the sample of low–redshift Lyman absorbers of Rao, Turnshek, & Nestor (2006), we find that the covering fraction of for absorbers with calculated by Hennawi et al. (2006), exactly corresponds to the for systems with EWr Å detected around low redshift QSOs.
The QSO Mg II covering factor seems to be larger than that observed in normal galaxies, although for these objects it spans a wide range of values, depending on impact parameter and galaxy properties: i.e., from (Mg II)– (Bowen & Chelouche, 2011), to (Bechtold & Ellingson, 1992), to (Tripp & Bowen, 2005; Kacprzak et al., 2008), up to (Chen et al., 2010a).
Only QQ04B shows a strong C IV absorption feature close to (see Figure 3), formally yielding a covering factor of C IV. However, this feature is superimposed to the C IV broad emission lines of the QSOB, and we can not exclude that it is instead a LOS absorption system associated to the QSOB (see Appendix A). In the literature only few cases of C IV transverse absorption systems have been discovered, thus a sound value for the C IV covering factor around QSOs is still missing. Bowen et al. (2006) have detected a C IV absorption system in correspondence of a Mg II one in a QSO pair separated by a projected distance of 26 kpc. In their sample Tytler et al. (2009) found 16 C IV absorption features close in redshift to a QSO but both the small redshift difference and the large projected distance (pd400 kpc) of the QSO pairs they investigate do not allow to put constraints on the covering factor of C IV in the gaseous halo of the QSOs. Concerning galaxies, Chen, Lanzetta, & Webb (2001) have shown that at impact parameter kpc the C IV covering factor is nearly unity.
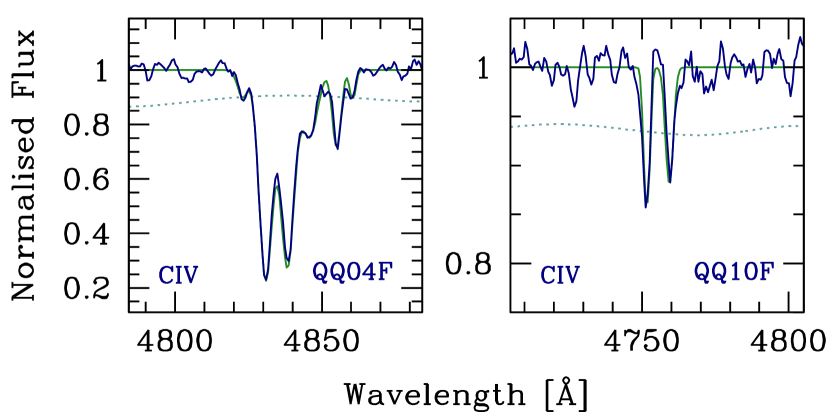
4.2 Line–of–Sight Absorption Systems
While no LOS absorption systems are observed for Mg II, these are present in 2 out of 3 of our spectra for C IV (in average , assuming a Doppler parameter of km/s D’Odorico et al. 1998, see Figure 4). This is in good agreement with Vanden Berk et al. (2008) and Shen & Ménard (2011a) who show that the occurrence of Mg II associated LOS absorption features in SDSS spectra is only of a few percent, and with Vestergaard (2003) that investigate a sample of moderate redshift QSO and found LOS narrow C IV absorption lines in of them (see also, Wild et al., 2008). We stress that in general we can not discriminate between an origin of these absorbers close to the black hole, or in its host galaxy or in its surrounding halo (see for instance Crenshaw, Kraemer, & George, 2003).
5 Discussion
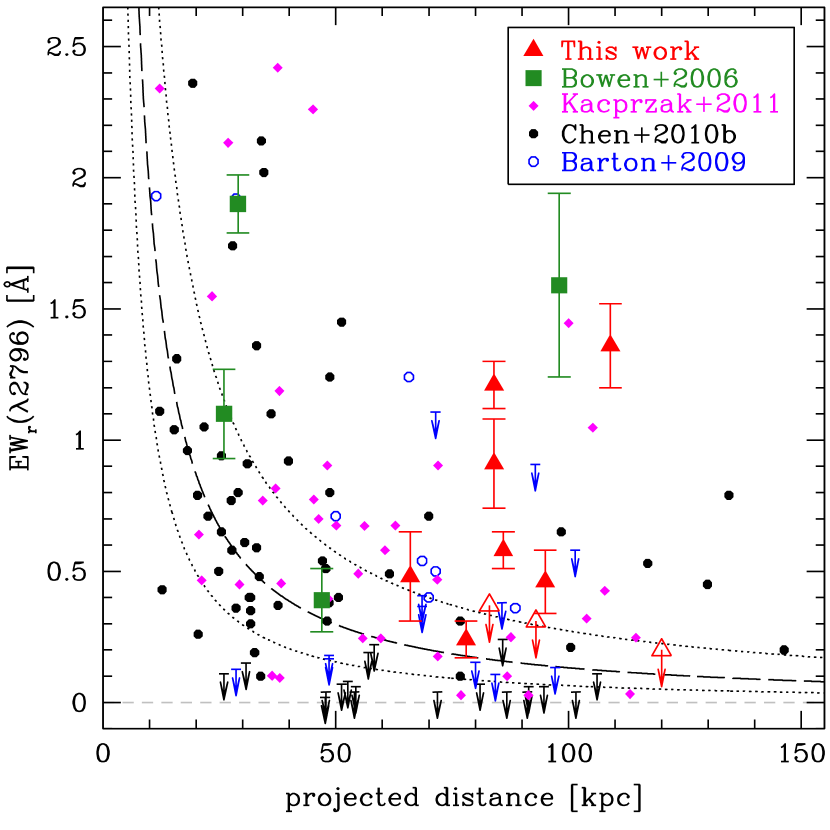
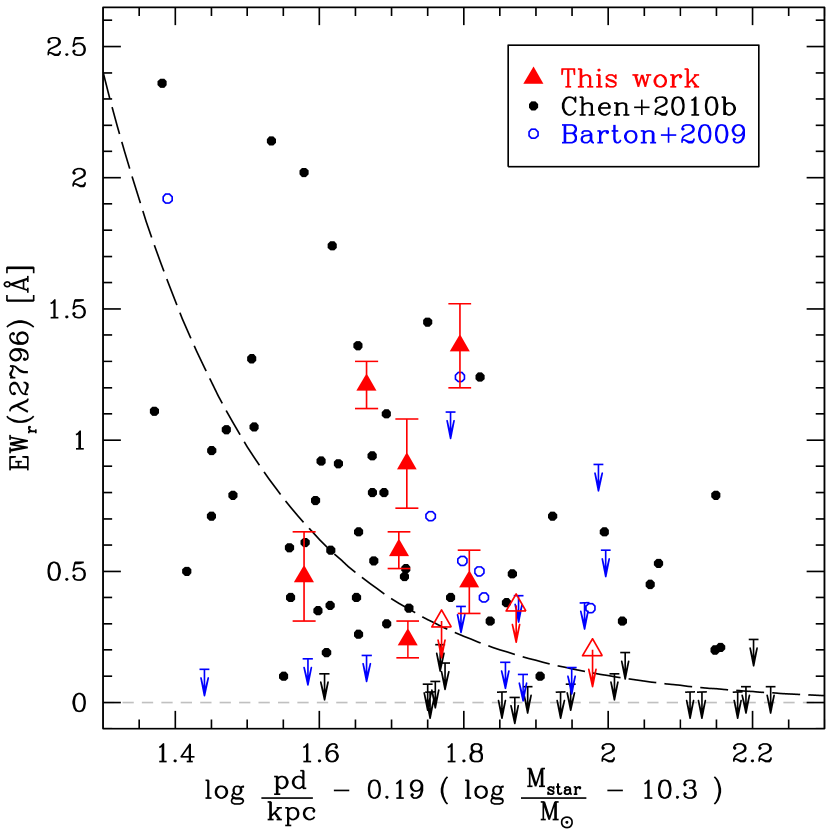
In Figure 5 we plot the rest frame equivalent width of Mg II transverse absorption systems against the QSOF impact parameter. In spite of the small sample considered we note that many strong (i.e., EWr1 Å) absorption systems are located up to separations larger than 70 kpc, in contrast to what observed in normal galaxies (see e.g., Chen et al., 2010a). In this Section we consider the host galaxy mass as an additional parameter that affects the EWr–pd anti–correlation and we study how the QSO emission influence the distribution of the cool gas. In §5.3 we discuss possible origins of the absorbing gas.
5.1 The EW host galaxy mass relation
We here assume that all the Mg II absorption lines detected are associated to the gaseous halo of the QSOs. However, we can not exclude the possibility that some of these systems are due to intervening galaxies (see 5.3).
High resolution observations show that the Mg II absorbers associated to galaxies are often splitted in several discrete components (e.g., Churchill & Vogt, 2001), suggesting a clumpy nature of the gaseous halo. Thus the EWr of an absorption line is roughly proportional to the number of absorbing component along the line of sight (e.g., Petitjean & Bergeron, 1990; Churchill, Vogt, & Charlton, 2003).
For the sake of simplicity we here assume that the EWr reflects the potential well of the dark matter halo and thus that the distribution of the cool gas around galaxies follow a spherical profile (e.g., Srianand & Khare, 1993, 1994; Tinker & Chen, 2008; Chelouche et al., 2008). At a given radius, the more massive systems sustain larger gaseous haloes that are responsible for stronger absorption lines due to the larger number of clouds intercepted. Assuming that the mass of the QSO host galaxy () trace the mass of the extend dark matter halo (see e.g., More et al., 2011), despite the uncertainties on the mass–to–light ratio, the EWr of the absorption features is expected to follow a relation:
| (1) |
For instance, the two coefficients and have been estimated by Chen et al. (2010b) in a sample of low redshift galaxies (): and (see Figure 6).
Is is worth of noting that the correlation between the EWr and the mass of the halo is still not well established. For instance, Bouché et al. (2006), from an analysis of the relation between Mg II absorbers and luminous red galaxies in the SDSS found an anti–correlation between the absorber halo mass and EWr, i.e., on average very strong absorbers (EWr Å) arise in less massive dark matter haloes () while absorbers with EWr Å in the more massive one (). In addition Charlton & Churchill (1996) show that the Mg II distribution could be satisfactorily explained with both an extended disk geometry as well as a spherical one. From a sample of 40 galaxies at redshift , Kacprzak et al. (2011) suggest that the Mg II gas is distributed following a flattened halo that is co–planer and coupled to the inclination of the galaxy disc (see also, Kacprzak, Churchill, & Nielsen, 2012).
In order to determine the mass of the host galaxy () of QSOF we consider the – relation presented by Decarli et al. (2010b) that is based on the investigation of 96 QSOs with known host galaxy luminosities in the redshift range :
| (2) |
where is the QSO redshift. The s are estimated using the virial method applied to the gas of the BLR. These could be inferred from the width of broad emission lines and from the continuum luminosity, as expected from a photoionisation model (e.g., Kaspi et al., 2000). The uncertainties associated to the estimate are dominated by the dispersion of the relation between the radius of the BLR and the luminosity of the continuum and are typically around dex (e.g., Vestergaard & Peterson, 2006; Shen et al., 2011b). The calculated from the recipes of Vestergaard & Peterson (2006) and of Vestergaard & Osmer (2009) are in Table 1.
In Figure 6 we show the distribution of the EWr as a function of the impact parameter rescaled for the stellar mass for quiescent galaxies from Barton & Cooke (2009) and Chen et al. (2010b) (on average ) and for the host of QSOs (on average ). Taking into account the mass, the Mg II absorption systems associated to QSOs have a distribution close to that of galaxies. The value of the for our data estimated on the relations presented by Chen et al. (2010a, b) prior and after accounting for the galaxy mass improves of a factor . This is in agreement with studies that suggest that the haloes of QSOs are similar to that of normal galaxies (e.g., Chelouche et al., 2008).
5.2 Effects of the QSO radiation
The presence of the intense radiation field coming from the central supermassive black hole should have a substantial effect in the thermal state of the gaseous halo. Chelouche et al. (2008) model the distribution of cool gas around QSOs suggesting that it is filled with clouds having size of pc and density of cm-3. Under these conditions a QSOs with luminosity of erg/s (the average of our sample calculated from the bolometric corrections given in Richards et al., 2006, see Table 1) can heat the cool gas within kpc up to a temperature of T K, allowing the existence of only few Mg II absorbers. Wild et al. (2008) from a sample Mg II absorber with equivalent width larger than Å directly associated to the QSOs, found that the QSO emission destroys Mg II clouds out to at least kpc. Since the QSO radiation is thought to be emitted into cones (Antonucci, 1993), an anisotropy of the distribution of absorbers is thus expected (e.g., Hennawi et al., 2006). If the UV emission of the central black occurs along the line of sight, the transverse absorption features will be not affected by it, and the QSO luminosity will have little impact on the extend Mg II absorbing gas at large galactic radii. On the contrary, Mg II absorbers along the line of sight are photoionised by the QSO emission (see also, Elvis, 2000).
C IV and Mg II are believed to reside in the same halo clouds, however the ionising region of the former is expected to be smaller than that of the latter, consistent with its higher ionisation energy. C IV absorbers could survive within kpc, even though the radiation field of the QSO (Chelouche et al., 2008). The origin of the C IV LOS absorbers could also be associated to the region closer to the QSO. For instance, Wild et al. (2008), investigating the C IV LOS absorption system in a sample of C IV absorbers from the SDSS, have found that of the systems within km/s of the QSO are due to a gas outflow from the central black hole (see also, Nestor, Turnshek, & Rao, 2005).
5.3 Origin of Mg II absorbing gas
Although our sample of 13 QSO pairs does not allow us to put firm constraints, we can comment on the possible origin of the absorbing gas.
A simple explanation for the most intense and distant absorption lines detected around QSOs is that these are due to a chance superposition of a satellite galaxy or to the presence of tidal tail due to recent merger episodes (see e.g., Fumagalli et al., 2011; Keeney et al., 2011). This scenario is supported by studies suggesting that, despite the wide variety of environments in which they are detected, QSOs seems to prefer galactic environment richer than average (e.g., Wold et al., 2001; Serber et al., 2006; Hutchings, Scholz, & Bianchi, 2009). However, the high covering factor and the observational evidence of galaxies surrounded by cool gas up to a radius of kpc, allow us to fairly assume the link between absorbers and QSO haloes. In support of this we also roughly estimate the the H I column density from the rest frame equivalent width of Mg II from the relations found in Ménard & Chelouche (2009). All the detected systems have , that is unlikely associated to galactic disc (e.g., Zwaan et al., 2005). However, we can not exclude the possibility that the absorptions origin from extra–planar neutral gas associated to spiral galaxies (e.g., Sancisi et al., 2008).
If the absorbers are associated to the QSO gaseous halos, the improvement of the anti–correlation between EWr and projected distance due to the addition of the galaxy mass as parameter is naturally explained in the inflow scenario. As suggested by Chen et al. (2010b) more massive galaxies have more extended halos of cool gas and thus the observed Mg II absorbers arise in infalling clouds. However, we note that only the weaker absorption systems are thought to be associated to inflows of gas (the few absorption systems observed by Chen et al. at separations larger than 70 kpc have typically EWr Å), while the stronger ones to outflows (e.g., Zibetti et al., 2007). The inflows of gas responsible of the QSO activity may produce intense star formation episodes and strong winds (e.g., Di Matteo, Springel, & Hernquist, 2005; Hopkins et al., 2005; Maiolino et al., 2012) that might give rise to the stronger detected absorption lines. This is also supported by the recent discovery of signature of high star formation rate and gas outflows in the QSO host galaxies (Floyd et al., 2012; Sanmartim, Storchi-Bergmann & Brotherton, 2012).
6 Summary and Conclusions
We studied 13 close projected QSO pairs observed with FORS2 at ESO–VLT. The projected separations of the systems (between kpc and kpc) allowed us to to investigate the presence of Mg II and C IV absorption systems in the outer regions of the extended gaseous haloes of QSOs in the redshift range .
In 7 out of 10 systems we have detected the Mg II doublet on the QSOB spectrum in correspondence to the QSOF, while only one association out of 3 is found for C IV. We compare our results with those performed for normal galaxies by Kacprzak et al. (2011), Chen et al. (2010a), and Barton & Cooke (2009). If we consider EWr as a function of both the projected distance and the mass of the systems, we find that the haloes of QSOs are similar to that of galaxies. In our small sample, we do not detect a significant enhancement of the absorption system strengths, as could be expected if the QSO nuclear activity were driven by intense gas accretion onto the black hole. Finally, we note that along the line of sight we do not detect any Mg II absorbers of the same strength of the transverse one. These results are in agreement with models that consider a non isotropic emission of the QSO, which are hosted by gaseous haloes more massive that those of galaxies.
Acknowledgements
We acknowledge helpful discussions with C. Montuori, F. Haardt, and M. Fumagalli. For this work EPF was supported by Società Carlo Gavazzi S.p.A. and by Thales Alenia Space Italia SpA. RD acknowledges funding from Germany’s national research centre for aeronautics and space (DLR, project FKZ 50 OR 1104). This work was based on observations made with the ESO/VLT Telescope in Paranal.
References
- Antonucci (1993) Antonucci R., 1993, ARA&A, 31, 473
- Appenzeller et al. (1998) Appenzeller I., et al., 1998, Msngr, 94, 1
- Bahcall & Spitzer (1969) Bahcall J. N., Spitzer L., Jr., 1969, ApJ, 156, L63
- Barton & Cooke (2009) Barton E. J., Cooke J., 2009, AJ, 138, 1817
- Bechtold & Ellingson (1992) Bechtold J., Ellingson E., 1992, ApJ, 396, 20
- Bennert et al. (2008) Bennert N., Canalizo G., Jungwiert B., Stockton A., Schweizer F., Peng C. Y., Lacy M., 2008, ApJ, 677, 846
- Bergeron & Boissé (1991) Bergeron J., Boissé P., 1991, A&A, 243, 344
- Bergeron, Boissé, & Ménard (2011) Bergeron J., Boissé P., Ménard B., 2011, A&A, 525, A51
- Bonning, Shields, & Salviander (2007) Bonning E. W., Shields G. A., Salviander S., 2007, ApJ, 666, L13
- Bowen et al. (2006) Bowen D. V., et al., 2006, ApJ, 645, L105
- Bowen & Chelouche (2011) Bowen D. V., Chelouche D., 2011, ApJ, 727, 47
- Boksenberg & Sargent (1978) Boksenberg A., Sargent W. L. W., 1978, ApJ, 220, 42
- Bouché et al. (2006) Bouché N., Murphy M. T., Péroux C., Csabai I., Wild V., 2006, MNRAS, 371, 495
- Canalizo et al. (2007) Canalizo G., Bennert N., Jungwiert B., Stockton A., Schweizer F., Lacy M., Peng C., 2007, ApJ, 669, 801
- Chan & Burbidge (1971) Chan Y. W. T., Burbidge E. M., 1971, ApJ, 167, 213
- Charlton & Churchill (1996) Charlton J. C., Churchill C. W., 1996, ApJ, 465, 631
- Chelouche et al. (2008) Chelouche D., Ménard B., Bowen D. V., Gnat O., 2008, ApJ, 683, 55
- Chelouche & Bowen (2010) Chelouche D., Bowen D. V., 2010, ApJ, 722, 1821
- Chen, Lanzetta, & Webb (2001) Chen H.-W., Lanzetta K. M., Webb J. K., 2001, ApJ, 556, 158
- Chen et al. (2010a) Chen H.-W., Helsby J. E., Gauthier J.-R., Shectman S. A., Thompson I. B., Tinker J. L., 2010a, ApJ, 714, 1521
- Chen et al. (2010b) Chen H.-W., Wild V., Tinker J. L., Gauthier J.-R., Helsby J. E., Shectman S. A., Thompson I. B., 2010b, ApJ, 724, L176
- Churchill (1997) Churchill C. W., 1997, PhDT
- Churchill et al. (1999) Churchill C. W., Rigby J. R., Charlton J. C., Vogt S. S., 1999, ApJS, 120, 51
- Churchill et al. (2000) Churchill C. W., Mellon R. R., Charlton J. C., Jannuzi B. T., Kirhakos S., Steidel C. C., Schneider D. P., 2000, ApJS, 130, 91
- Churchill & Vogt (2001) Churchill C. W., Vogt S. S., 2001, AJ, 122, 679
- Churchill, Vogt, & Charlton (2003) Churchill C. W., Vogt S. S., Charlton J. C., 2003, AJ, 125, 98
- Churchill, Kacprzak, & Steidel (2005) Churchill C. W., Kacprzak G. G., Steidel C. C., 2005, pgqa.conf, 24
- Crenshaw, Kraemer, & George (2003) Crenshaw D. M., Kraemer S. B., George I. M., 2003, ARA&A, 41, 117
- Cortese et al. (2006) Cortese L., Gavazzi G., Boselli A., Franzetti P., Kennicutt R. C., O’Neil K., Sakai S., 2006, A&A, 453, 847
- Crotts (1989) Crotts A. P. S., 1989, ApJ, 336, 550
- Decarli et al. (2008) Decarli R., Labita M., Treves A., Falomo R., 2008, MNRAS, 387, 1237
- Decarli, Treves, & Falomo (2009) Decarli R., Treves A., Falomo R., 2009, MNRAS, 396, L31
- Decarli et al. (2010a) Decarli R., Falomo R., Treves A., Kotilainen J. K., Labita M., Scarpa R., 2010a, MNRAS, 402, 2441
- Decarli et al. (2010b) Decarli R., Falomo R., Treves A., Labita M., Kotilainen J. K., Scarpa R., 2010b, MNRAS, 402, 2453
- De Rosa et al. (2011) De Rosa G., Decarli R., Walter F., Fan X., Jiang L., Kurk J., Pasquali A., Rix H. W., 2011, ApJ, 739, 56
- Dobrzycki & Bechtold (1991) Dobrzycki A., Bechtold J., 1991, ApJ, 377, L69
- Di Matteo, Springel, & Hernquist (2005) Di Matteo T., Springel V., Hernquist L., 2005, Natur, 433, 604
- D’Odorico et al. (1998) D’Odorico V., Cristiani S., D’Odorico S., Fontana A., Giallongo E., 1998, A&AS, 127, 217
- Elvis (2000) Elvis M., 2000, ApJ, 545, 63
- Farina, Falomo, & Treves (2011) Farina E. P., Falomo R., Treves A., 2011, MNRAS, 415, 3163
- Falomo (1990) Falomo R., 1990, ApJ, 353, 114
- Floyd et al. (2012) Floyd D. J. E., Dunlop J. S., Kukula M. J., Brown M. J. I., McLure R. J., Baum S. A., O’Dea C. P., 2012, arXiv, arXiv:1208.4143
- Fumagalli et al. (2011) Fumagalli M., Prochaska J. X., Kasen D., Dekel A., Ceverino D., Primack J. R., 2011, MNRAS, 418, 1796
- Gallerani et al. (2008) Gallerani S., Ferrara A., Fan X., Choudhury T. R., 2008, MNRAS, 386, 359
- Gauthier, Chen, & Tinker (2009) Gauthier J.-R., Chen H.-W., Tinker J. L., 2009, ApJ, 702, 50
- Green et al. (2010) Green P. J., Myers A. D., Barkhouse W. A., Mulchaey J. S., Bennert V. N.,Cox T. J., Aldcroft T. L., 2010, ApJ, 710, 1578
- Hennawi et al. (2006) Hennawi J. F., et al., 2006, ApJ, 651, 61
- Hennawi & Prochaska (2007) Hennawi J. F., Prochaska J. X., 2007, ApJ, 655, 735
- Hewett & Wild (2010) Hewett P. C., Wild V., 2010, MNRAS, 405, 2302
- Hopkins et al. (2005) Hopkins P. F., Hernquist L., Cox T. J., Di Matteo T., Martini P., Robertson B., Springel V., 2005, ApJ, 630, 705
- Hutchings, Scholz, & Bianchi (2009) Hutchings J. B., Scholz P., Bianchi L., 2009, AJ, 137, 3533
- Kaspi et al. (2000) Kaspi S., Smith P. S., Netzer H., Maoz D., Jannuzi B. T., Giveon U., 2000, ApJ, 533, 631
- Kacprzak et al. (2008) Kacprzak G. G., Churchill C. W., Steidel C. C., Murphy M. T., 2008, AJ, 135, 922
- Kacprzak et al. (2011) Kacprzak G. G., Churchill C. W., Evans J. L., Murphy M. T., Steidel C. C., 2011, MNRAS, 416, 3118
- Kacprzak, Churchill, & Nielsen (2012) Kacprzak G. G., Churchill C. W., Nielsen N. M., 2012, arXiv, arXiv:1205.0245
- Keeney et al. (2011) Keeney B. A., Stocke J. T., Danforth C. W., Carilli C. L., 2011, AJ, 141, 66
- Kirkman & Tytler (2008) Kirkman D., Tytler D., 2008, MNRAS, 391, 1457
- Lanzetta, Turnshek, & Wolfe (1987) Lanzetta K. M., Turnshek D. A., Wolfe A. M., 1987, ApJ, 322, 739
- Liske & Williger (2001) Liske J., Williger G. M., 2001, MNRAS, 328, 653
- Lundgren et al. (2009) Lundgren B. F., et al., 2009, ApJ, 698, 819
- Maiolino et al. (2012) Maiolino R., et al., 2012, MNRAS, 425, L66
- Mannucci et al. (2001) Mannucci F., Basile F., Poggianti B. M., Cimatti A., Daddi E., Pozzetti L., Vanzi L., 2001, MNRAS, 326, 745
- Martin et al. (2012) Martin C. L., Shapley A. E., Coil A. L., Kornei K. A., Bundy K., Weiner B. J., Noeske K. G., Schiminovich D., 2012, arXiv, arXiv:1206.5552
- Ménard & Chelouche (2009) Ménard B., Chelouche D., 2009, MNRAS, 393, 808
- Ménard et al. (2011) Ménard B., Wild V., Nestor D., Quider A., Zibetti S., Rao S., Turnshek D., 2011, MNRAS, 417, 801
- More et al. (2011) More S., van den Bosch F. C., Cacciato M., Skibba R., Mo H. J., Yang X., 2011, MNRAS, 410, 210
- Nestor, Turnshek, & Rao (2005) Nestor D. B., Turnshek D. A., Rao S. M., 2005, ApJ, 628, 637
- Nestor et al. (2011) Nestor D. B., Johnson B. D., Wild V., Ménard B., Turnshek D. A., Rao S., Pettini M., 2011, MNRAS, 412, 1559
- Petitjean & Bergeron (1990) Petitjean P., Bergeron J., 1990, A&A, 231, 309
- Prochaska & Hennawi (2009) Prochaska J. X., Hennawi J. F., 2009, ApJ, 690, 1558
- Prochter, Prochaska, & Burles (2006) Prochter G. E., Prochaska J. X., Burles S. M., 2006, ApJ, 639, 766
- Quashnock & vanden Berk (1998) Quashnock J. M., vanden Berk D. E., 1998, ApJ, 500, 28
- Quashnock & Stein (1999) Quashnock J. M., Stein M. L., 1999, ApJ, 515, 506
- Rao, Turnshek, & Nestor (2006) Rao S. M., Turnshek D. A., Nestor D. B., 2006, ApJ, 636, 610
- Richards et al. (2006) Richards G. T., et al., 2006, ApJS, 166, 470
- Rigby, Charlton, & Churchill (2002) Rigby J. R., Charlton J. C., Churchill C. W., 2002, ApJ, 565, 743
- Rubin et al. (2012) Rubin K. H. R., Prochaska J. X., Koo D. C., Phillips A. C., 2012, ApJ, 747, L26
- Rubin et al. (2010) Rubin K. H. R., Prochaska J. X., Koo D. C., Phillips A. C., Weiner B. J., 2010, ApJ, 712, 574
- Sancisi et al. (2008) Sancisi R., Fraternali F., Oosterloo T., van der Hulst T., 2008, A&ARv, 15, 189
- Sanmartim, Storchi-Bergmann & Brotherton (2012) Sanmartim D., Storchi-Bergmann T., Brotherton M. S., 2012, arXiv, arXiv:1210.1208
- Sbarufatti et al. (2005) Sbarufatti B., Treves A., Falomo R., Heidt J., Kotilainen J., Scarpa R., 2005, AJ, 129, 559
- Scargle, Caroff, & Noerdlinger (1970) Scargle J. D., Caroff L. J., Noerdlinger P. D., 1970, ApJ, 161, L115
- Schneider et al. (1993) Schneider D. P., et al., 1993, ApJS, 87, 45
- Schneider et al. (2010) Schneider D. P., et al., 2010, AJ, 139, 2360
- Schlegel, Finkbeiner, & Davis (1998) Schlegel D. J., Finkbeiner D. P., Davis M., 1998, ApJ, 500, 525
- Schirber, Miralda-Escudé, & McDonald (2004) Schirber M., Miralda-Escudé J., McDonald P., 2004, ApJ, 610, 105
- Serber et al. (2006) Serber W., Bahcall N., Ménard B., Richards G., 2006, ApJ, 643, 68
- Shaver, Boksenberg, & Robertson (1982) Shaver P. A., Boksenberg A., Robertson J. G., 1982, ApJ, 261, L7
- Shaver & Robertson (1983) Shaver P. A., Robertson J. G., 1983, ApJ, 268, L57
- Shaver & Robertson (1985) Shaver P. A., Robertson J. G., 1985, MNRAS, 212, 15P
- Shen et al. (2011b) Shen Y., et al., 2011, ApJS, 194, 45
- Shen & Ménard (2011a) Shen Y., Ménard B., 2011, arXiv, arXiv:1104.0778
- Srianand & Khare (1993) Srianand R., Khare P., 1993, ApJ, 413, 486
- Srianand & Khare (1994) Srianand R., Khare P., 1994, ApJ, 428, 82
- Steidel, Dickinson, & Persson (1994) Steidel C. C., Dickinson M., Persson S. E., 1994, ApJ, 437, L75
- Steidel & Sargent (1992) Steidel C. C., Sargent W. L. W., 1992, ApJS, 80, 1
- Sulentic et al. (2001) Sulentic J. W., Rosado M., Dultzin-Hacyan D., Verdes-Montenegro L., Trinchieri G., Xu C., Pietsch W., 2001, AJ, 122, 2993
- Tinker & Chen (2008) Tinker J. L., Chen H.-W., 2008, ApJ, 679, 1218
- Turnshek (1984) Turnshek D. A., 1984, ApJ, 280, 51
- Tremonti, Moustakas, & Diamond-Stanic (2007) Tremonti C. A., Moustakas J., Diamond-Stanic A. M., 2007, ApJ, 663, L77
- Tripp & Bowen (2005) Tripp T. M., Bowen D. V., 2005, pgqa.conf, 5
- Tytler & Fan (1992) Tytler D., Fan X.-M., 1992, ApJS, 79, 1
- Tytler et al. (2009) Tytler D., et al., 2009, MNRAS, 392, 1539
- Weiner et al. (2009) Weiner B. J., et al., 2009, ApJ, 692, 187
- Wild et al. (2008) Wild V., et al., 2008, MNRAS, 388, 227
- Wold et al. (2001) Wold M., Lacy M., Lilje P. B., Serjeant S., 2001, MNRAS, 323, 231
- Worseck & Wisotzki (2006) Worseck G., Wisotzki L., 2006, A&A, 450, 495
- Vanden Berk et al. (2008) Vanden Berk D., et al., 2008, ApJ, 679, 239
- Vestergaard & Wilkes (2001) Vestergaard M., Wilkes B. J., 2001, ApJS, 134, 1
- Vestergaard (2003) Vestergaard M., 2003, ApJ, 599, 116
- Vestergaard & Peterson (2006) Vestergaard M., Peterson B. M., 2006, ApJ, 641, 689
- Vestergaard & Osmer (2009) Vestergaard M., Osmer P. S., 2009, ApJ, 699, 800
- Véron-Cetty & Véron (2010) Véron-Cetty M.-P., Véron P., 2010, A&A, 518, A10
- Young, Sargent, & Boksenberg (1982) Young P., Sargent W. L. W., Boksenberg A., 1982, ApJS, 48, 455
- Zwaan et al. (2005) Zwaan M. A., van der Hulst J. M., Briggs F. H., Verheijen M. A. W., Ryan-Weber E. V., 2005, MNRAS, 364, 1467
- Zibetti et al. (2007) Zibetti S., Ménard B., Nestor D. B., Quider A. M., Rao S. M., Turnshek D. A., 2007, ApJ, 658, 161
Appendix A Notes on individual objects
QQ01 — The Mg II absorption lines in QQ01B is detected at a level slighty lower than the considered 3 threshold. However, since the large uncertainties in the continuum location, we have maintained this absorption system in the analysis.
QQ04 — The two QSOs of the pair are very close in redshift thus the association of the absorption feature to the foreground or to the background QSO is uncertain. QQ04F shows two C IV absorption systems superimposed to the broad emission line. A stronger one at redshift and a fainter blueshifted one at . The two component of the stronger absorption system are partially blended, and thus fitted simultaneously with the sum of two Gauss functions. Moreover, other absorptions lines are present at Å and at Å, whose identification is uncertain as they are superimposed on the stronger absorption system.
Due to the velocity range that we have considered to associate the absorption features to the QSOF (see §4), we have assumed that the stronger feature is due to the QSO halo, while the weaker one (with km/s from the former) to a simple chance superposition. However, the uncertainties in the redshift determination based on C IV broad emission line are large, mostly due to the presence of the strong absorption features (see e.g., Hewett & Wild, 2010). This does not allow to exclude the possibility that the weaker absorption system is connected to the QSOF halo and that the stronger one is due to a gas outflow. QQ04B shows a broad absorption lines in the blue wing of the C IV emission lines. These P–Cygni like profile, are usually interpreted as radiatively driven winds associated to strong outflows from QSOs (e.g., Scargle, Caroff, & Noerdlinger, 1970; Turnshek, 1984). In the spectra of QQ04B, two more C IV absorption features are present at redshift z and z, suggesting a very rich environment for this pair or an interaction between the QSOs (see Table 3).
QSO05 — In the spectra of QQ05B we detect Fe II(2586) and Fe II(2600) lines at the same redshift of the Mg II doublet associated to the QSOF (EWr(2586) Å and EWr(2600) Å).
QSO07 — Associated to the Mg II absorption feature at redshift (see Table 3) we detect Fe II(2586) and Fe II(2600) lines with EWr(2586) Å and EWr(2600) Å. A Fe II(2382) line is present at the same redshift of the Mg II doublet at (EWr(2382) Å).
QSO10 — Two C IV doublets are superimposed to the C IV broad emission of QSOB. Their redshifts are and , corresponding to a velocity difference of km/s (see Table 3). Due to the large uncertainties in the QSO redshift determination from broad emission lines (see §4), both the systems could be associated to the QSO.
QSO13 — This pair was already investigated by Decarli, Treves, & Falomo (2009), which have noticed a non resolved Mg II absorption feature associated to the foreground QSO. Moreover they observe QSO13F in Ks band to detect the host galaxy. This allows to give a indipendent estimate of the host galaxy mass () that is consistent with the value estimated indirectly from the .
In the spectra of QSOB we identify two C IV doublet at redshifts discordant with that of the QSO ( and ). Due to their redshift difference the component of the doublets are superimposed, we thus infer the EWr assuming that the lines are not saturated and thus a theoretical doublet ratio value of DR (see Table 3).
| Mg II | ||||||
| ID | EW | EW | DR | zabs | ||
| [Å] | [Å] | [Å] | [Å] | |||
| QQ01F | 5954.7 | 0.860.15 | 5970.3 | 0.450.14 | 1.910.68 | 1.12940.0001 |
| QQ07B | 6378.1 | 0.460.06 | 6395.0 | 0.430.03 | 1.070.16 | 1.28100.0002 |
| QQ07B | 6531.0 | 1.100.04 | 6547.9 | 1.090.06 | 1.010.07 | 1.33550.0001 |
| QQ07B | 7042.9 | 0.580.06 | 7061.0 | 0.460.04 | 1.260.17 | 1.51860.0002 |
| QQ08B | 6958.9 | 1.020.10 | 6975.6 | 0.510.11 | 2.000.47 | 1.48820.0008 |
| C IV | ||||||
| ID | EW | EW | DR | zabs | ||
| [Å] | [Å] | [Å] | [Å] | |||
| QQ04B | 4691.5 | 0.540.03 | 4699.1 | 0.370.02 | 1.460.11 | 2.03020.0002 |
| QQ04B | 4713.4 | 0.270.02 | 4721.0 | 0.220.05 | 1.230.29 | 2.04430.0003 |
| QQ10B | 5438.4 | 0.220.03 | 5447.4 | 0.160.06 | 1.380.55 | 2.51270.0002 |
| QQ10B | 5444.7 | 0.190.06 | 5453.6 | 0.190.04 | 1.000.38 | 2.51670.0002 |
| QQ13B | 5142.3 | 0.140.03 | 5151.1 | 0.070.03 | 2.000.96 | 2.32150.0001 |
| QQ13B | 5151.1 | 0.400.03 | 5159.7 | 0.200.03 | 2.000.34 | 2.32720.0001 |
| Assumed value for DR (see text for details) | ||||||