Reproducing the observed abundances in RCB and HdC stars with post-double degenerate merger models - constraints on merger and post-merger simulations and physics processes
Abstract
The R Coronae Borealis (RCB) stars are hydrogen-deficient, variable stars that are most likely the result of He-CO WD mergers. They display extremely low oxygen isotopic ratios, 16O/18O , , and enhancements up to in F and in s-process elements from Zn to La, compared to solar. These abundances provide stringent constraints on the physical processes during and after the double-degenerate merger. As shown before O-isotopic ratios observed in RCB stars cannot result from the dynamic double-degenerate merger phase, and we investigate now the role of the long-term 1D spherical post-merger evolution and nucleosynthesis based on realistic hydrodynamic merger progenitor models. We adopt a model for extra envelope mixing to represent processes driven by rotation originating in the dynamical merger. Comprehensive nucleosynthesis post-processing simulations for these stellar evolution models reproduce, for the first time, the full range of the observed abundances for almost all the elements measured in RCB stars: / ratios between 9 and 15, C-isotopic ratios above 100, and 1.4 – 2.35 F enhancements, along with enrichments in s-process elements. The nucleosynthesis processes in our models constrain the length and temperature in the dynamic merger shell-of-fire feature as well as the envelope mixing in the post-merger phase. s-process elements originate either in the shell-of-fire merger feature or during the post-merger evolution, but the contribution from the AGB progenitors is negligible. The post-merger envelope mixing must eventually cease after the dynamic merger phase, before the star enters the RCB phase.
1 Introduction
RCB stars are rare F-G type supergiants belonging to the old bulge population in the Galaxy (Cottrell & Lawson, 1998; Tisserand et al., 2008). Their atmospheres are mainly composed of He, almost entirely depleted in H yet rich in C. They are near-solar mass single stars (except for DY Cen which is in a binary system, Rao et al., 2012) that have single or multimode pulsation cycles. The pulsations are considered to play a role in the deep, irregular brightness declines of up to 8 magnitudes (Clayton, 1996). These declines are attributed to clouds of dust ejected from their atmospheres, the evidence for which is an omnipresent IR signature around the star (Clayton, 1996). Such deep declines and IR excesses have not been observed in the otherwise chemically similar Hydrogen-deficient Carbon (HdC) stars or the hotter Extreme Helium (EHe) stars.
Other than the declines for which they were first noticed, RCB stars have been an enigma because of their anomalous chemical signatures and the possible evolutionary path (or paths) that may have led to their current state. The surface layers of RCBs are predominantly made of helium (mass fraction =0.98) and are carbon rich with CNO. They also have 12C/13C ratios larger than 40 – 100 (Hema et al., 2012) (compare with the CN-cycle equilibrium value 3.5 that is expected for H-burning ashes), F enhancements in the range of 1.0 – 2.7 (Pandey et al., 2008) and considerable overabundances of s-process elements compared to solar values (Asplund et al., 2000). This peculiar surface composition is indicative of material processed by H-burning and (partial) He-burning. The ratios in HdC and RCB stars have been a focus of many recent studies, starting with the discovery of an extremely low value of 0.830.02 in the HdC star HD 137613 (Clayton et al., 2005), as compared to the solar value of 500. RCB stars, as a class, have / ratios between 1 and 20 (Clayton et al., 2007; Garcia-Hernandez et al., 2010), probably the lowest ones measured anywhere in the Universe. The goal of this work is to construct post-merger models that can reproduce the unique chemical signatures of RCB stars, particularly their low / ratios and F enhancements.
The EHe stars have similar compositions (barring a few exceptions) as RCB stars, suggesting a common evolutionary origin and link. The surfaces of EHe stars are too hot to show CO bands, therefore their / ratios cannot be measured. As one of our primary goals in this paper is to model the low / ratios seen in RCB stars, we exclude EHe stars from our discussion. It should be noted however that EHes do have high F enhancements reported, like those in RCB stars (Pandey et al., 2008).
65 RCB stars have been found in the Milky Way and 25 in the Magellanic Clouds (Clayton, 2012). Two competing scenarios have been put forth to explain how RCB stars may have formed - the Final He-Flash (FF) model (Renzini, 1990) and the Double Degenerate (DD) white dwarf merger model (Webbink, 1984; Iben et al., 1996). In the FF model, a post-AGB star experiences a He-shell flash during the pre-white dwarf phase and evolves back into a giant configuration. In the DD merger scenario, a CO white dwarf and a less massive He white dwarf (WD) in a close binary system, formed as the result of one or more common envelope episodes, finally merge over a dynamic period of 100 – 1000 . In terms of number statistics, the expected number of RCB stars resulting from the merger of CO and He WDs is very close to the estimated RCB stars obtained by extrapolating the LMC RCB population (Clayton, 2012), which implies that only a small fraction has been found so far. Computational models and observational evidence also lean toward the DD model being the more plausible path out of the two scenarios to form RCB stars (Clayton et al., 2007; Lorén-Aguilar et al., 2009; Garcia-Hernandez et al., 2009). The main nucleosynthesis evidence comes from the 12C/13C and / ratios in RCB stars.
According to a single-zone analysis, rapid mass-transfer events in He+CO WD binaries could lead to thermodynamic conditions in which such ratios would originate (Clayton et al., 2007). Specifically, can be produced by partial He-burning via , without being destroyed by a further -capture to for a temperature in a range of 1.2 – 1.9 at a density of and on time scales of 250 – 320 . At these temperatures, is consumed by He-burning to form via , which leads to the high C-isotopic ratios observed in RCB stars, while the neutrons released from this reaction could produce s-process elements.
The thermal properties of a final-flash event are equivalent to those of an AGB thermal pulse, with temperatures in the convective He-burning shell as high as (Werner & Herwig, 2006; Herwig et al., 2011, and ref. therein) maintained for a long enough time to process and to (the latter via the reaction ). This may explain the lack of (from CO bands, Eyres et al., 1998; Geballe et al., 2002)) and F I bands (Pandey et al., 2008) in the spectrum of Sakurai’s object (V4334 Sgr) which is believed to be a final-flash star of the very late thermal pulse (VLTP) variant (Herwig, 2001, and references therein). In the VLTP event, 13C is produced by proton ingestion into the convection zone and their capture by 12C resulting in low 12C/13C ratios of 5 (Herwig & Langer, 2001; Herwig et al., 2011), which compares well with the observed value of in Sakurai’s object (Asplund, 1997, 1999). VLTP star models also predict Li enrichments (Herwig & Langer, 2001), as observed in Sakurai’s object, but there are only four Li-rich RCB stars.
A compact system of two WDs evolves from a pair of main sequence stars that are close enough to interact with each other through the exchange of gravitational wave radiation and magnetic stellar winds, causing a loss of orbital angular momentum from the system and thus reducing the orbital separation between the stars. Such close double-degenerate WD systems form over a period of years (Iben & Tutukov, 1984, 1987) through one or more episodes of mass-transfer (including at least one common-envelope interaction). The final merging of the two WDs occurs on a dynamic timescale (100 – 1000 seconds), with the less massive WD (the He WD) being tidally disrupted by the more massive one (the CO WD). Smooth Particle Hydrodynamic (SPH) simulations that follow this merging phase (Lorén-Aguilar et al., 2009; Raskin et al., 2012; Staff et al., 2012) show that the He WD material rapidly infalling on the CO WD causes the surface of the latter to be shock-heated, resulting in a hot corona feature, while the rest of the He-WD mass settles in a disk-like structure that extends to large radii.
One-dimensional He-rich homogeneous stellar evolution models with C, O and trace amounts of H showed promising evolutionary tracks into the RCB region in the HR diagram (Weiss, 1987). In an alternative approach, Saio & Jeffery (2002) represented the merger phase through accreting He-WD material (of a pure helium composition with a small H-rich envelope mass) onto a CO WD at the rate of year. Although the location of the final model in the HR diagram was consistent with that of EHes and RCB stars, the accretion rate was much smaller than the expected rapid mass-transfer rate of year (Staff et al., 2012; Lorén-Aguilar et al., 2009) during the final merging phase of WDs.
The SPH simulations of the dynamic merger phase of He and CO WDs, which were performed over a range of mass combinations by Lorén-Aguilar et al. (2009), included a 14-species nuclear network. The abundance yields in the hot corona of the final models of masses showed enrichments of Ca, Mg, S, Si, and Fe. Longland et al. (2011) carried out a one-zone post-processing nucleosynthesis analysis using the temperature and density conditions from the corona of the final model. The AGB model used to build their initial nuclear composition contained 7 nuclear species from to . They reported that, depending on the depth of mixing within the corona, the / ratio had decreased to 19 – 370. However, their total C and O abundances exceeded the upper limit for RCB stars and their F predictions were much lower than the observed values, while predictions for s-process element production were not available.
Jeffery et al. (2011) have investigated RCB surface abundances by using a cold mixing recipe, i.e. without nucleosynthesis during either the hot merger phase or the post-merger evolution. A 1-D ‘cold merger’ model involved mixing different proportions of masses of He and CO WDs, and a ‘hot merger’ model was built by incorporating the results obtained in the SPH simulations of He-CO WD merger systems by Lorén-Aguilar et al. (2009). In both cases, the elemental abundances obtained from their mixing recipe, barring those of C, N and O (and S in the hot merger model), fell short of the observed ones in RCB stars, particularly the s-process elements, which were assumed to originate exclusively from the progenitor AGB star. They concluded that even additional nucleosynthesis that may occur during the actual merger of He and CO WDs cannot help to reproduce the observed abundances of RCB stars.
Continuing the work by Clayton et al. (2005) and Clayton et al. (2007), Staff et al. (2012) (paper I) presented grid-based hydrodynamic merger simulations for a range of mass ratios () of CO and He WDs (of total mass ). A Shell of Fire (SOF) (similar to the hot corona of Lorén-Aguilar et al., 2009) was identified in the merged object, and that feature was analyzed for the potential formation of low / ratio material. Single-zone nucleosynthesis calculations using the , conditions of the SOF of three cases were made for a range of initial abundance distributions derived from a variety of appropriate AGB progenitor models. Those were taken from the NuGrid111http://www.nugridstars.org library of detailed post-processed, fully evolved models of solar metallicity that ranged from the early AGB to the advanced thermal pulse stage (Set 1.2, Pignatari et al., in prep). The composition of the He WD was taken to be uniformly mixed and was extracted from a low mass RGB star. In contrast to the results of Longland et al. (2011), we found that within the dynamic phase, the / ratio in the SOF was of the order of 1000. The difference in the / ratios between the two simulations may arise from the difference in the total mass considered. In any case, according to our results, the low observed / ratios of RCB stars cannot originate from the dynamic merger phase, but if the temperature and density conditions were maintained for a longer period of time, then / ratios between 4 (, ) to 30 (, ) could be obtained.
Following the results of paper I, we now explore the the long term post-merger evolution with the goal of identifying conditions under which this evolutionary phase could reconcile the present stark discrepancy between models and observed surface abundance of RCB stars. We are motivated by the fact that merging WDs are considered to be paths to the creation of many other interesting stellar objects, such as Type Ia supernovae and neutron stars (Han, 1998; Nelemans et al., 2001a; Napiwotzki et al., 2001), sdB stars (Saio & Jeffery, 2000; Han et al., 2002), AM CVns (Solheim, 2010) and even planetary nebulae (De Marco et al., 2009). The rich and detailed observational picture available for RCB and HdC stars gives an opportunity to constrain DD merger and post-merger physics in general, thereby providing a quantitative understanding of the objects mentioned above.
The long term evolution of such merged systems may be characterized by the formation of an accretion disk from the secondary WD (Yoon et al., 2007; van Kerkwijk et al., 2010). Alternatively, the post-merger object may undergo a more viscous, star-like evolution with the Keplerian rotation in the envelope eventually dying out (Shen et al., 2012; Schwab et al., 2012). We follow the latter scenario for the post-merger evolution, and we assume the merged object to evolve as a hybrid C/O-He star undergoing rotation-driven mixing in its envelope. We construct spherically symmetric one-dimensional models of merged WDs, with a range of initial conditions and follow their evolution into the domain of the HR diagram where RCB stars are observed to lie. Along with convective mixing, these models also include an induced, continuous mixing profile assumed to result from the rotation of the merger-remnant. We then perform a multi-zone post-processing nucleosynthesis analysis of these models and compare their surface abundances with those of RCB stars.
This paper is organized as follows. Section 2 describes our simulation methods, where the progenitor evolution of the system, the construction of the initial models, a brief description of the codes we used, the formulation of the mixing profile, and the four post-merger evolution cases that we studied. This is followed by Section 3, where the stellar and nucleosynthesis processes of the model during its evolution are described and compared with each other and with the RCB star observations. We close with the discussion and conclusions in Section 4.
2 Methods
The post-merger simulations are building on our previous dynamic merger simulations (paper I). They involve the construction of appropriate initial models for the post-merger evolution, starting with the abundance profiles that take into account information for all observed species from realistic progenitor models as well as our best estimates of nucleosynthesis in the dynamic merger phase (i.e. in the SOF). The initial abundance profiles are homologously imposed on a homogeneous zero-age main-sequence model of the same mass, so that within a thermal time scale the stellar structure is determined by and consistent with the post-merger abundance profile. The stellar evolution of these objects is followed into the RCB region of the HRD, and then post-processed with the same complete nuclear network (using the NuGrid PPN codes) that has been used to generate the progenitor models. In this way our models take into account nuclear production during the progenitor evolution, the hot merger phase (paper I) as well as any production during the post-merger phase, which - as we show here - is essential to reproduce the observed abundances of RCB stars.
2.1 Progenitor evolution and outcome of dynamic merger phase
The progenitor evolution of a double-degenerate merger evolves from a close binary of low- and intermediate-mass main sequence stars, and involves a common envelope (CE) event when the primary becomes a giant star (e.g. Iben et al., 1996). CE events are expected to have occurred in close binary systems with at least one WD component (De Marco et al., 2011; Passy et al., 2012). The outcome of the second CE event is a close binary with CO and He WDs. This progenitor evolution matters here only in as much as it determines which RGB and AGB models should be considered when constructing the initial abundance distribution out of their combined He and CO cores, as described in Staff et al. (2012).
The final merging of the two WDs takes place within a dynamic timescale of – and results in a structure consisting of a CO core surrounded by a shock-heated layer and an envelope in Keplerian rotation (Lorén-Aguilar et al., 2009; Dan et al., 2012; Raskin et al., 2012). In our hydrodynamic simulations reported in paper I, this hot and very dense SOF lasted until the end of the simulations. The SOF is the region where nucleosynthesis can occur within the dynamic time scale. The final nuclear production of the SOF will depend on how long it lasts beyond the end of simulations.
The post-merger evolution is determined by the interplay of thermal dissipation, angular momentum transport induced by rotational instabilities and magnetic fields, and the nuclear time scale of H- and He-burning shells. How these ingredients interact is still uncertain, and with regard to the influence that nuclear burning has on this phase differences may exist depending on the composition of the merging WDs. Considering the merger of two CO WDs the merger has been described as an accretion of the post-merger disk remnant onto the core over a timescale of either years (Yoon et al., 2007) or few hours (van Kerkwijk et al., 2010). Alternatively, the post-merger object couples the rigid primary WD and the tidally disrupted secondary WD undergoing Keplerian rotation through viscous mechanisms (from magnetohydrodynamic instabilities) that stimulate transport of angular momentum over a period between and seconds (Shen et al., 2012). These shearing forces may also increase the peak temperature of the SOF/corona of the remnant by a factor of 2 and work on expanding the material to larger radii. Schwab et al. (2012) considered a range of WD combinations including He+CO WD mergers. They show that, towards the end of such a viscous phase, the remnant evolves towards a spherically symmetric, almost shear-free steady state with a thermally-supported envelope in solid body rotation (although the case with the smallest CO to He WD mass ratio shows the largest asymmetries of all cases). These authors expect the subsequent evolution to be star-like, growing into a giant star, with the luminosity from its internal nuclear-burning driving convection in its cool extended envelope. Such evolution represents a path from the merger of white dwarfs to the formation of RCB giant stars.
Following the latter scenario, we construct the initial composition profile for our long-term post-merger simulations to be comprised of a CO core, an SOF, and an envelope with rotationally induced mixing, predominantly made of the former He WD.
2.1.1 The post-merger composition profile
The first step in building the internal composition of the post-merged object is to choose the progenitor AGB and RGB stars of the CO and He WDs respectively. These progenitor models determine when the CE interactions will take place and therefore cannot be uniquely determined a posteriori. We consider two out of the three CO-WD progenitor models introduced in paper I. Accordingly, the CO WD is the progeny of either an early-AGB (E-AGB) or advanced-thermal pulse AGB (A-TP AGB) star. The difference between these progenitors is in the amount of s-process elements in the outer layers of the CO WD222However we find that this s process material in the progenitor AGB is not the origin of the observed s-process overabundances in RCB stars, cf. Section 3, as well as the thickness of the He-rich layer. In both cases, the CO WD has a H-rich envelope of the order of . The RGB model for the He WD has a more massive H-rich envelope of . These WD mass dependent amounts of H have been chosen according to stellar evolution simulation results (Staff et al., 2012, see Fig. 8, paper I) and play - as we will show - an important role in reproducing both the CNO elemental abundances as well as providing for the formation of the neutron source isotope . The masses of the different layers of the WDs are listed in Table 1.
| WD | Progenitor () | / | / | |
|---|---|---|---|---|
| CO | E-AGB (3.00) | 0.58148 | 0.4876 (He-free) | 2.4 |
| CO | A-TP AGB (2.00) | 0.61243 | 0.5789 (He-free) | 1.7 |
| He | RGB (1.65) | 0.3024 | 0.296 (H-free) | 64.3 |
The various components of the pre-merger WD composition are combined by taking into account the dynamic mixing and the SOF nuclear burning, both derived from the merger simulations of paper I. This leads to a four-zone model consisting of the relatively cold, degenerate core of the CO WD, a thin buffer zone, the SOF itself, and a relatively cold envelope (Fig. 1).
For each mass ratio, , a certain fraction of mass () is dredged up from the CO WD () and mixed with the He WD () material in the envelope. The amount of dredge-up defines the outer boundary of the core, (Eqs. 2.1.1). As this dredged-up mass from the He-rich layers of the CO WD mass () is pulled up to the envelope (Staff et al., 2012, see Fig. 11 of paper I ), an equal mass of He WD makes its way into the CO WD. Thus a partially mixed zone is formed between the two WDs. A major portion of the mass in this zone is occupied by the SOF (), while the rest is in the buffer zone between the core and the SOF (). A small fraction of the mass from the He WD (that penetrates the CO WD and forms the partial mixing zone) resides in the SOF (), while a larger part finds itself located in the buffer zone333The detailed properties of this buffer zone are difficult to extract from the 3D merger simulations for the purpose of mapping them into the 1D profile. However, it turns out that these details are not important for the final RCB abundance predictions..
The initial SOF composition is thus dominated by the mass dredged up from the CO WD (). As in paper I, we assume that the exchange of masses during the dynamic merger phase occurs before the onset of burning in any given layer. Correspondingly, the SOF layer is subjected to nuclear processing according to the conditions in the SOF derived from the merger calculations (see Section 2.1.2 for two cases considered for SOF processing). The result of this nuclear processing is then entered into the post-merger abundance profile. Finally, the envelope () contains the fraction of from the CO WD that is not present in the SOF and the remaining He WD mass.
| (1) | |||
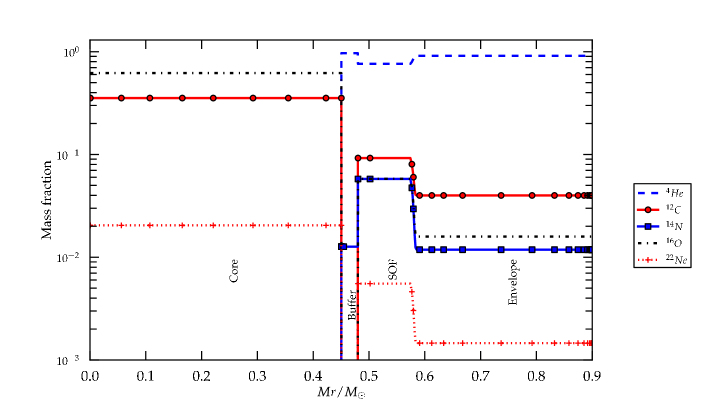
Motivated by the merger simulations, we assume that the He-rich envelope is completely mixed during the merger process. The most important consequence of this assumption is the uniform distribution in the post-merger envelope of H from the former H-rich He-WD envelope. After extracting the abundances from each zone of the progenitor models, the isotopic abundances of that zone are averaged over its mass.
2.1.2 The four post-merger cases
The key parameters of the post-merger models are the pre-merger WD mass ratio, the amount of dynamic dredge-up from the CO WD, the type of CO-WD progenitor model, and the temperature and duration of the SOF nuclear burning in the dynamic phase. We focus here on four representative combinations of these parameters.
The dynamic merger simulations predict dredge-up depths ranging from 15% to 18% of mass into the CO WD for the three low- cases. In the outer layers of the He-free core of the CO WD is the most abundant isotope. If material is dredged up from these layers the star becomes more enhanced in oxygen than in carbon at its surface, which is not observed in RCB stars. The other problem of dredging up high amounts of oxygen is that the star would have much higher ratios than observed in RCB stars, even when post-merger nucleosynthesis effects are taken into account (see below). Therefore, in order to avoid an excessive surface enrichment in , the adopted mass of dredge-up from the chosen CO WD models is lower than the values obtained in the hydrodynamic simulations. We thus restrict the dredge-up depth in our models to layers just above the He-free core of the CO WD (ranging from 5.4% in the A-TP to 15% in the E-AGB CO WD model, Table 2).
| CASE | AGB | (%) | colour | |||||||||
|---|---|---|---|---|---|---|---|---|---|---|---|---|
| 1 | 0.53 | 0.37 | E-AGB | 15.0 | 0.4505 | 0.0295 | 0.1000 | 0.32 | short | 1.23 | 1.02 | orange |
| 2 | 0.53 | 0.37 | E-AGB | 15.0 | 0.4505 | 0.0295 | 0.1000 | 0.32 | long | 1.23 | 1.11 | red |
| 3 | 0.53 | 0.37 | A-TP AGB | 5.4 | 0.5014 | 0.0107 | 0.0346 | 0.35 | short | 1.23 | 0.97 | blue |
| 4 | 0.60 | 0.30 | E-AGB | 15.0 | 0.5100 | 0.0141 | 0.1060 | 0.26 | long | 2.42 | 2.75 | green |
We consider two mass ratios from paper I, i.e. the case ( = 0.53 and = 0.37) with an SOF of K and , and the case ( = 0.60 and = 0.30) with an SOF of K and . The buffer zone has a temperature of approximately and the same density as the SOF, which is not hot enough for nucleosynthesis on the dynamic time scale. Similarly, the core and envelope are too cold for nuclear reactions during the merger. The duration of the high-T conditions in the SOF may extend beyond the time period covered by the hydrodynamic simulations, at the end of which the SOF is still hot. In addition, as pointed out in paper I, those simulations ignore any feedback of nuclear energy production during the hydrodynamic phase, which may affect the conditions and duration of the SOF. In order to project the impact of different SOF assumptions, we consider a short SOF with a duration of and a long SOF with a duration of , both of which are within the viscous timescale determined by Shen et al. (2012).
The four initial abundance profiles combine two CO-WD progenitor models, two mass ratios ( and 0.7) with their respective SOF parameters (, and the proportion of CO and He WDs in them), as well as the short or long duration of SOF burning, as summarized in Table 2.
2.2 Stellar evolution and nucleosynthesis simulations
For the post-merger evolution, we use version 3851 of the stellar evolution code MESA (Paxton et al., 2011). Initial models are created from a homogeneous (the total mass of the WDs in the hydrodynamic simulations of paper I) zero-age main-sequence model. This model is then relaxed to each of the four-zone post-merger abundance profiles.
The star is evolved with a mass loss rate obtained by setting the coefficient of Blöcker’s wind formula to , similar to what is used in the NuGrid AGB simulations. From the options available in MESA, we use the OPAL type I opacities for a solar abundance distribution rather than the more appropriate type II opacities that allow C and O enhancements from He-burning in the composition. This choice may seem odd, since the irregular dust-ejections associated with the unusual C dominated surface composition represent a defining property of RCB stars. However, with our one-dimensional simulation approach for the post-merger phase we can not hope in any case to reproduce the irregular, and most likely aspherical mass ejection and dust formation processes. In our stellar evolution simulations mass loss is therefore only imposed via the Blöcker formula with an efficiency parameter choosen to obtain an order of magnitude appropriate mass loss rate. Therefore, our choice of opacity will only have minor effects on the stellar temperature during the RCB phase.
Indeed, individual test runs with type II opacities evolve to lower temperatures than their type I counterparts, but the nucleosynthesis and mixing evolution is in both cases the same. However, models with type II opacities turn out to be much more difficult to converge, probably reflecting some of the instabilities that do lead to the irregular variability seen in RCB stars. Further, the type II opacity runs did not show differences in the envelope convection properties that would have altered our assumptions for the adopted mixing profile (Section 2.3). Thus, the surface abundance predictions remain the same in models with and without CO enhanced opacities, and we choose to present here a homogeneous grid of cases calculated with type I opacities.
Once the stellar evolution calculations are completed, the track is post-processed for a complete nucleosynthesis analysis. We use the NuGrid multi-zone nucleosynthesis code MPPNP (Herwig et al., 2008) that processes each of the 1300 zones for each of the 3000 time steps of the stellar evolution track with an adaptive nuclear network that includes all stable as well as all relevant unstable species (over 1000 isotopes) and their corresponding nuclear reactions. The post-processing code also mixes species after each time step, according to the mixing processes considered in the stellar evolution simulations.
2.3 The mixing model
RCB stars show abundance signatures at their surfaces that originate either in the SOF or in the nuclear processes during the post-merger evolution. Mixing in the envelope reaching into the nuclear processing region needs to bring such nuclear processed material to the surface. Early on in our investigation it became clear that convection alone would not be sufficient to provide this essential mixing ingredient in the envelope.
The physical mechanisms of non-convective mixing processes that may occur during or after a merger are quantitatively not understood. In any case, the merger remnant is rotating, and it is reasonable to associate this rotation with mixing processes. Shen et al. (2012) estimate that differential rotation in such an object would last for at least seconds after the merging phase, after which it would evolve towards solid-body rotation (Schwab et al., 2012). The exact timescale for evolution towards solid-body rotation may be uncertain, but some mixing processes, such as meridional circulation, can be driven by solid body rotation as well.
Considering the significant uncertainties regarding both the realistic rotation profile and the physics of rotation-driven mixing, we adopt an empirical approach to additional mixing processes in this study. This means that our primary goal is to identify a reasonable mixing law (a diffusion coefficient profile) that is capable of reproducing the observed abundance patterns in RCB stars.
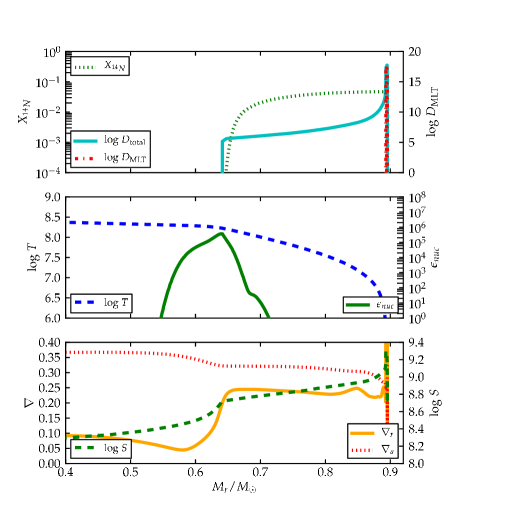
The diffusion coefficient in our mixing model () consists of convective mixing () predicted by the mixing length theory (MLT) and an additional mixing () component. The mixing is always restricted to the region above ( = in each case) (Eqs. 2.1.1 and Table 2). is the Eulerian representation of a constant mass diffusion coefficient that drops sharply at the point where an entropy barrier appears due to the peak of nuclear energy generation. The location of this energy peak can be approximated as the mass-coordinate corresponding to a specified fraction of the 14N abundance that has still remained at this depth during He-burning, , where is the mass fraction of at the mass coordinate where the mixing drops, and is the maximum mass fraction in the model at that time (Eqs. 2, Fig. 2).
The sharp drop of at the mass-coordinate is modeled by an exponential decrease of the mixing efficiency. This transition from the extra-mixing zone to no-mixing is formally similar to how the depth-dependent convective overshooting is implemented in the MESA code, and like in the latter case, the width of this transition region is determined by the parameter in the exponent of Eq. 2c (see the steep ramp in in Fig. 2).
| (2a) | |||||
| (2b) | |||||
| (2c) | |||||
| (2d) | |||||
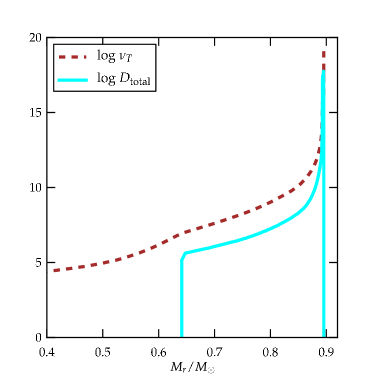
where is the temperature at the mass coordinate . This mixing model is specified with the following parameters: , =0.003 and =0.05. The resulting Eulerian diffusion profile is shown in Fig. 2. In Fig. 3, is compared with the thermal diffusivity for one of our considered cases. It is seen that everywhere inside the star, which means that the additional mixing could be driven by a secular instability rather than by a dynamical one. It is interesting that the ratio between and , , is close to that used by Denissenkov & Pinsonneault (2008) to model extra mixing in low-mass red giants.
The effects of varying the free parameters in Eqs. 2 are briefly summarized here. When we increase by more than two orders of magnitude, the mixing becomes so fast that it causes an excessive increase in and abundances at the surface and a proportional decrease in that disagree with observations. There is also a risk for the star to become more enhanced in oxygen than in carbon, the opposite of which is observed in almost all RCBs. Making lower by a factor of causes the mixing to become far too slow in dredging up and to the surface. As the star enters the RCB phase, it becomes more N-rich than C, which again is not observed for any RCB star (except for one).
The surface chemical abundances of the star vary within an order of magnitude when the value of the parameter is varied between and . Below the mass coordinate , the diffusion profile drops very steeply. Allowing mixing to proceed deeper into and through the He-burning shell would cause an excessive dredge-up of . In addition, and produced by partial He-burning would be destroyed in this case. On the other hand, limiting the mixing to layers entirely above the He-burning shell would prevent these two species from being formed. Note that the location of diminishing mixing efficiency is physically motivated to coincide with the location of a steepening positive entropy gradient associated with the He-burning shell.
A small ramp appears in just as it nears . The beginning of the slope of the ramp and its steepness are decided by the rather sensitive parameter in the exponent function of . The ramp feature affects the content of , and at the surface (more discussed in Section 3.2.2). The optimal abundances in the star at a given value of and are maintained when is chosen between and .
Finally, we see indications from comparison with observed RCB star abundance features that the mixing law should be time dependent. In order to reproduce all the features, mixing must be strongly reduced shortly before the star enters the RCB region of the HR diagram, as will be discussed in Section 3.3.1.
3 Results
In this section we describe our results, starting with the nucleosynthesis in the shell of fire in order to define the initial conditions for the post-merger stellar evolution simulations, and finally we describe the nucleosynthesis in these post-merger evolution models. The original simulation output is available for further analysis, see Section A.
3.1 The Shell of Fire (SOF)
The formation and evolution of the shell of fire feature in the dynamic merger simulations has been described in detail in paper I, where we have also presented nucleosynthesis simulations. Here we just need to briefly review and update those results with a focus on the conditions for the production of n-capture elements, such as the s-process elements.
The temperature in the SOF depends on the mass ratio of the merging white dwarfs. For the post-merger simulations presented here we consider two SOF cases: case 4 is based on a high- (, ) SOF while the other cases are based on a low- SOF (, ).
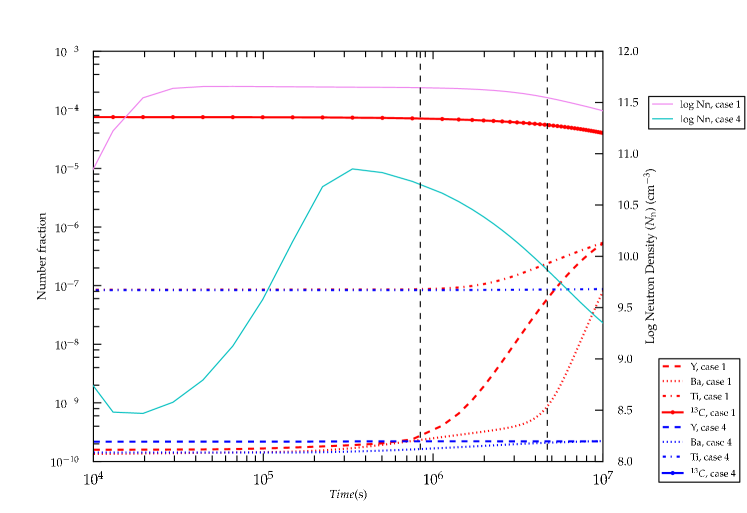
In the low- SOF forms early on at a level of by mass and exceeds the abundance of while reaches . In this situation neutrons are steadily released via the reaction with a neutron density reaching a peak value of (Fig. 4). An interesting neutron-recycling effect is at play here, in which protons released by are mostly creating another and then again a neutron. This explains why the abundance shown in Fig. 4 decreases more slowly than expected considering just the -capture reaction at that temperature.
In any case, sufficient neutrons are available to cause a steady increase in the abundance of s-process elements along with nuclei such as Ti. This production of n-capture elements becomes relevant only after after the dynamic merger phase. Post-merger evolutions have been considered for short and long SOF cases (Table 2) and these differ in the amount of n-capture elements originating in the SOF (see position of vertical lines in Fig. 4). Only in the long-SOF case do s-process element enhancements originate in the SOF, and provide abundances of n-caputure elements that agree with RCB star observations.
In the high- SOF case is destroyed by He-burning within seconds, and although reaches a higher peak value of , it is immediately reduced by neutron poisons, such as and (Eq. 11, Fig. 15, paper I). Later at seconds, the neutron density once again increases and reaches a lower peak value of through the neutron-source reaction . But these neutrons are also not available for the production of s-process elements due the presence of the neutron poison. As a result s-process elements and elements such as Ca and Ti are unaffected in the high- SOF and remain close to their initial values (Fig. 4).
3.2 Stellar and nucleosynthesis evolution
3.2.1 The evolutionary tracks
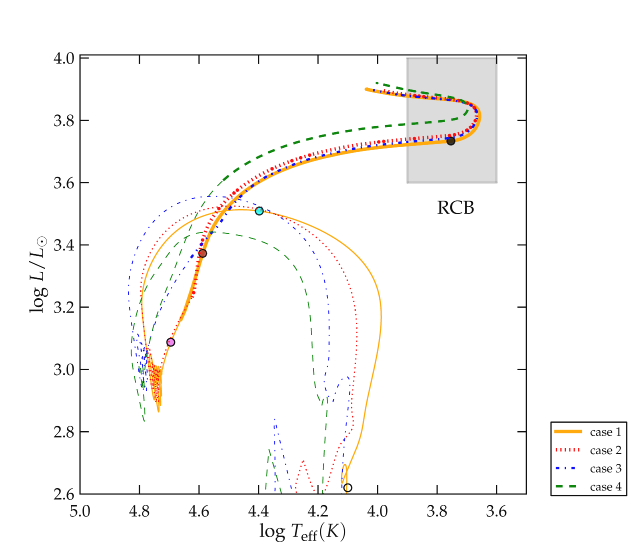
The evolutionary tracks of the four cases start at low luminosity in the HR diagram and are similar to each other (Fig. 5). The thin lines in the lower portion of the plot correspond to the initial H-shell burning period and are not expected to reproduce all details of the ongoing thermal readjustment of the post-merger star. Fortunately, the details of this part of the evolution are not important for the RCB star surface abundance predictions. However, the thicker lines indicate when He-shell burning takes over, and the star is now in hydrostatic and thermal equilibrium and evolves on the nuclear timescale of the He-burning shell. Observed RCB stars can be found in the range and (Clayton, 1996; Pandey et al., 2008).
The models spend between (case 3) and (case 4) in the RCB phase. This age is obtained when the mass-loss rate is . Increasing the mass-loss rate decreases the time spent in the RCB phase. A mass-loss rate of would reduce the period of the RCB phase of the model to years, which is the expected period of the RCB star phase (Clayton, 2012).
3.2.2 Nucleosynthesis and mixing: origin of and
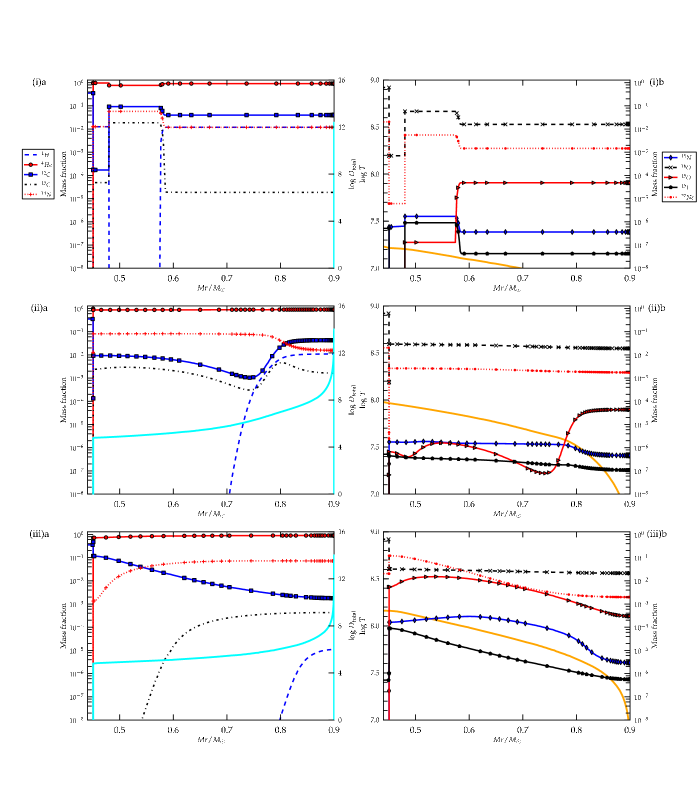
We discuss the different phases of burning and associated nucleosynthesis processes that occur in the post-merger evolution of our models by focusing on case 1 (Table 2). Dots along the HRD track in Fig. 5 correspond to the profiles shown in Fig. 6. Figs. 6(i)a and b show the initial abundance profiles of additional isotopes (compared to Fig. 1) for case 1. The second set of panels (corresponding to the cyan dot in Fig. 5) shows CNO-cycle burning of the hydrogen contributed to the merged CO+He WD system from the H-rich envelope of the original He WD, which was uniformly distributed throughout the He WD in our construction of the initial model (cf. Section 2.1.1). The maximum temperature during this phase is K, and the H-shell leaves (via ) and (via ) behind. This phase results in an overall increase in the abundances of and in the envelope.
Eventually, the temperature at the core-envelope interface increases further to , and beginning at (cf. Section 2.3), He-shell burning starts (violet dot in Fig. 5). By this time, the H-shell has almost completely burnt outwards to retreat to a thin layer close to the surface (Fig. 6(ii)a). The first neutron burst, via -capture on is triggered at this time, and consequently the -shell moves outwards as it gets burnt to .
In the time between panels (ii) and (iii) of Fig. 6 (violet and brown dots in Fig. 5), partial He-burning of raises the to its peak value, where K, while some of this begins to get destroyed to by further -capture closer to .
As He-burning starts, the reaction releases neutrons at a low density of cm-3. This is too little to produce s-process elements, in particular in view of the large abundance that acts as a neutron poison for the s process. However, the neutron poison reaction enables the production of . The abundances of and increase via the reaction chain . Panel (iii) shows how this reaction chain is able to produce and efficiently in this simultaneous slow mixing and burning environment. The challenge for any scenario for the simultaneous production of and is the relative efficiency of the -capture, which is increasing in the order , , and finally . appears in the more external layers, where releases neutrons. However, can only form from in deep enough layers, where typically would already be destroyed. Therefore, mixing must be fast enough to bring below the region where can form, but slow enough to not transport all that down where it would react with particles into .
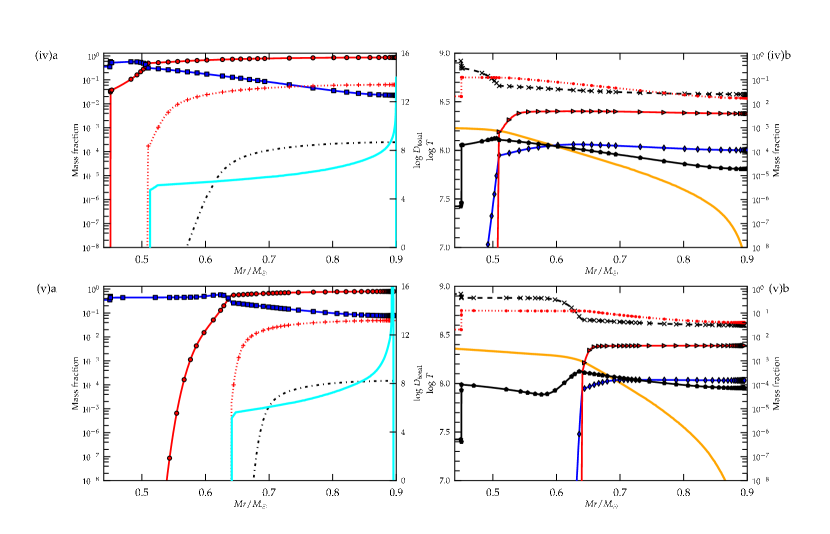
This balance between mixing processes and nucleosynthesis is also realized in the ramp region (Eq. 2c) of our adopted mixing profile. Such a continuous transition from the envelope mixing regime to the non-mixed core is a physically reasonable assumption, and it has to be emphasized that without such a ramp transition our models can not reproduce the observed abundances of F as well as they do. It is this ramp transition region that is responsible for much of the continuous increase in during the later part of the evolution of our model stars to the RCB star regime (panel (iv) and (v) in Fig. 7, black dot in Fig. 5).
If we assume that the diffusion coefficient drops more steeply at (via the parameter in Eq. 2c), then less is produced. For a larger parameter, the mixing profile extends deeper and the surface amount of decreases, while that of increases. Therefore, the combined abundance evolution of and provide strong limits on the width of the transition region between the mixed envelope and unmixed core at and below the He-burning shell. With our choice of the models are allowed to produce the maximum amount of without destroying too much and increasing the at the surface. The ramp-transition feature is thus a sensitive, integral and unavoidable part of the mixing profile.
In panel (iv), Fig. 7, has risen at to K, and the triple- chain has been fully activated causing to increase and a further -capture causing to increase (Fig. 6(iv)a). Below , at which the mixing profile drops, complete He-burning of and to takes place. By the time the star enters the RCB phase in the HR diagram, it has a strong He-shell burning (panel (v) of Fig. 7, black dot in Fig. 5). Between panels (iv) and (v), a second weaker neutron-source, that of , is initiated through . The neutron densities () during the post-merger evolution range between and .
The decrease in mixing efficiency follows the He-burning shell by design (cf. Section 2.3, Eqs. 2). This design prevents the material that is processed by strong He-shell burning, such as and, particularly, , from reaching the surface (panels (iv)a and (v)a, Fig. 7), where it would cause surface abundance changes that are not observed. The design also prevents and isotopes from above to be mixed to the higher temperatures in the interior, where they would be easily destroyed. Thus, the formulation of the mixing profile avoids an excess pollution of the surface by and preserves the and abundances in the envelope. As explained in Section 2.3, the fast decrease in mixing efficiency in our mixing model is motivated by the positive entropy gradient induced by the He-burning shell.
3.2.3 s process in the post-merger evolution
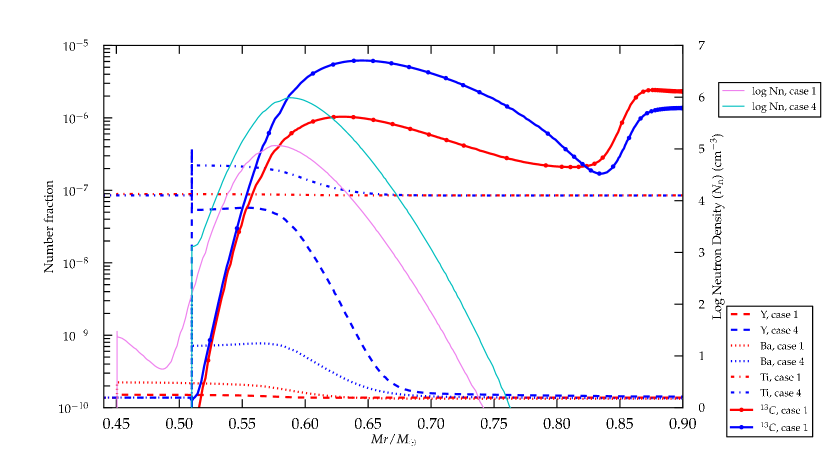
As seen in the previous section n-capture nucleosynthesis plays an important role in producing the observed F abundance. In case 4 (, high- SOF, no SOF s-process production, c.f. Section 3.1) the neutron exposure in the post-merger evolution is sufficient to produce s-process elements. In this low- case we have deduced a higher dredge-up mass from the dynamic merger simulation which implies a higher initial abundance of . The lower He-WD mass of the low- case implies a larger WD envelope mass and therefore a larger proton abundance in the post-merger envelope. Taken together the low- post-merger evolution features a larger amount of the n-source . This leads to a higher neutron density in case 4 () compared to cases 1 – 3 () (Fig. 8). Thus, in the post-merger evolution of case 4 the abundances of s-process elements are increased by up to (e.g. in the case of Y) from their initial values. In cases 1 – 3 the post-merger evolution n-capture nucleosynthesis is significantly less efficient.
3.3 Comparison of the surface abundances in our models with observations
RCB stars are classified into two categories based on their values of [Fe] and Si/Fe and S/Fe ratios (Lambert & Rao, 1994). RCB minority stars (plotted as black squares, Fig. 9) are identified as having lower [Fe] and higher Si/Fe and S/Fe ratios than the majority (plotted as black stars, Fig. 9). We adopt the data of measured elemental abundances of RCBs summarized by Jeffery et al. (2011) and use the solar scaled log representation of abundances, i.e. [X]= where log , being the relative number abundance of species . This data summary does not include the individual error bars on each data point, but in general the errors are quoted to be .
3.3.1 C N O : constraints on the mixing
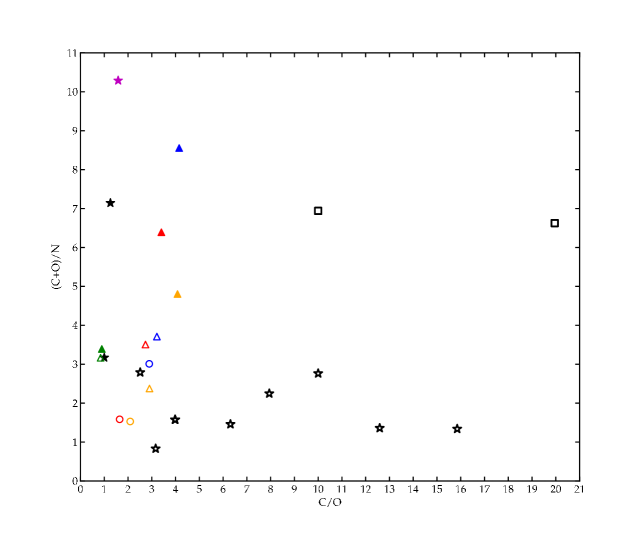
The abundance of C+O traces He-burning, while the C/O ratio signals the relative importance of the triple- to reactions which is sensitive to temperature. The elemental abundance of N is the result of CNO processing. Therefore, the (C+O)/N ratio indicates the relative importance of He- to H-burning processes in determining the observed abundance distribution in RCB stars. Their distribution in the (C+O)/N vs. C/O plane shows that the majority lie in a particular range of (C+O)/N ratio, of 1 – 3 and are more spread in their C/O ratio, with most RCBs having a value of 1 – 10 (Fig. 9). We find that on keeping the amount of mixing constant at the initial value of in our models, the in the envelope reduces continuously by being burnt to and this causes an overall decrease in the mass fraction of nitrogen at the surface. On continuing the evolution of the model at the same rate of mixing up to the end of the RCB phase, the (C+O)/N ratio increases at least by up to a factor of 3 higher than its value in most RCB stars (except for 3 stars in Fig. 9 but these have NO). If the rate of mixing is lowered and restricted to smaller depths from the surface once the model attains the (C+O)/N and C/O ratios of most RCBs (the empty circles in Fig. 9), the on the surface is preserved through the RCB phase of the star. Thus in order to attain the distribution of C, N and O of RCBs, our models strongly indicate that the magnitude of mixing and its reach from the surface must decrease with time. Schwab et al. (2012) find that continuous transportation of angular momentum from the merged system causes differential rotation to reduce in the envelope. Although the timescale over which they see this happens in their simulations is shorter than what our models indicate, the idea that such a reduction in mixing driven by rotation can happen is very feasible.
The difference in the surface abundances between restricting mixing at the time when the model lies in the observed domain of (C+O)/N and C/O and on continuing mixing as the star enters the RCB phase, is not significant for elements between Na and La. However a considerable difference of the order of does arise in the C, N, O and F abundances as seen in in Fig. 10. Case 4 does not at any point of time in its evolution have a model with CNO on its surface (hence the absence of circles in Fig. 10) and its O-content is almost the same as the C-content in its surface.
3.3.2 Elemental surface abundances
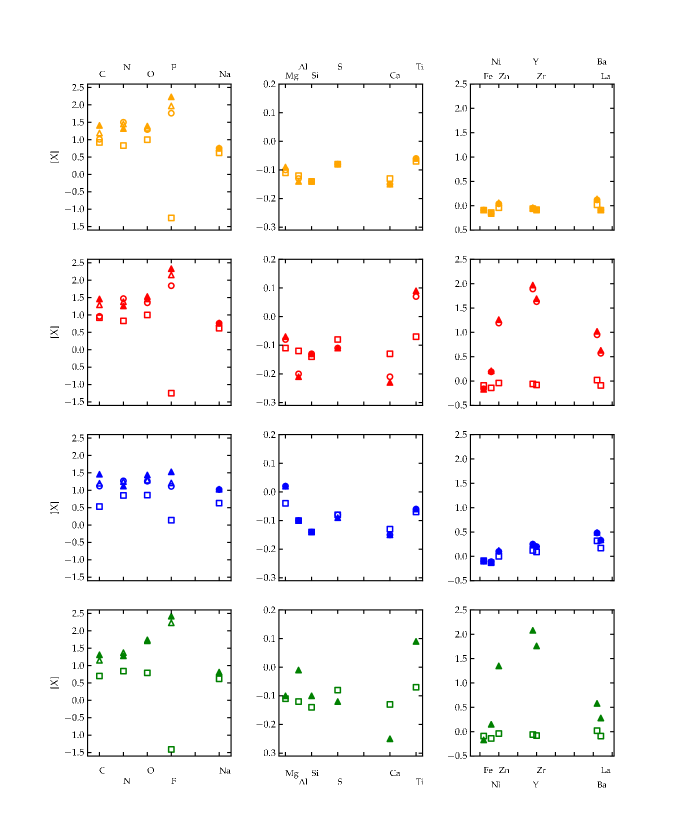
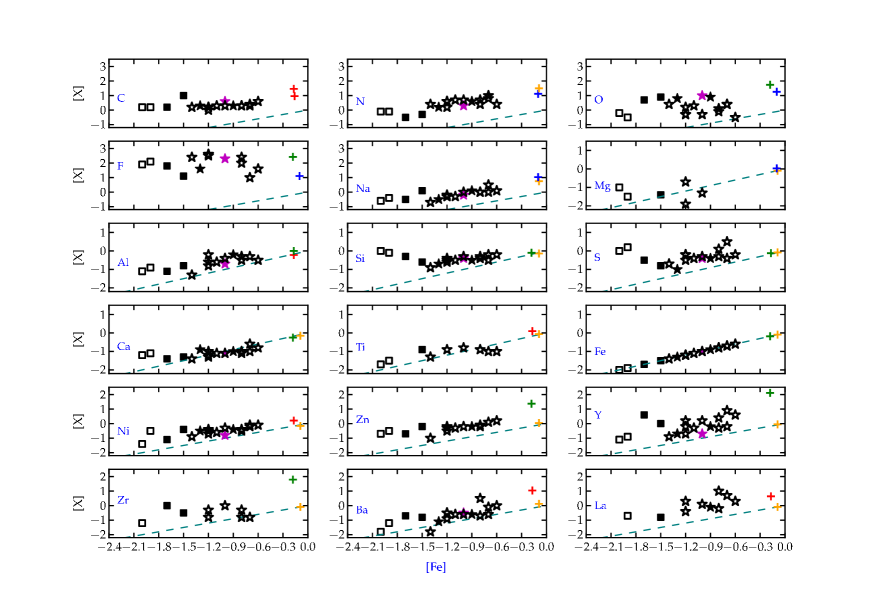
In this section we provide an element by element discussion based on the following diagrams. Fig. 10 provides a summary for the surface abundance evolution through the RCB phase of all four cases. Fig. 11 compares the O-isotopic ratio and F abundance of models with observations. The [X] values of the observed nuclear species in majority and minority RCBs are shown in Fig. 12, along with the lowest and highest values of each element from the four cases, between the time when star attains the observed C/N and N/O ratios in RCBs and when it exits the RCB phase in Fig. 5.
As RCBs are associated with the old bulge population (intermediate Pop II, Sec. 1), we assume that their range of Fe abundances reflects their initial metallicity. Our models were constructed with solar metallicity, which allowed us to take advantage of our detailed nucleosynthesis and stellar evolution progenitor models, currently available only at this metallicity. Fortunately, this does not affect the relevance of our models for comparison with observations in any significant way. The nuclear species in our models can be divided into primary and secondary types, depending on the nature of the processes that affect their abundances. With this difference in mind our models can be compared with observations of RCB stars for a range of metallicities in the following way.
The primary elements are formed entirely from the burning of H and He and so, are independent of the initial [Fe] abundance of the star. Therefore, in Fig. 12, one must compare only between the [X] values of these elements between the models and the observations.
The abundances of secondary elements in the model depend on the proportion of their seed nuclei which were formed in previous generations of stars. These include species between Na and Ti and the s-process elements. Therefore, in Fig. 12, one must compare the offset of the [X] value of the element with the solar scaled composition shown as a dashed green line.
H and Li:
The high amount of hydrogen depletion reported for all RCBs, is a natural outcome of our models. But Li being a fragile element is easily destroyed by H- and He-burning during the merging phase of the WDs itself and consequently in our models too. Therefore we do not include H and Li in the discussion of surface abundance results.
Primary elements
C, N, O and F:
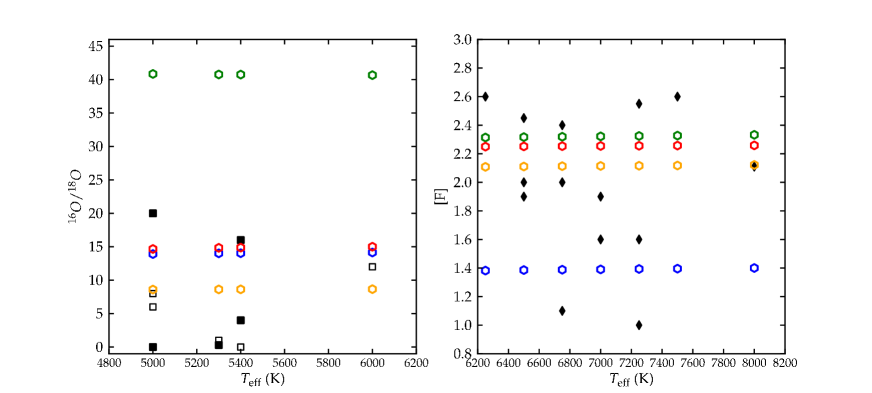
One of our main objectives in this work was to find the high enhancements in F and the low ratios of RCBs. Fig. 11 shows the good agreement between our models and the observed range of these species. Three of the cases have / ratios between 6 and 15 that are within the measured range in RCBs, while this value is higher by a factor of 2 in case 4. The model F abundances are also spread over nearly the whole range of observed values with the maximum model value of compared to the observed maximum of .
The net effect of the nucleosynthesis processes in the models is that the at the surface decreases while the increases (Section 3.2.2, Fig. 6 and 7), leading to an overall increase in the surface ratio. The ratios range from (case 4) to (case 3), much higher than the observed lower limit of 100.
The C, N, O and F model surface abundances rely exclusively on the nucleosynthesis and mixing during the post-merger evolution phase. Independent of the choice of the progenitor, the surface C, N and O values of the four cases are within the same order (Fig. 10). The surface F abundances are close to each other between cases 1, 2 and 4 (within a factor of 1.5, Fig. 11). The highest F abundance is obtained in case 2 since some of it was generated in the SOF by He burning, while the lowest is in case 2 due to a much smaller depth of mixing, which led to a smaller mass available to produce it. Case 4 has the highest amount of O since its initial SOF was burnt at K, thereby increasing the initial . This is reflected in the high / ratio 41 of this case as well (Fig. 11). In summary, the model C, N, O and F abundances lie as well in the observed range.
Secondary elements
Na - Ti:
Both Na and Mg are enhanced compared to initial surface values in all four cases. Na is formed by proton captures on isotopes of Ne during the post-merger evolution. Thus, as the H-shell moves outwards in our simulations (Fig. 6(i)a), the abundance of Na increases throughout the envelope. Na is also initially enriched in case 3 due to its production in the A-TP AGB progenitor used to construct the CO WD of this case.
For the rest of the species from Al to Ti, the abundances are independent of the choice of the progenitor AGB model. In cases 1 – 3, these elements are changed in the low- SOF, depending on its duration of burning, whereas in case 4 their abundances are changed during the post-merger evolution phase (as mentioned in Section 3.1).
Al is first generated by proton-capture on Mg isotopes and later, being a neutron poison, is destroyed by (n,p) reactions once again to Mg via, . The Mg content also increases by proton-capture on . Thus, although Mg is increased in all 4 cases, the level of reduction of Al depends on the interplay between the temperature and burning timescale in the SOF, which explains why the Al abundance can be either higher (cases 1 and 2) or lower than its initial value in the envelope (cases 3 and 4).
The abundance of Ca decreases in all cases, due to n-capture reactions on its isotopes. is a significant n-capture channel and the thus formed is used up by further (n,p) and (n,) reactions, thus decreasing Ca. The reaction chain followed by further reduces Ca and in the process increases the amount of Ti.
From Fig. 12, the range of Na values from our models is consistent with the data trend, while those of Al are in marginal agreement with the enrichment levels seen in RCBs. Since there are only 6 stars which have Mg measured and as they are well scattered, it is difficult to draw out a trend in this element; we only barely get the upper limits and do not get the decrements, as seen in two of those stars. Upper limits are also closely achieved in Ti and Ca, while our lower limits do not reach down to those found in some RCBs.
Ca is seen to be enriched in a few RCB stars with the lowest [Fe], which none of our models show. Likewise, Si and S hardly change in all four cases, as temperatures are not hot enough to produce them in the initial SOF or in the star itself. Thus our models do not show the overabundances of Si and S observed in RCB stars with the lowest [Fe] (see discussion in Section 4).
s-process elements:
The abundances of s-process nuclei depend on the seed Fe nuclei available in the star. Although the neutron source is primary, the main neutron poison is also primary, and therefore the s process is secondary. Thus, one would expect [X] of s-process elements to rise more or less in sync with [Fe].
Among our simulations the low- case with a high- SOF (case 4) shows enhanced abundances of s-process elements from the neutron flux available during the post-merger evolution phase (Section 3.1), while the high- case with low- and long SOF (case 2) produce the s-process elements in the SOF before the post-merger evolution (Section 3.2.3). Cases 1 and 3 produce only small amounts of s-process elements.
With few exceptions almost all RCB stars show some enhancement in s-process elements on their surface, compared to the solar-scaled abundance level. The observed range of enhancements agrees with the range of our four cases, except for a few stars that seem to be depleted in s-process elements.
4 Discussions and Conclusions
Our post-merger models are based on realistic progenitor evolutions with complete nucleosynthesis predictions and the dynamic merger history presented in paper I. These models adopt an envelope mixing model that is motivated by the rotation of the merged object. With these assumptions the models reproduce almost all the observed characteristics of RCB stars, in particular the anomalous isotopic signatures of O, as well as C and the F enhancements.
Model predictions are also in good agreement with the observed abundances of s-process elements. These do not originate in the progenitor AGB star. Depending on the mass ratio of the merging WDs the s process originates either in the SOF, which is a characteristic of the dynamic phase (case 2) or in the post-merger phase (case 4). In the former case s-process enhancements are only seen if the SOF is assumed to persist for more than (long SOF).
The enhancements of C, N, O and F are due to nucleosynthesis in the post-merger evolution of the star. The initial abundances constructed from the progenitor AGB and RGB models are important with respect to the amount of H available, and the profile of C and O into which dynamic and post-merger dredge-up mixing may reach. The amount of H is chosen according to predictions of stellar evolution calculations of the giant to white dwarf transition (paper I), and it provides the protons for the neutron source isotope . Being of the order of 0.001 is required to obtain the observed CNO elemental values of RCBs. Lower than this order of H, would cause the abundance to drop, and while higher than this causes to rise above O at the surface, leading to . The majority of RCBs have at the surface.
The CNO ratios will also depend on the abundance ratios in the outer layer of the progenitor AGB stars core, and despite adopting a range of progenitor AGB models, we find that the C, N, and O abundances are similar for all cases.
Our models also lie within the observed range of luminosity and effective temperature of RCB stars. The differences between the surface abundances when the models enter and leave the RCB phase are for C, N, O, and F, and for the other nuclear species (this is less than the observational errors). Thus, our models can also account for the four hot RCB stars between and . The models show a range of and F in agreement with observations and their ratios are higher than the observed lower limit for RCB stars.
The model parameters are constrained by the diverse range of observational properties. In addition to the depth of mixing during He-shell burning phase of the post-merger evolution (), the mixing limit depends on the AGB progenitor. For an advanced AGB progenitor model the depth of mixing must be limited to avoid an excessive dredge-up to the surface since the outer layers of the evolving AGB CO-core get increasingly O-rich. Other parameters of the mixing model (Section 2.3) calibrated to reproduce the observed surface abundances are the width of the partially mixed region below the proper mixing regime in the envelope and the efficiency of mixing. The former needs to be large enough to produce enough F but small enough to avoid destruction of . The latter must be large enough to mix enough to the surface but small enough to avoid contamination with . Surface abundances are also determined by the SOF properties, which are mostly a result of the mass ratio of the merging WDs. The duration of conditions for nucleosynthesis in the SOF is uncertain and has been approximated by assuming two cases, a long and short SOF. Finally, our models suggest that the adopted additional envelope mixing should subside just before the RCB star phase is reached. Without such a decrease of mixing efficiency with time, continuous mixing throughout the evolution of the star causes the star to become O-rich as against being C-rich.
Although in the end the choice of parameters (progenitor model, SOF assumptions, mixing model) appears to have a lot of parameters, it turns out that all of these seem to be identifiable with unique nucleosynthetic and mixing signatures. Due to large number of nucleosynthesis processes, each with their individual dependence on temperature and on other, related nucleosynthesis processes (as for example the neutron production and consumption for the F production), most of these parameters are therefore well constrained in our models.
A legitimate question would be how degenerate our solutions are. In view of the many cases that we have investigated, many of them not described in detail in this paper, we are not aware of any alternative way to arrive at such a level of agreement between observations and models. However, one has to admit that significant uncertainties, especially regarding the properties and evolution of the SOF as well as non-spherically symmetric aspects of the post-merger mixing model remain.
Observations of RCB stars show some diversity and our four cases reproduce a spread in abundance features. Most of this spread in model predictions is in fact due to differences in the cases, such as the mass ratio of the WDs, or the progenitor model, which represent a real source of diversity corresponding to the range of WD mergers that are expected to end up as RCB or HdC stars.
When comparing observations and model prediction it must be kept in mind that dust depletion may play a role (Asplund, 1998; Asplund et al., 2000), since after all the irregular variability of RCB stars is associated with dust enshrouding. This possibility cannot be ruled out, in particular to explain the distinctly low [Fe] values of the minority RCBs from the majority. It does not appear that the dust-gas separation in RCB stars. An ISM-like dust depletion can explain the high [S/Fe] and [Na/Fe] observed in RCBs, but not their [Al/Fe] and [Ca/Fe] values, both of which are much lower in the ISM. In particular, the Si in a carbon-rich dust environment is expected to condense into SiC grains, thus severely reducing the Si content. However all RCBs have high [Si/Fe] ratios. It should be noted however, that only amorphous graphite grains and no SiC grains have been detected in RCBs. This maybe indicative of a different dust-gas separation mechanism from that of the ISM.
An alternative interpretation of the large Si and S overabundances seen in the RCB stars with the lowest [Fe] considers the mass of the merging WDs. Si and S are produced in O burning at K, which could be achieved in the SOF of a merger of more massive WDs (Lorén-Aguilar et al., 2009, for combined mass ). The theoretical initial-final mass relationship predicts, for a given initial mass, higher WD masses for lower metallicity (Meng et al., 2008). Assuming the initial mass function does not depend on metallicity in the range relevant for RCB star progenitors, higher WD masses are expected for lower metallicity mergers, and this may be the reason for the larger enhancements in S and Si for the RCB stars with the lowest Fe content. Such higher-mass RCB stars would naturally also be more luminous, and this hypothesis therefore predicts that RCB star luminosity is correlated with Si and S enhancements.
On a preliminary note, we do see enhancements of on the surface of our models that seem to agree with the levels of found in EHes. A detailed comparison of our models with the observations of EHe is, however, beyond the scope of this work.
Finally, a few exceptions to the usual RCB star properties include those with higher than average H, including four RCB stars in which Li is enhanced (Asplund et al., 2000; Kipper et al., 2006), as well as four other RCBs that have a relatively higher amount of 13C at their surface (Rao & Lambert, 2008; Asplund et al., 2000), with 12C/13C. Neither of these properties are found in our models. Recent SPH simulation results of Longland et al. (2012) indicate that, to be preserved, any Li that maybe produced in a DD merger will have to be ejected into the mass that forms clouds around the RCB star. Since mass-ejection during the dynamic merger phase is not part of the hydrodynamic simulations of paper I, our models cannot predict lithium abundances from such a scenario. Thus, the question of whether Li-rich RCBs are an outcome of the FF scenario or of the merger between WDs remains open and needs a separate, more in-depth analysis.
References
- Asplund (1997) Asplund, M., Gustafsson, B., Lambert, D. L., & Rao K. N. 1997A&A…321L..17A
- Asplund (1998) Asplund, M., 1998,A&A.,332,651A
- Asplund (1999) Asplund, M., 1999, IAUS, 191, 481A
- Asplund et al. (2000) Asplund, M., Gustafsson, B., Lambert, D. L., & Rao N. K. 2000, A&A, 353, 287
- Benz et al. (1990) Benz, W., Cameron, A. G. W., Press, W. H., & Bowers, R.L. 1990, ApJ, 348,647
- Brown et al. (2011) Brown, W. R., Kilic, M, Hermes, J. J., Prieto, C. A., Kenyon, S. J, & Winget, D. E., 2011, ApJL, 737, 23
- Chandrasekhar (1939) Chandrasekhar, S. 1939, An introduction to the Study of Stellar Structure (Chicago, IL: Univ. Chicago Press)
- Clausen et al. (2012) Clausen, D., Wade, R. A., Kopparapu, R. K., & O’Shaughnessy, R. 2012, ApJ, 746, 186
- Clayton (1996) Clayton, G. C. 1996, PASP, 108, 225
- Clayton et al. (2005) Clayton, G. C., Herwig, F., Geballe, T. R., Asplund, M., Tenenbaum, E. D., Engelbracht, C. W., & Gordon, K. D. 2005, ApJL, 623, 141
- Clayton et al. (2007) Clayton, G. C., Geballe, T. R., Herwig, F., Fryer, C. L., Asplund, M. 2007, ApJ, 662, 1220
- Clayton (2012) Clayton, G. C. 2012, JAAVSO, submitted
- Cottrell & Lawson (1998) Cottrell, P.C, Lawson W.A, 1998, PASP, 15, 179
- Dan et al. (2012) Dan, M., Rosswog, S., Guillochon, J., & Ramirez-Ruiz, E. 2012, arXiv:1201.2406
- D’Souza et al. (2006) D’Souza, M. C. R., Motl, P. M., Tohline, J. E., & Frank, J. 2006, ApJ, 643, 381
- De Marco et al. (2009) De Marco, O., 2009, PASP, 121, 316
- De Marco et al. (2011) De Marco, O., Passy, J., Moe, M., Herwig, F., Mac Low, M. & Paxton, B. 2011, MNRAS, 411, 2277D
- Denissenkov & Pinsonneault (2008) Denissenkov, Pavel A. & Pinsonneault, M. 2008, ApJ, 684, 626D
- Driebe et al. (1998) Driebe T., Schönberner D., Blocker T., & Herwig F. 1998, A&A, 339, 123
- Eggleton (1983) Eggleton, P. 1983, ApJ, 268, 368
- Even & Tohline (2009) Even, W. & Tohline, J. E. 2009, ApJS, 184, 248
- Eyres et al. (1998) Eyres, S. P. S., Evans, A., Geballe, T. R., Salama, A.,& Smalley, B. 1998, MNRAS, 298,L37
- Garcia-Hernandez et al. (2009) García-Hernández, D. A., Hinkle, K. H., Lambert, D. L., & Eriksson, K. 2009, ApJ, 696, 1733
- Garcia-Hernandez et al. (2010) García-Hernández, D. A., Lambert, D. L., Kameswara Rao, N., et al. 2010, ApJ, 714, 144
- Geballe et al. (2002) Geballe, T. R., Evans, A., Smalley, B., Tyne, V. H., Eyres, S. P. S. 2002, Ap&SS, 279, 39G
- Han (1998) Han, Z. 1998, MNRAS, 296, 1019
- Han et al. (2002) Han, Z., Podsiadlowski, P., Maxted, P. F. L., Marsh, T. R., & Ivanova, N. 2002, MNRAS, 336, 449
- Han et al. (2003) Han, Z., Podsiadlowski, P., Maxted, P. F. L., Marsh, T. R., & Ivanova, N. 2003, MNRAS, 341, 669
- Hachisu et al. (1986a) Hachisu, I, Eriguchi, Y, Nomoto, K. 1986a, ApJ, 308, 161
- Hachisu et al. (1986b) Hachisu, I, Eriguchi, Y, Nomoto, K. 1986b, ApJ, 311, 214
- Hema et al. (2012) Hema, B.P., Pandey, Gajendra; Lambert, David L. 2012, ApJ, 747, 102
- Herwig (2001) Herwig, F. 2001, ApJ, 554, L71
- Herwig & Langer (2001) Herwig, F. & Langer, N. Nuclear Physics A, 688, 221.
- Herwig (2005) Herwig, F., 2005, ARA&A, 43, 435
- Herwig et al. (2008) Herwig, F., et al. 2008, nuco.conf, 23
- Herwig et al. (2011) Herwig, F., Pignatari, M., Woodward, D., et al. 2011, ApJ, 727,89
- Hurley et al. (2002) Hurley, J. R., Tout, C.A., & Pols O.R. 2002, MNRAS, 329,897
- Iben & Tutukov (1984) Iben, I. & Tutukov, A. V. 1984, ApJS, 54, 335
- Iben & Tutukov (1987) Iben, I. & Tutukov, A. V. 1987, fbs conf., 401I
- Iben et al. (1996) Iben, I.; Tutukov, A. V.; Yungelson, L. R. ASPC, 96, 409
- Jeffery et al. (2011) Jeffery, C. S., Karakas, A. I., & Saio, H. 2011, MNRAS, 414, 3599
- Justham et al. (2011) Justham, S., Podsiadlowski, P., & Han, Z. 2011, MNRAS, 410, 984
- Kipper et al. (2006) Kipper, T. & Klochkova, V. G. 2006, Balt. Ast., 15, 531
- Lambert & Rao (1994) Lambert D. L. & Rao N. K., 1994, Journal of Astrophysics and Astronomy, 15, 47
- Longland et al. (2012) Longland, R., Lorén-Aguilar, P., José, J., García-Berro, & E., Althaus, L. G. 2012, A&A, 542, 117
- Longland et al. (2011) Longland, R., Lorén-Aguilar, P., José, J., García-Berro, E., Althaus, L. G., & Isern, J. 2011, arXiv:1107.2233 (ApJ in press)
- Lorén-Aguilar et al. (2009) Lorén-Aguilar, P., Isern, J., & García-Berro, E. 2009, A&A, 500, 1193
- Meng et al. (2008) Meng, X., Chen, X., Han, Z. 2008, A&A, 487, 625
- Motl et al. (2002) Motl, P., Tohline, J. E., Frank, J. 2002, ApJS, 138, 121
- Motl et al. (2007) Motl, P. M., Frank, J., Tohline, J. E., & D’Souza, M. C. R. 2007, ApJ, 670, 1314
- Motl et al. (2012) Motl, P. M., Diehl, Even, W., S., Clayton, G., Fryer, C. L., & Tohline, J. E. 2012, ApJ submitted
- Napiwotzki et al. (2001) Napiwotzki, R., Christlieb, N., Drechsel, H. et al. 2001, AN, 322, 411N
- Nelemans et al. (2001a) Nelemans, G. and Yungelson, L. R., Portegies Zwart, S. F., Verbunt, F. A&A, 2001, 365, 491N
- O’Keefe (1939) O’Keefe, J. A. 1939, ApJ, 90, 294
- Paczyński (1967) Paczyński, B. 1967, AcA, 17, 287
- Pandey et al. (2006) Pandey G., Lambert D. L., Jeffery S. C., 2006, ApJ, 638, 454
- Pandey et al. (2008) Pandey G., Lambert D. L. & Rao N. K. 2008, ApJ, 674,1068
- Passy et al. (2012) Passy J., DeMarco O., Fryer C. et al. 2012, ApJ, 744, 52P
- Paxton et al. (2011) Paxton, B., Bildsten, L., Dotter, A., Herwig, F., Lesaffre, P., & Timmes, F. 2011, ApJS, 192, 3
- Rao & Lambert (2008) Rao, N. K. & Lambert, D. L. 2008, MNRAS, 384, 477
- Rao et al. (2012) Rao, N. K., Lambert, D. L. , García-Hernández, et al. 2012, ApJ, 760L, 3K
- Rappaport et al. (2009) Rappaport, S, Podsiadlowski, Ph., & Horev, I. 2009, ApJ, 698, 666
- Raskin et al. (2012) Raskin, C., Scannapieco, E., Fryer, Ch., Rockefeller, G., & Timmes, F. X. 2012, ApJ, 746, 62
- Renzini (1990) Renzini, A., 1990, ASPC, 11, 549
- Saio & Jeffery (2000) Saio, H. & Jeffery, S. 2000, MNRAS, 313, 671S
- Saio & Jeffery (2002) Saio, H. & Jeffery, S. 2002, MNRAS, 000, 1
- Saio (2008) Saio, H. 2008, ASPC, 391, 69
- Schönberner (1983) Schönberner, D. 1983, ApJ, 278, 708
- Schwab et al. (2012) Schwab, J., Shen K. J., Quataert E. , Dan M. & Rosswo S. MNRAS, 000, 000
- Shen et al. (2012) Shen K. J., Bildsten L., Kasen D. & Quataert E. 2012, ApJ, 748, 35
- Scott et al. (2006) Scott, P. C., Asplund, M., Grevesse, N., & Sauval, A. J. 2006, A&A, 456, 675
- Segretain et al. (1997) Segretain, L., Chabrier, G., & Mochkovitch, R. 1997, ApJ, 481, 355
- Solheim (2010) Solheim, J. E. 2010, PASP, 122, 1133
- Staff et al. (2012) Staff, J., Menon, A., Herwig, F., Even, W., et al. 2012, ApJ, 757, 76S
- Tisserand et al. (2008) Tisserand P., Marquette J.B, Wood P.R, Lesquoy É et al. 2008, A&A 481, 673
- van Kerkwijk et al. (2010) van Kerkwijk M. H., Chang P., Justham S. 2010, ApJ, 722, L157
- Webbink (1984) Webbink, R. F. 1984, ApJ, 277, 355
- Weiss (1987) Weiss, A. 1987, A&A, 185,165
- Werner & Herwig (2006) Werner, K., & Herwig, F. 2006, PASP, 118, 183
- Wilson & Rood (1994) Wilson, T. L. & Rood, R. 1994, ARA&A, 32, 191
- Yoon et al. (2007) Yoon, S.-C., Podsiadlowski, Ph., & Rosswog, S. 2007, MNRAS, 380, 933
Appendix A Simulation data
In addition to the simulation results presented and described in this paper we make all raw simulation output data from both the MESA stellar evolution runs as well as the NuGrid mppnp post-processing nucleosynthesis calculations available for further analysis or comparison with observations or other simulations. The data is available via the NuGrid data server http://data.nugridstars.org hosted at the Canadian Astronomy Data Centre (CADC). Access information is available at http://www.nugridstars.org.