The Extended Optical Disk of M101
Abstract
We have used deep, wide-field optical imaging to study the faint outskirts of the luminous spiral galaxy M101 (NGC 5457), as well as its surrounding environment. Over six square degrees, our imaging has a limiting surface brightness of 29.5 mag arcsec-2, and has revealed the stellar structure of M101’s disk out to nearly 25′ (50 kpc), three times our measured R25 isophotal size of the optical disk. At these radii, the well-known asymmetry of the inner disk slews 180 degrees, resulting in an asymmetric plume of light at large radius which follows the very extended HI disk to the northeast of M101. This plume has very blue colors (BV0.2), suggesting it is the somewhat more evolved (few hundred Myr to 1 Gyr) counterpart of the young far ultraviolet emitting population traced by GALEX imaging. We also detect another, redder spur of extended light to the east of the disk, and both structures are reminiscent of features produced during fly-by galaxy interactions. However, we see no evidence of very extended tidal tails around M101 or any of its companions which might be expected from a recent encounter with a massive companion. We consider the properties of M101’s outer disk in light of possible past interactions with the nearby companion galaxies NGC 5477 and NGC 5474. The detection of optical starlight at such large radii gives us the ability to study star formation histories and stellar populations in outer disks over a longer timescales than those traced by the UV or H emitting populations. Our data suggest ongoing buildup of the M101’s outer disk due to encounters in the group environment triggering extended star formation and tidal heating of existing disk populations.
Subject headings:
Galaxies: individual (M101), Galaxies: interactions, Galaxies: spiral, Galaxies: star formation, Galaxies: stellar content, Galaxies: structure1. Introduction
The diffuse, low surface brightness outskirts of galaxies hold a remarkable range of information about processes driving galaxy evolution. As galaxies are thought to grow “inside-out,” where the central regions form first, and the outskirts later, the most recent signatures of galaxy assembly should lie in their faint outer reaches. Interactions and accretion leave behind long-lived tidal tails and stellar streams (e.g., Arp 1966; Toomre & Toomre 1972; Bullock & Johnston 2005; Martínez-Delgado et al. 2010). Star formation in the outer disks of galaxies probes the mechanisms for star formation at low gas density (Kennicutt et al. 1989; Martin & Kennicutt 2001; Bigiel et al. 2008). Dynamical models show that substantial radial migration of stars can occur, whereby stars formed in the inner disk can move outwards and populate the disk outskirts (Sellwood & Binney 2002; Debattista et al. 2006; Roskar et al. 2008ab). All of these different processes leave signatures in the structure, stellar populations, and kinematics of the outer disk which can be used to develop a more complete picture of disk galaxy evolution.
The nearby spiral galaxy M101 (NGC 5457) presents an opportunity to study the outer disk of a giant Sc galaxy in detail. M101 is the dominant member of a small group of galaxies (Geller & Huchra 1983; Tully 1988), and as its well-known asymmetry attests to recent or on-going interactions with its companions (Beale & Davies 1969; Rownd et al. 1994; Waller et al. 1997). As the small group environment is the most common for galaxies, the processes shaping M101 have likely shaped the bulk of the galaxy population as well. Furthermore, M101 is well-studied at many wavelengths, giving us a comprehensive view of the structure and kinematics of its baryonic components. It is also close enough that deep space-based imaging has the potential to image its stellar populations directly, raising the possibility of obtaining direct information about the distribution of stellar age and metallicity in its disk (see, e.g., similar studies for other nearby galaxies by de Mello et al. 2008; Dalcanton et al. 2009, 2012; Radburn-Smith et al. 2011, 2012).
A variety of studies have shown that M101’s disk extends well beyond its canonical R25 optical radius. Deep 21-cm mapping has revealed an extended, asymmetric gaseous disk (van der Hulst & Sancisi 1988; Walter et al. 2008), with a plume of extended HI at very low column density traced out to nearly 100 kpc in extent (Huchtmeier & Witzel 1979; Mihos et al. 2012). GALEX imaging has shown that far-ultraviolet (FUV) emission extends to very large radius (Thilker et al. 2007), indicating that star formation is taking place in the outer disk, well beyond the radius at which star formation is thought to be suppressed due to low gas densities (e.g., Kennicutt 1989). Whether this star formation has only been recently triggered, perhaps by an interaction, or reflects an ongoing process of disk building requires a more detailed understanding of the underlying stellar populations in the outer disk.
While this extended star formation adds young stellar populations to the outer disk, interactions with companion galaxies will distort and tidally heat the inner disk, growing the outskirts of the disk by moving inner disk stars outwards. Tidal stripping of the interacting companions can directly deposit stars in the outer disk as well. Over longer timescales, M101’s strong asymmetry and marked spiral structure make it a conducive environment for radial migration processes, which also drive old stars outwards. All these processes can lead to changes in the surface brightness and color profiles of the disk, and may be responsible for the diverse surface brightness profiles seen in disk galaxies (van der Kruit 1979; Pohlen et al. 2002, 2007). While late-type spirals such as M101 are typically associated with down-bending or truncated surface brightness profiles (Pohlen & Trujillo 2006), these processes may build the outer disk and transform their profiles into the up-bending or anti-truncated profiles characteristic of early type disks. If dynamical processes in the group environment also lead to changes in the Hubble type of the galaxy (Tran et al. 2001; McGee et al. 2008; Kovač et al. 2010), this could present a self-consistent explanation for the correlation between disk profile and Hubble type seen in studies of disk galaxies (Pohlen & Trujillo 2006; Erwin et al. 2008). In M101, we have an opportunity to examine a galaxy in the throes of environmentally-driven evolution, and to study disk building and the response of the luminosity profile and stellar populations in its outer disk.
Interaction signatures abound in both M101’s morphology and kinematics. The strong asymmetry of the galaxy suggests a recent interaction with at least a moderately massive galaxy (Beale & Davies 1969; Waller et al. 1997), while high velocity gas complexes in the HI distribution are thought to be either signatures of gaseous accretion onto the disk (van der Hulst & Sancisi 1988) or induced by a recent interaction (Combes 1991). A number of nearby companions exist as possible interaction partners, including NGC 5477 and NGC 5474, but a “smoking gun” signature of their interaction with M101 remains missing. Both the HI plume to the southwest of M101 and the diffuse HI found between M101 and NGC 5474 (Huchtmeier & Witzel 1979; Mihos et al. 2012) are suggestive of tidal debris, although the low spatial resolution of the 21-cm data ( 9′) make that determination difficult. Deep optical imaging of other nearby disk galaxies has revealed many examples of extended low surface brightness tidal streams which trace an interaction (Martínez-Delgado et al. 2010), motivating a deeper search for optical tidal features around M101 and its companions.
However, while the information content in the outskirts of disk galaxies is large, accessing it proves difficult, particularly for nearby galaxies such as M101111While the exact distance to M101 remains uncertain (see Matheson et al. 2012 and references therein), in our analysis we adopt a distance of 6.9 Mpc; at this distance, 1′= 2.0 kpc.. The surface brightness of the outer disk is 10-100 times fainter than the night sky background, and at the distance of M101 the disk and any associated tidal features could potentially subtend a half a degree or more in size. Furthermore, the long dynamical timescales in the outer disk ( 0.5 Gyr) mean that photometric structures are likely not well-mixed azimuthally, so that the standard practice of azimuthally averaging the light to build signal to noise has the potential to “average away” unmixed substructure and yield misleading results. To study these regions in detail demands deep, wide-field imaging sensitive enough to produce two dimensional maps of luminosity and color without the need to azimuthally average.
Here we report deep (), wide-field (6 square degree) imaging of M101 and its surrounding environment. We use this dataset to search for interaction signatures around M101 and its companions and to study the structure and color of M101’s disk at large radius. Coupled with extant multiwavelength datasets, our deep optical imaging places constraints on the star formation history and mix of stellar populations in the outer disk, and probes mechanisms for galaxy disk building in the group environment.
2. Observations
We observed M101 with Case Western Reserve University’s Burrell Schmidt telescope in April 2009 and April 2010. Full details of our observational technique can be found in Mihos et al. (2005), Rudick et al. (2010), and Mihos et al. in preparation; we emphasize the most important points here, as well as any updated techniques adopted. The Burrell Schmidt images a 1.5°x1.5° field of view onto a 4Kx4K SITe CCD, yielding a pixel scale of 1.45″ pixel-1. The April 2010 data were taken in Washington M, similar to Johnson V, but 300Å bluer, which cuts out the O I 5577 night sky emission line and reduces variability in the sky levels (see Feldmeier et al. 2002). To give an adequate spectral baseline to measure meaningful colors, the April 2009 data were taken through a custom-designed filter similar to Johnson B, but with a central wavelength 200Å bluer. In both cases the data were taken during moonless photometric nights where the frame-to-frame variation in the photometric zeropoints agreed to within a 1 scatter of 0.01 magnitude after a constant extinction correction with airmass was applied. A total of 61 and 60 images of M101 were taken in B and M, respectively, with the pointings dithered by up to 0.5° to minimize uncertainties due to large scale flat fielding effects. We also observed offset blank sky pointings (40 in B and 55 in M), bracketing the M101 exposures in time and hour angle, to construct dark sky flats for the dataset. In B, both the M101 and sky pointings were 1200s exposures, yielding 500–700 counts pixel-1 in the sky. In M, the exposures were 900s, resulting in sky levels of 1200–1400 counts pixel-1.
| M101 | N5477 | N5474 | |
|---|---|---|---|
| RA | 14:03:12.5 | 14:05:33.3 | 14:05:01.6 |
| Dec | +54:20:56 | +54:27:40 | +53:39:44 |
| Type | SAB(rs)cd | SA(s)m | SA(s)cd pec |
| [km s-1] | 241 | 304 | 273 |
| Distance [Mpc] | 6.9 | … | … |
| Rproj [arcmin] | … | 22 | 44 |
| Rproj [kpc] | … | 44 | 88 |
| -15.0 | -17.9 | ||
| [ L☉ ] | 3.9 | 0.015 | 0.22 |
| 0.44 | 0.35 | 0.48 | |
| R25 (RC3) [arcmin] | 14.4 | 0.8 | 2.4 |
| R25 (this study) [arcmin] | 8.0 | 0.85 | 2.1 |
| [km s-1] | 250 | … | 40 |
| [ M☉ ] | 24.1 | 0.18 | 1.50 |
Note. — Hubble type, photometric properties, and sizes of the galaxies taken from the RC3 (de Vaucouleurs et al. 1991). Rotation speeds taken from Zaritsky et al. 1990 (M101) and Rownd et al. 1994 (N5474). HI masses taken from Huchtmeier & Richter (1988). The physical distance to M101 is adopted from Matheson et al. 2012 and references therein. Rproj is the projected distance from M101.
The offset sky pointings were used to construct flat fields for each season’s dataset, using the techniques described in Rudick et al. (2010). In short, each sky pointing is masked of stars and objects using IRAF’s222IRAF is distributed by the National Optical Astronomy Observatory, which is operated by the Association of Universities for Research in Astronomy (AURA) under cooperative agreement with the National Science Foundation. objmask task, then binned into 32 pixel blocks so that any extended low surface brightness contaminants (reflections, extended wings of bright stars, etc) could be identified and masked manually. After masking, the sky pointings are median combined to produce a preliminary flat; this flat is then used to flatten the individual skies. Once flattened, we fit and remove a sky plane from each sky, and then reconstruct an updated flat field. We repeat this process five times, at which point the flat field converges; the final flat field is then used to flatten the individual M101 images.
After flat fielding, we subtract the wings of bright stars using a PSF model which included positionally dependent term to account for internal reflections (see Slater et al. 2009 for details). For sky subtraction, we note that even as large as M101 itself is, our very large field of view gives plenty of sky area around the outskirts to measure the sky level. We measure this sky level by first masking M101 and the surrounding bright galaxies, and using IRAF’s objmask task to mask fainter stars and background galaxies in the field. We then rebin the images by calculating the median in 32x32 pixel bins (excluding masked pixels from the median), and fit a sky plane to each rebinned image, which is subsequently subtracted from the original image. Finally, all images are registered, scaled to a common photometric zeropoint, and medianed together to form the final image. The photometric zeropoint for each frame is determined from SDSS photometry of stars, using the photometric conversion of Lupton (2005) to convert from ugriz to Johnson B and V. Comparing our photometry to transformed B,V photometry for SDSS stars in the field, we recover magnitudes to with magnitudes and B-V colors to magnitudes for SDSS stars in the magnitude range V=14.5–17 and color range BV=0.0–1.5.
After the master image is constructed, we also create a binned version of the image to maximize signal to noise at low surface brightness. To make this image, we first use IRAF’s objmasks task to mask bright objects in the field – stars, bright galaxies, and background sources. We then rebin the image into 9x9 pixel (13″x13″or 450x450 pc) blocks, calculating the median intensity of unmasked pixels in each block. If more than 50% of the pixels in a given block are masked, we leave the entire block masked so that a small number of unmasked pixels won’t weigh disproportionately large in the final map.
In the analysis that follows, we calculate surface brightnesses using “asinh magnitudes” (Lupton et al. 1999):
where , and for each image, is counts in ADU, is the photometric zeropoint, is the noise in the image, and is the filter color term. At high flux levels, asinh magnitudes are equivalent to regular magnitudes, while at the faint end, near the noise level in the images, asinh magnitudes are better behaved as the flux levels drop through zero. The photometric zeropoints () and color terms () are derived from the final mosaic using SDSS stars in the field and the Lupton (2005) conversion from ugriz to B and V. Since at faint light levels we will be measuring surface brightness from the 9x9 binned image, the image noise parameter is determined by the noise in this rebinned image. We measure these values by first creating histograms of the bin intensities in sky regions away from bright galaxies, and then fit Gaussians to the negative intensity side of the histograms. We derive values of 0.7 and 0.8 ADU for and , respectively. Given these measures, our 1 limiting surface brightnesses are . During the analysis which follows, we correct the photometry for galactic extinction using values of (Schlafly & Finkbeiner 2011).
3. Results
3.1. Morphology and multiwavelength comparison
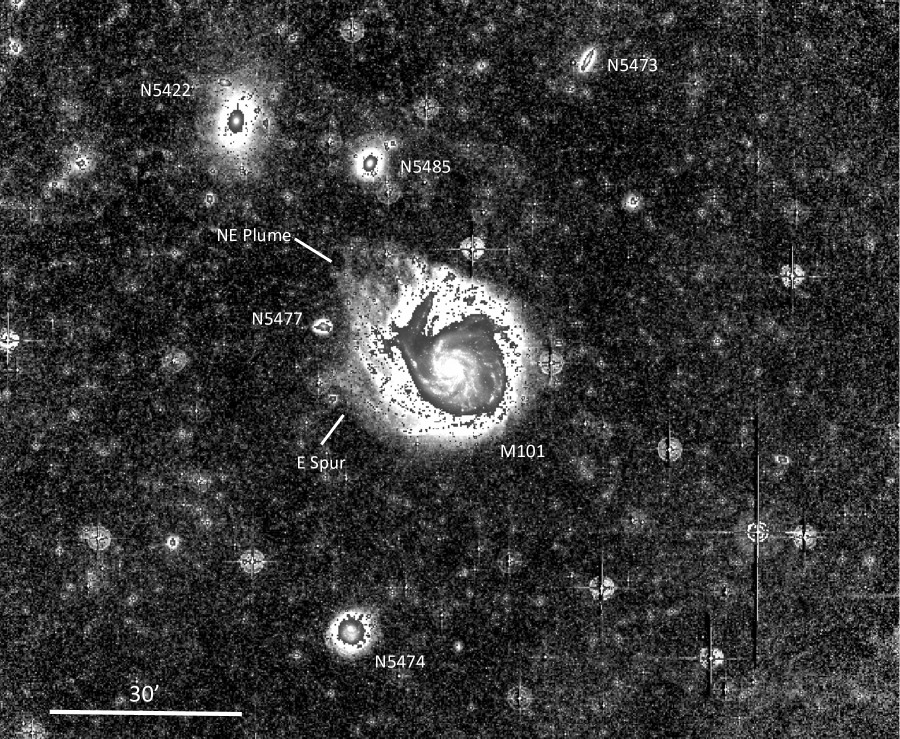
Figure 1 shows our final B mosaic, spanning 2.5° (300 kpc) on a side. In the image shown in Figure 1, we have replaced the masked inner regions of galaxies with the original pixels, rescaled in intensity to show their high surface brightness ( 25.5 mag arcsec-2) structure. The three galaxies north of M101 — NGC 5422 (1820 km s-1), NGC 5485 (2000 km s-1) and NGC 5473 (2026 km s-1) — are background objects, while NGC 5477 (304 km s-1) 22′ (44 kpc) to the west and NGC 5474 (273 km s-1) 44′ (88 kpc) to the south are likely physically associated with M101 (241 km s-1). Table 1 summarizes the basic properties of M101 and its companions NGC 5474 and NGC 5477.
The well-known inner asymmetry of M101’s disk at high surface brightness is easily seen as an extension to the southwest in the rescaled high surface brightness parts of the image. Interestingly, the radius of the =26.5 isophote (approximately where the colorbar saturates to white in Figure 1) is actually quite circular, with a radius of 12.5′, but centered 1.6′ north of M101’s nucleus. At larger radius and even lower surface brightness, the asymmetry slews 180° from the inner asymmetry, as M101’s disk displays an asymmetric plume of light to the northeast. In this plume, which we refer to hereafter as the NE Plume, we can trace optical starlight out to 24′ (48 kpc) from the center of M101. We also find a spur of optical light extending 19′ (38 kpc) to the east of M101, referred to in this paper as the E Spur. The dwarf companion NGC 5477 sits between these two features, in a gap reminiscent of those seen in simulations of disk galaxies interacting with dwarf companions (e.g., Hernquist & Mihos 1995; Walker et al. 1996).
Aside from these features, down to our limiting surface brightness of =29.5, we see no evidence of any long, extended tidal tails around M101 which might signal a strong prograde interaction in its recent history. To the south, NGC 5474 is often thought to be the interacting companion driving M101’s asymmetry, due to its own asymmetric nature (e.g., Kornreich et al. 1998) and the presence of diffuse HI between the galaxies (Huchtmeier & Witzel 1979; Mihos et al. 2012). However, NGC 5474’s outer isophotes are remarkably round, with no distortion at large radius indicating any strong tidal interaction. This lack of irregular isophotes at large radius is particularly noteworthy given the significant offset (1.25 kpc, or 0.3R25) of NGC 5474’s bulge from disk of the galaxy (van der Hulst & Huchtmeier 1979; Kornreich et al. 1998). Because the lifetime of an offset nucleus should be short, on the order of a few dynamical times ( a few Myr), this argues that any interaction driving this morphology is ongoing or recent. In such a case, one would expect the tidal interaction signatures to be even stronger in the outskirts of the galaxy, where material is more easily perturbed during an interaction. Furthermore, the HI kinematics of the galaxy show simple rotation, with no sign that the bulge plays any dynamical role (van der Hulst & Huchtmeier 1979; Rownd et al. 1994). While the bulge could be a companion galaxy merely projected onto the disk of NGC 5474, the fact that the spiral arms appear symmetric around the bulge suggest that the disk and bulge are dynamically linked. How such a system could develop with no obvious signs of optical irregularity at large radius remains a mystery.
We present a multiwavelength montage of M101 in Figure 2. The scaling of the B-band image is meant to show the faint features in the outer disk, and saturates to black at surface brightnesses brighter than =26. The BV color map is constructed from our deep B and V images, and shows colors down to a magnitude limit of = 28.75. In the inner disk, we see a color gradient (discussed quantitatively in Section 3.2) from the red nucleus to the bluer outskirts of the disk. The NE Plume is clearly quite blue, with many pixels with BV colors 0.3, even in low surface brightness regions well away from the bright spiral arms. We emphasize that each of the binned pixels in our optical images are binned independently, so that the spatial clumping of these blue pixels shows the robustness of the detection, rather than being an artifact of any spatial smoothing. Regions in the E Spur have a redder B-V color of 0.4–0.5, likely reflecting an older stellar population in that region. We quantify the photometric properties of the E Spur and NE Plume in more detail in Section 3.3.
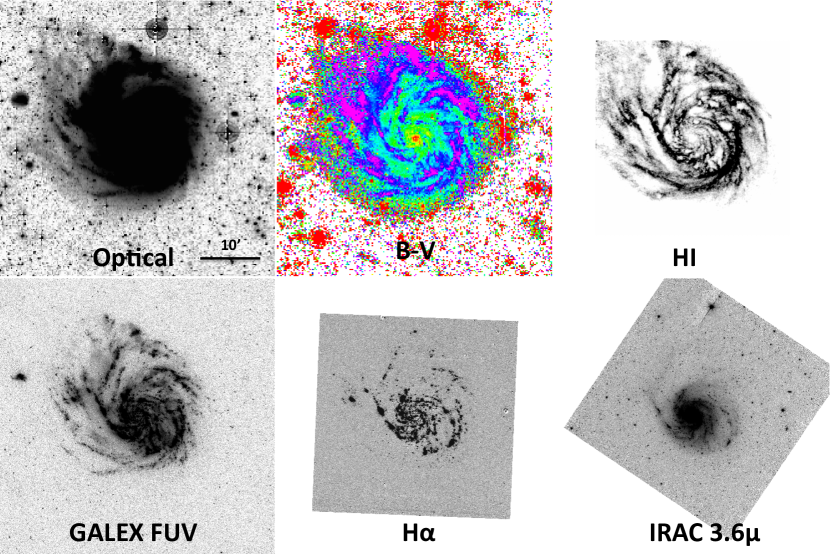
Comparing our optical imaging to the THINGS HI map (Walter et al. 2008), it is clear that we detect starlight as far out as the HI is detected — nearly 50 kpc from the center of M101. The gross morphology of M101 in neutral hydrogen and starlight is strikingly similar: the HI features trace the optical starlight in both the NE Plume and the E Spur, and the sharp decline in HI surface density seen to the SW is matched by a very sharp decline in the optical light in those regions. Co-spatial with both the NE Plume and E Spur, high velocity gas is observed in HI (van der Hulst & Sancisi 1988; Kamphuis 2008; Walter et al. 2008; Mihos et al. 2012), arguing that these features arise from some strong dynamical forcing with a component out of the plane of M101’s disk. Beyond the coverage of the THINGS map, deep single-dish imaging has also revealed in a long ( 48′ or 96 kpc) plume of HI to the SW at very low column density as well (Huchtmeier & Witzel 1979; van der Hulst & Sancisi 1988; Mihos et al. 2012). However, in the wide-field image of M101 presented in Figure 1, we see no sign of any broadband starlight associated with this extended HI plume.
The GALEX far ultraviolet map (Gil de Paz et al. 2007) shown in Figure 2 traces emission from hot stars with ages up to 100 Myr (e.g., Leitherer et al. 1999). M101 is classified as a Type I XUV disk (Thilker et al. 2007), displaying extended, structured UV emission well beyond the nominal optical radius. This extended FUV emission roughly follows the optical light down to surface brightnesses of 27, but at fainter surface brightnesses we trace starlight even further out, in regions with little sign of FUV emission. The H map (Hoopes et al. 2001) traces even younger stars, with ages 10 Myr, effectively giving a measure of the instantaneous star formation rate. Again, we find very little H emission in the very extended features of M101’s disk — the E Spur and NE Plume each host only two small H II regions within their area. Other than these H II regions, we see no H emission in the extended disk, down to the sensitivity limit of erg s-1 cm-2 arcsec-2 (or M☉ yr-1 kpc-2 using the L(H ) to SFR conversion of Hunter et al. 2010).
Finally, the Spitzer IRAC 3.6 map (Dale et al. 2009) can also be seen in Figure 2. Unfortunately, the outermost regions of the optical disk extend off the IRAC pointing and the imaging does not go very deep — it has a limiting surface brightness of 0.004 MJy sr-1, at least an order of magnitude brighter than needed to detect the low surface brightness features at large radius (see e.g., the discussion in Krick et al. 2011). We include it for completeness of multiwavelength montage presented in Figure 2, but do not use it in any of our subsequent analysis.
3.2. Quantitative Structure and Photometric Analysis
Analyzing the structure of M101’s disk over such a broad range of surface brightness and radial extent takes some care. In the faint outer parts of the disk, background objects and faint foreground stars can dominate the light from M101’s disk, and need to be masked before analysis. Furthermore, to maximize signal to noise, we want to median smooth the image after masking. However, in the inner portions of the disk, masking bright sources can eliminate star forming regions of the disk and systematically bias the profile to lower surface brightnesses and redder colors. We therefore take a hybrid approach, where our analyses in the inner disk use the full resolution, unmasked images, while for the outer disk we run the analysis on the images after being masked and rebinned. We choose the transition radius to be 8′, which corresponds to surface brightnesses of roughly 25, and find no sharp discontinuity in the extracted profiles at this radius due to the change in technique.

We start our analysis by quantifying the strength and orientation of the lopsided mode in the disk. As a function of radius, we decompose the azimuthal surface brightness into Fourier modes, i.e.,
As with the surface brightness profile, the analysis is done on the unbinned, unmasked map at R′, and on the binned, masked map at larger radii. The amplitude and position angle of the mode is shown in Figure 3. The amplitude increases continually with radius, such that outside R=12′ the disk is dominated by the mode. The position angle of the lopsided mode swings from the SW ( = 180°–270°) in the inner high surface brightness regions to a NNE position ( 10°–50°) in the outskirts, where the NE Plume dominates the structure of the disk.
Because of the strong asymmetries in the disk of M101, rather than conduct azimuthally averaged surface photometry, we extract surface brightness and color profiles in eight octants around the disk, as well as constructing an azimuthally averaged profile, all shown in Figure 4. At low surface brightness, background estimation and subtraction becomes increasingly important and, on large angular scales, harder to quantify due to uncertainty in sky subtraction as well as structure in the background. We estimate the background correction in two ways: a global background defined as the median pixel intensity in an annulus from R=25′–42′ around M101, and, for each octant, a local background defined by the median pixel intensity in the associated octant of the background annulus. We then calculate surface brightnesses profiles using after correcting for each background measure and plot both measures in Figure 4; the solid lines show the profiles computed using the global correction, while the dashed lines show the profiles which use the local corrections. The differences in the profiles are very minor, typically less than 0.1 mag even in our lowest surface brightness bins.
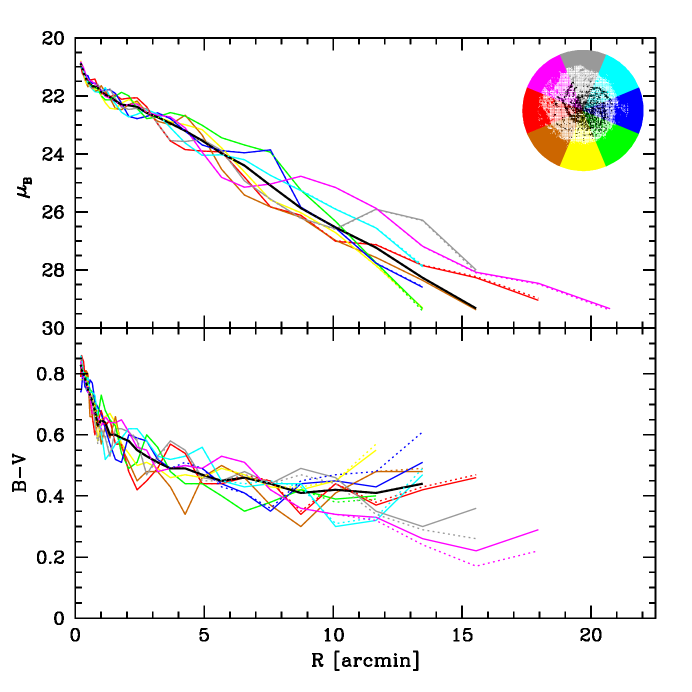
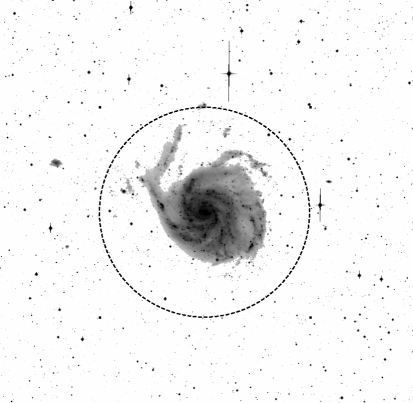
M101’s strong asymmetry is again shown in the wide variation in surface brightness at a given radius, typically 2 mag arcsec-2 outside R=5′. The asymmetry also leads to significant uncertainty in the metrics that measure disk size. One canonical size metric is R25, the radius of the =25 isophote. If we measure R25 by calculating, on an octant by octant basis, the outermost radius at which the mean surface brightness falls below =25, we derive values which range from 6.1′ to 9.4′ (Table 2), depending on azimuth. These values are all significantly smaller than the isophotal size given in the RC3 (de Vaucouleurs et al. 1991), which lists a diameter of D25=28.8′. To examine this discrepancy, we re-display our B band image in Figure 5, showing only pixels brighter than =25, along with dashed circle shows the RC3 diameter. To the north of M101, a small patch of starlight can be seen on the dashed circle at the end of the galaxy’s crooked northeastern spiral arm; if this is strictly interpreted as the galaxy’s outermost =25 isophote at R=14.4′, a doubling to convert radius to diameter would yield the RC3 value of D25=28.8′. Nonetheless, as a global measure of galaxy size, Figure 5 clearly shows that the RC3 value significantly overestimates M101’s =25 isophotal radius, by as much as a factor of two. As an alternative measure that is less sensitive to the morphological distortion of the galaxy, we can calculate an areal-weighted R25 by measuring M101’s surface area at (200 square arcminutes) and converting this to an equivalent R25() of 8.0′. We consider this a more robust measurement of M101’s isophotal size.
Similarly, the exponential scale length of the disk shows significant variation both in azimuth and in the radial range chosen to fit. We measure the disk scale length over two radial regions, the inner disk (R7′) and the outer disk (R9′). Our choice of R=8′ to separate the inner and outer profiles is motivated not only by the fact that it is roughly comparable to the R25 values we derive, but also because we find changes in the profile slope over the radial range R=7′–9′ in the various octants. Fitting the azimuthally averaged surface brightness profile in the inner disk, we derive a B-band scale length of 2.42′ (Table 2), similar to previous values derived from photographic imaging (2.58′, Okamura et al. 1976). However, the scale length of the inner disk varies strongly as a function of azimuth, ranging from 1.9′ to 3.4′ across the various octants. At large radius in the outer disk, the variation in scale length is even greater, from 1.2′ to 4.2′. It is interesting to note that pure azimuthal average hides much of this variation; the fit to the azimuthally averaged outer disk profile yields a scale length similar to the inner disk scale length, and indeed looking at the full, azimuthally averaged profile does not give any sense that multiple fits are warranted. This demonstrates the inherent danger in constructing azimuthally averaged profile; significant structural information can be lost in the azimuthal average.
M101’s color profile is shown in the lower panel of Figure 4, where we plot the color profiles out to our limiting surface brightness of =29. The profiles show a strong gradient in the inner 3′, followed by a much shallower gradient out to 10′. The colors profiles diverge at even larger radius, with some turning redder and some bluer. At the lowest surface brightnesses, uncertainty in the background subtraction begins to affect the color profiles, with color differences of up to 0.1 between the profiles extracted using the “global” versus “local” sky estimates. Nonetheless, the azimuthal differences in color at large radius are larger than this uncertainty. In particular, the extremely blue colors of the NE octant are robust against changes in the background subtraction, and are also not systematically biased by noise in the data. To illustrate this latter point, we have measured the color of the background bins themselves — which essentially measures the color of the noise in the image — and they come out consistently red, with BV colors in the range 0.8–1.0. The red upturn in the outermost radial bin in each octant therefore likely reflects the increasing contribution of background noise to the color profiles.
| R7′ | R9′ | ||||||
|---|---|---|---|---|---|---|---|
| Octant | Figure | ||||||
| Color | [arcmin] | [arcmin] | [mag arcsec-2] | [arcmin] | [mag arcsec-2] | ||
| E | red | 6.8 | 1.96 (0.10) | 21.13 (0.09) | 4.18 (0.34) | 24.25 (0.30) | |
| SE | orange | 6.1 | 2.08 (0.19) | 21.25 (0.14) | 2.48 (0.09) | 22.51 (0.20) | |
| S | yellow | 7.0 | 2.71 (0.21) | 21.51 (0.09) | 1.38 (0.05) | 18.76 (0.30) | |
| SW | green | 8.5 | 3.36 (0.24) | 21.53 (0.07) | 1.18 (0.00) | 17.06 (0.02) | |
| W | blue | 8.3 | 2.49 (0.15) | 21.36 (0.08) | 1.81 (0.28) | 20.60 (1.08) | |
| NW | cyan | 8.2 | 2.39 (0.14) | 21.47 (0.08) | 1.86 (0.28) | 19.92 (1.03) | |
| N | gray | 6.7 | 2.13 (0.11) | 21.29 (0.08) | 3.84 (2.74) | 23.13 (2.59) | |
| NE | magenta | 9.5 | 1.92 (0.11) | 21.14 (0.10) | 2.75 (0.31) | 21.48 (0.67) | |
| AZ | black | 7.4 | 2.42 (0.05) | 21.37 (0.03) | 2.09 (0.06) | 21.25 (0.20) | |
Note. — “AZ” gives the parameters extracted from a circular, azimuthally averaged surface brightness profile.“Figure color” refers to the line and quadrant colors used in Figure 4. Uncertainties are given in parentheses.
3.3. The NE Plume and E Spur
To explore the outer disk of M101 in more detail, we isolate regions defining the NE Plume and E Spur (see Figure 6) and measure the photometric properties of each region using the masked, median binned images. As discussed in Rudick et al. (2010), at low surface brightnesses we obtain better photometric accuracy by making a local background subtraction, where the background is measured in regions that are of comparable size and in close proximity to region of interest. For each of the NE Plume and the E Spur, we identify three sky regions for background subtraction (also shown in Figure 6), and use the variation in the regions (typically 0.2 ADU) to estimate the uncertainty in the measurement. In photometering each region, we restrict the measurement to pixels at low surface brightness, with . There are in fact almost no pixels brighter than the bright cutoff, while the faint cutoff is chosen to reduce noise in the areal photometry. We also apply masks around bright stars to suppress contamination of the photometry due to diffraction spikes, column bleeds, and other high-spatial frequency structure left behind after the subtraction of the extended stellar wings (Slater et al. 2009). In the E Spur, only one small mask was needed, but the NE Plume required three large (′) masks around very bright stars, in addition to a handful of smaller ones around fainter stars. One of the large stellar masks in the NE Plume covers a region of relatively high surface brightness, meaning that our measurements of the luminosity of the region will be slightly underestimated.
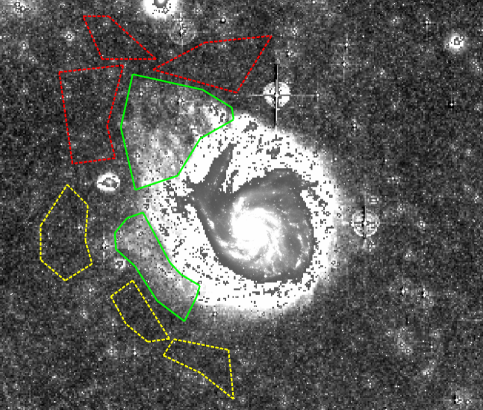
The derived photometric properties of the regions are given in Table 3. We measure a blue luminosity of LB= L☉ and and LB= L☉ for the NE Plume and E Spur, respectively. As suggested by the color map shown in Figure 2 and the color profiles in Figure 4, the BV color of the NE Plume is quite blue, BV=0.21, while the E Spur is redder, BV=0.44. The color measured from the derived B and V luminosities is, of course, luminosity weighted, and could be biased towards the highest surface brightness regions. To guard against such a bias, we also calculate an areal weighted color, defined as the median color of all pixels in the region, and find no significant difference between the areal weighted and luminosity weighted colors.
The very blue BV color of the NE Plume is striking compared to the integrated colors of galaxies. Colors this blue are typically found only in irregular galaxies, and even in those systems they represent the blue extreme (Fukugita et al. 1995; Hunter & Elmegreen 2006). Even gas-rich low surface brightness galaxies, typically thought to be relatively unevolved systems, show BV colors which are typically much redder, with BV 0.4 (Bothun et al. 1997). Given its extremely blue color, it is hard to envision the NE Plume hosting any significant population of old stars, and instead must be dominated by younger populations. We will quantify this argument and explore various star formation histories for the NE Plume using population synthesis models later in this section.
| NE Plume | E Spur | |
|---|---|---|
| Area [ arcsec2] | 5.67 | 2.74 |
| Area [kpc2] | 695 | 336 |
| LB [108 L☉,B] | 0.98 0.003 | 0.78 0.01 |
| LV [108 L☉,V] | 0.66 0.03 | 0.65 0.01 |
| B-V (lum wt) | 0.21 0.05 | 0.44 0.02 |
| B-V (areal wt) | 0.20 0.05 | 0.45 0.02 |
| MHI [] | 6.4 (8.1) | 2.0 (2.0) |
| [] | 1.9 (2.0) | 1.1 (1.1) |
| m(FUV) | 15.64 (15.14) | 16.62 (16.58) |
| SFRFUV [M☉/yr] | 0.015 (0.023) | 0.006 (0.006) |
Note. — In all cases, properties are measured for the regions after applying the star masks corresponding to the optical data. In the case of the THINGS HI data and GALEX far ultraviolet data, properties measured without the optical star masks are given in parentheses.
For a more complete view of the physical properties of these regions, we also measure the HI mass and FUV flux from the THINGS and GALEX datasets, respectively. In doing so, the question arises whether or not to apply the same stellar masks to the multiwavelength data that we used for the optical data. Of course, the contamination to the data from these stars is minimal in the GALEX data, and non-existent in the HI data. However, applying the masks treats all the datasets the same and ensures the most direct comparison between the extracted photometric parameters. To balance these considerations, in the GALEX and THINGS datasets, we measure the properties of each regions both with and without applying the masks, and report both sets of numbers in Table 3.
For each region, we measure the total FUV flux from the GALEX image, subtracting off a background level obtained using the same background regions that were used in the optical photometry. We obtain total FUV magnitudes of and for the NE Plume and E Spur, respectively, with the numbers in parentheses reflecting measurements without the optical star masks being applied. As the FUV emission arises from young stellar populations with typical ages 100 Myr or less, it traces recent star formation in each region. We can convert these fluxes to integrated star formation rates using the prescription of Hunter et al. (2010), which corrects Kennicutt’s (1998) relationship between star formation rate and ultraviolet flux for use in low metallicity environments (as might be expected for the outer regions of M101; Kennicutt et al. 2003). This conversion yields very low star formation rates of 0.015 (0.023) M☉ yr-1 and 0.006 (0.006) M☉ yr-1 for the NE Plume and E Spur, respectively. These star formation rates are approximately 30 times lower than the upper limits set by the lack of H flux in these regions from the Hoopes et al. (2001) dataset (Figure 2).
Using the THINGS HI map, we measure total HI masses of M☉ and M☉ for the NE Plume and E Spur, respectively, and again these are likely underestimates of the total HI mass since both regions extend slightly beyond the extend of the THINGS map. The corresponding mean surface density of the gas is 1.9 and 1.1 M☉ pc-2 in each region. Using the kinematic threshold density argument of Kennicutt (1989), we can calculate the expected critical density for star formation as
where is the circular velocity in km s-1, is the radius in kpc, is a unitless parameter 0.67, and where we have used the flat rotation curve approximation for the relationship. Using a circular velocity of 220 km s-1 (Bosma et al. 1981) and a characteristic radius of 32 kpc for each region, we calculate a critical density for star formation of 2.7 M☉ pc-2. Both regions fall below this threshold density, explaining the lack of significant star formation in each region. The fact that the NE Plume has higher HI surface density, closer to the critical density, may have made it more responsive to any dynamical perturbation, such as a tidal interaction, and result in the somewhat higher star formation rate compared to that seen in the E Spur.
We can also use the optical properties of the regions to make a simple estimate of the time-averaged star formation rates needed to produce the optical luminosity we see. Using GALEV population synthesis models (Kotulla et al. 2009), we first construct constant star formation stellar populations, employing a Kroupa (2001) IMF and fixed sub-solar metallicities of [Fe/H]=–0.3 and –0.7, similar to what is expected for the outer disk of M101 (Kennicutt et al. 2003). We determine the time at which the model color matches the observed color of each region, and use the model mass-to-light ratio at that best-match time to convert the observed stellar luminosity to a stellar mass. The inferred star formation rate is then calculated as the stellar mass divided by the population age. For the NE plume, the population age and stellar mass-to-light ratio inferred from the color are 1.5 Gyr and M/LV=2.0, implying a star formation rate of 0.09 M☉ yr-1 , six times greater than that inferred by the FUV luminosity. In other words, a constant star formation model, when matched to the color of the NE Plume, significantly under-predicts the amount of stellar light. A longer duration of star formation would eventually build up enough stellar luminosity, but at a very late time where the population would be significantly redder than observed.
Given that a constant star formation model cannot explain the photometric properties of the NE Plume, we turn to models involving a burst of star formation, as might be expected if star formation had been triggered by a recent accretion or interaction event. We use GALEV models as before, this time with star formation histories modeled as a Gaussian bursts with peak star formation rates and durations characterized by a Gaussian width . We explore a range of burst durations, ranging =25 Myr to =1 Gyr. We compare the color and luminosity of each model as a function of time to the observed color and luminosity of the NE Plume, dynamically setting to the proper value to yield the UV measured star formation rate at the present time. While the constraining power of the data is limited given the additional free parameters of these models, we find that moderate starbursts with peak intensities of M☉ yr-1 and durations of Myr, observed Myr past peak do a reasonable job of simultaneously matching both the color and luminosity of the NE Plume.
Performing a similar analysis for the E Spur, we find that its much redder color means that a constant star formation history cannot achieve the observed color until an unrealistically late time of 13–15 Gyr. The star formation rate implied by the optical color and luminosity is 0.05 M☉ yr-1 , an order of magnitude greater than the FUV-derived star formation rate. Here too, clearly a constant star formation model will not work; even over a Hubble time, the current star formation rate cannot build up enough luminosity to match that of the E Spur. Unfortunately, its red color makes the E Spur less amenable to any more complicated analysis. Many different star formation histories can produce redder colors, such as old bursts and declining or truncated star formation rates, particularly when combined with the possible effects of dust. A number of plausible scenarios exist — the E Spur could be material pulled out from the inner disk due to a tidal interaction, or it could simply be the continuation of a spiral arm into the outer disk. Unfortunately, our broadband imaging data simply do not have the constraining power to discriminate between these various possibilities.
We have confined our analysis to the outer, tidally disturbed regions of M101 where the dust content is low (e.g., Popescu et al. 2005) and, at least in the case of the NE Plume, the broadband colors are quite blue. Extending the analysis to the inner, redder high surface brightness regions of the galaxy would be significantly complicated by dust extinction and reddening, and yield ambiguous results. However, it is interesting in this context to compare our results to the study of Bianchi et al. (2005) who used GALEX UV colors combined with SDSS optical data to study the recent star formation history of M101’s inner disk (10′). They find UV colors that inconsistent with a constant star formation model, and instead argue for young populations a few hundred million years in age. While these constraints apply to the inner disk, they are qualitatively similar to what we infer from our analysis: young stellar populations in the disk outskirts born in a recent star formation event.
4. Discussion
Our deep optical imaging of M101 has revealed the structure of its outer disk, tracing starlight out to a radius of nearly 50 kpc. The well-known asymmetry in the structure of the high surface brightness, inner parts of the galaxy strengthens at large radius and lower surface brightness, but in a position angle that slews 180° from that of the inner disk. In the outer disk we have identified two low surface brightness features, the NE Plume and E Spur. While the redder colors of the E Spur make it hard to place strong constraints on the stellar populations and dynamical history, the much bluer NE Plume must have formed from very recent star formation in M101’s outer disk. The presence of a significant amount of blue optical light in the NE Plume extends the inferred lifetime for outer disk star formation from the 100 Myr scales traced by the GALEX UV emission (Thilker et al. 2007) to timescales of Gyr.
The ubiquity of star formation in the outskirts of disk galaxies has been shown in a variety of studies, using imaging in H (e.g., Ferguson et al. 1998; van Zee et al. 1998; Goddard et al. 2010) and far ultraviolet (Gil de Paz 2005; Thilker et al. 2005, 2007). Even our own Galaxy shows evidence for such star formation in the outer disk (de Geus et al. 1993; Kobayashi & Tokunaga 2000; Carraro et al. 2010). M101 has been classified a Type I extended ultraviolet (XUV) disk galaxy (Thilker et al. 2007), where structured UV emission is seen well outside the nominal optical size of the disk. A variety of mechanisms have been proposed for exciting such activity, including cold accretion of gas from the surrounding environment, the effects of spiral waves propagating from the inner disk and driving instabilities in the disk outskirts, the accretion of a gas-rich companion, and interaction driven perturbations of existing gas at large radius.
Under cold inflow models, gas condensing from the intergalactic medium can accrete directly onto the outer disk (e.g., Kereš et al. 2005, 2009; Dekel & Birnboim 2006), triggering extended star formation in the disk outskirts. This accretion may be quite lopsided (Stewart et al. 2011), and drive disk asymmetries (Bournaud et al. 2005) similar to those we see in M101. However, while M101 (as well as many other galaxies; Sancisi et al. 2008 and references therein) shows extended HI signatures reminiscent of those seen in cold inflow models, whether this accretion involves truly fresh, primordial gas or gas ejected from the host or companion galaxy during an interaction remains unclear. Furthermore, while the morphological similarities with the cold accretion model are intriguing, cold mode accretion is predicted to shut down for massive (M M☉ ) galaxies at low redshift, after they have build up a hot gaseous halo that impedes the flow of cold gas to the disk (Dekel & Birnboim 2006). While M101 does not host a massive hot halo (Kuntz et al. 2003; Kuntz & Snowden 2010), even a fairly tenuous halo of hot gas could be capable of limiting direct cold inflow. It is unlikely, therefore, that a massive galaxy like M101 would be experiencing any significant cold flow accretion at the present day.
The spiral-driven disk instability model also seems not to explain the structure we see at large radius in M101. Under this model (Bush et al. 2010), star formation in the outer disk should be an ongoing (albeit sporadic) event over the lifetime of the disk, yielding a component of extended starlight that is distributed more evenly in azimuth. This is contrary to what we see in M101, where the extended light is not at all axisymmetric, nor does it have colors indicative of an extended star formation history. Furthermore, in the spiral-driven instability model, the outer disk star formation should trace the spiral pattern of the galaxy (Bush et al. 2010); while this may be the case for the E Spur, the NE Plume extends outwards perpendicular from M101’s strong NE spiral arm, rather than tracing it to the north. The asymmetry of the outer disk and the morphology of the NE Plume makes a poor match for the spiral-driven instability model.
In contrast, the external accretion model for XUV disks fares somewhat better, in that accretion of cold gas would be expected to be more sporadic and asymmetric; a recent accretion event could lead to the structure we see in M101. Deep 21-cm imaging of M101 (e.g., Huchtmeier & Witzel 1979; Allen & Goss 1979; van der Hulst & Sancisi 1988; Walter et al. 2008; Mihos et al. 2012) has shown that the HI distribution around M101 is quite extended and asymmetric, including a very extended plume of material to the southwest at very low column density. Once pulled out, tidal debris typically falls back to the host galaxy over an extended period of time (e.g., Hibbard & Mihos 1995), feeding the outer disk and perhaps triggering star formation as it falls back in. Indeed, the two streams of high velocity gas in M101 first noted by van der Hulst & Sancisi 1988 are spatially coincident with the NE Plume and E Spur (Kamphuis 2008; Sancisi et al. 2008), arguing that these features may have been triggered by recent gas infall from outside M101’s disk.
Even if not driven by direct accretion onto M101’s disk, the extended star formation seen in the NE Plume could be triggered by the tidal effects of an interaction on pre-existing gas in the outer disk. At the HI surface densities found in in this region (1–2 M☉ pc-2), star formation is normally greatly suppressed (Kennicutt 1989; Bigiel et al. 2008), likely due to the difficulty of making molecular gas at low density (Krumholz et al. 2009). While the current star formation activity (as traced by UV and H ) is quite low, it must have been higher in the past to account for the amount of blue light seen in our deep imaging, meaning that the molecular conversion efficiency must have been higher as well. The caustics that form during galaxy encounters (e.g., Struck et al. 2011) are an effective way at compressing gas and driving the formation of molecular clouds, and are also often sites of enhanced star formation in obviously interacting galaxies (Keel & Wehrle 1993; Kaufman et al. 1999; Elmegreen et al. 2000); what we see in M101 may simply be a milder or older version of those more dramatic instances. That the morphology of the NE Plume and E Spur are similar to those seen in simulations of flyby interactions (e.g., Toomre & Toomre 1972; Howard et al. 1993) also argues for an interaction-induced origin. In this scenario, while the interaction may be associated with additional accretion, the extended star formation seen in the NE Plume is induced in the gas pre-existing in M101’s disk, rather than from gas being accreted externally.
If the young features we see in the outer disk are in fact interaction-driven, the clear question is: who is doing the driving? One obvious culprit is the dwarf companion NGC 5477, which currently sits 22′ (44 kpc) east of M101, between the NE Plume and E Spur. Indeed, the morphology of these features is similar to that expected when a satellite galaxy on a prograde orbit opens a gap in the galactic disk (e.g., Hernquist & Mihos 1995; Walker et al. 1995). This could explain the structure of the low surface brightness outer disk, and also perhaps the high velocity gas seen associated with the features, as a small companion embedded in the outer disk could easily excite non-planar motions. However, it would seem difficult for a low luminosity dwarf like NGC 5477 to drive such a strong response in the inner regions of a massive Sc spiral like M101 as well. The luminosity ratio between NGC 5474 and M101 is 250:1 (de Vaucouleurs et al. 1991); if this tracks the mass ratio of the pair, this is an even more low mass interaction than that between the Milky Way and the LMC, and yet the damage done to M101 is significantly more pronounced than anything the LMC has imprinted on the Milky Way.
Another possible interaction partner is NGC 5474, projected 44′ (88 kpc) to the south, but the evidence here is mixed as well. NGC 5474 is more luminous than NGC 5477, making it likely more able to drive a stronger response in M101, but the luminosity ratio between it and M101 (17:1 in V-band) would still classify it as a low mass encounter.333Because both M101 and NGC 5477 are largely face-on and, in the case of M101, kinematically disturbed, deriving dynamical masses for the two galaxies is quite difficult. See, for example, Bosma et al. 1982 and Rownd et al. 1994. NGC 5474 does sport an off-center central bulge, but is otherwise morphologically undisturbed, even its very low surface brightness outer regions (Figure 1). Similarly, its kinematic structure shows no strong deviations from pure circular rotation (Rownd et al. 1994), despite the off-center bulge. However, deep 21-cm mapping traces gas between the two galaxies at intermediate velocities (Mihos et al. 2012), as might be expected from a close passage between the two galaxies. If we take the timescale for the starburst in the NE Plume (250–350 Myr ago) as the time of closest approach, and if the encounter is slow (), as needed to drive a strong response in M101, the timescales would place NGC 5474 100 kpc from M101 today, quite similar to its observed (projected) distance.
Ultimately, however, the story to M101’s dynamical history may be more complex than a single interaction scenario. It may be that both a flyby interaction with a moderately massive galaxy (NGC 5474) and continued dynamical forcing from a satellite companion (NGC 5477) may be needed to describe M101’s full morphological and kinematic structure. Previous simulations by Combes (1991) showed that the high velocity gas in M101 could be explained by an interaction with a companion galaxy, but did not attempt to explain M101’s overall asymmetry, any large scale tidal features, or the properties of its companions. With a wealth of new constraining kinematic and photometric data existing over a wide range of wavelength, new dynamical modeling of the M101 system is clearly warranted.
It is also interesting to ask how the many dynamical processes we see at work in M101 may be reshaping its disk structure over the long term, particularly since much attention has been paid to using differences between the inner and outer scale lengths of spiral galaxies as a tracer of disk evolution. Disk profiles that steepen in the outskirts are referred to as “down-bending” profiles, while surface brightness profiles which flatten with radius are designated “up-bending” (van der Kruit 1979, Pohlen et al. 2002, 2007). Growing evidence suggests that structure in the radial profile of disk galaxies correlates with Hubble type: up-bending profiles are more commonly found in early type disks, while late type spirals (like M101) are more likely to posses down-bending profiles (Pohlen & Trujillo 2006; Erwin et al. 2008; Gutierrez et al. 2011). The cause for this diversity in profiles is quite unclear; possible mechanisms include radial truncations in star formation (Kennicutt et al. 1989), dynamical responses to minor mergers (Younger et al. 2007), and radial migration of stars (Sellwood & Binney 2002; Debattista et al. 2006; Roskar et al. 2008ab). Many of these processes are undoubtedly at work in M101. The induced star formation at large radius see in the NE Plume can build the outer disk stellar populations; interactions with companions can warp and spread existing disk populations, perhaps explaining the E Spur; and M101’s strong asymmetry and spiral structure are sure to drive scattering and outward radial migration of stars from the inner disk.
An examination of M101’s radial profiles (Figure 4) shows that, as a function of azimuth, M101 currently possesses both types of profiles – down-bending to the southwest and up-bending to the northeast. However, while now very asymmetric, as the galaxy evolves much of this light will mix radially and azimuthally, smoothing the disk profile. In this context, it is interesting that our azimuthally averaged disk profiles show no obvious break in either surface brightness or color. Azimuthally averaged, the separate inner and outer profile fits suggest a very slight down-bending profile, but the motivation for separate fits is weak – a single exponential could just as easily fit the profile. In M101, the effects of the extended star formation and the tidal perturbation appear to be building the outer disk by adding or moving stars to large radius. If at earlier times, M101 had a down-bending profile, characteristic of late type spirals (Pohlen & Trujillo 2006) and as seen in the southwest side of the disk, that profile could be being erased by these processes. With M101 living in a group environment, future interactions are likely, and may continue driving a slow evolution of M101’s disk profile from down-bending to up-bending. If repeated interactions also drive a morphological transformation towards earlier Hubble type, this would explain the connection between morphological type and disk profile shape. Particularly since these types of interactions should be common for galaxies in the group environment, we are likely catching M101 in an important phase of galaxy evolution as it continues building its outer disk through triggered star formation and the effects of interactions with its companions.
Of course extrapolating the current profile shape into the future depends not only on effective dynamical mixing, but also on the radial distribution of the underlying stellar population that produces the light. If, for example, the outskirts are dominated by young stars while the inner regions have a mix of stellar ages (and ongoing star formation), the disk may well end up with a down-bending profile as the outer population reddens and fades more rapidly than the inner population. Unfortunately, with only broadband imaging in two bands, our constraints on the stellar populations in M101’s outer disk are limited.
One technique that could yield more information about the stars in M101’s outer disk is direct imaging of the discrete stellar populations in these regions. Such studies using the Hubble Space Telescope in other nearby galaxies have revealed a wealth of information about the ages and metallicities of the stellar populations (Dalcanton et al. 2009, 2012; Williams et al. 2011; Radburn-Smith et al. 2011, 2012). The tip of the main sequence and the presence of “blue loop” stars transiting from the main sequence to the red giant branch can place strong constraints on the stellar population ages for populations younger than about 300 Myr, while for populations older than about 5 Gyr, the shape of the red giant branch constrains the metallicity. Better ages would help refine the timescale and duration of the starburst in the NE Plume, while the metallicity could place constraints on whether these populations were drawn from the inner, more metal-rich disk environment or, instead, formed in-situ from low metallicity gas. At the distance of M101, the tip of the main sequence would be at 27.0–28.5 for population ages 200–300 Myr old, while for older populations the tip of the red giant branch is at , making it a feasible study using deep HST or JWST imaging.
5. Summary
We have used deep (), wide field (6 square degrees) imaging of M101 and its surrounding environment to study the structure of and stellar populations in M101’s outer disk and to search for interaction signatures in M101 and its companion galaxies. We trace starlight in M101’s disk out to nearly 50 kpc, three times the R25 optical radius of the galaxy. The strong asymmetry in M101’s disk slews 180°in azimuth as a function of radius, with the inner disk being distorted to the southwest and the outer disk to the northeast. We identify two structures in M101’s outer disk, the very blue (BV=0.21) NE Plume and the redder (BV=0.44) E Spur. Aside from these features, we see no extended optical tidal debris around M101 or its companions as might be expected to result from a close passage of a massive companion. Nonetheless, the marked asymmetry of both M101 and NGC 5474, and the HI tidal signatures seen in M101 at larger radius (Huchtmeier & Witzel 1979; van der Hulst & Sancisi 1988; Mihos et al. 2012) all argue for ongoing interactions with lower mass companions in the environment of the group.
We construct radial surface brightness and color profiles for M101’s disk, both azimuthally averaged and, due to M101’s strong asymmetry, as a function of azimuth. While the azimuthally averaged surface brightness profile shows a smooth exponential (with scale length ′) out to R=15′, azimuthal averaging hides much of the interesting structure in M101’s disk. As a function of azimuth, M101’s surface brightness profile exhibits both truncated and anti-truncated structure. The disk shows a steep color gradient in the inner 3′, followed by a much shallower gradient out to R′. Outside this radius the different color profiles diverge, with some turning red (BV 0.5) and others staying quite blue (BV 0.2–0.3). The strong asymmetry of the disk makes a unique determination of the R25 optical radius impossible, with values ranging from R25=6.1′–9.4′; we recommend using an areal-weighted value of R25=8.0′ over the RC3 value of R25=14.4′.
As the dominant member of a small group of galaxies, M101 gives us a view of processes shaping the evolution of disk galaxies in the group environment. The disk’s strong asymmetry and azimuthally varying color and luminosity profiles show a galaxy building up the stellar populations in its outer disk, likely driven by fly-by interactions with its less-massive companion galaxies. These interactions can build the outer disk by a variety of mechanisms. Direct accretion of material from the companion can deposit stars and gas into the disk outskirts, and the spatial coincidence between the extended NE Plume and E Spur and the high velocity HI clouds in M101’s disk (van der Hulst & Sancisi 1988) may be a signal of such activity. However, even in the absence of direct accretion, interactions can grow the outer disk by triggering new star formation in the galaxy’s extended HI disk, and indeed the blue colors of the NE Plume argue for a burst of star formation 250–350 Myr ago, possibly dating a recent encounter with NGC 5474, 44′ (88 kpc) to the south of M101. The redder E Spur may also have formed during this interaction, from material drawn out from the inner disk of M101. Alternatively, or perhaps concurrently, an interaction with nearby (22′, 44 kpc) dwarf companion NGC 5477 may also drive some of the response seen M101’s outer disk. These encounters all act to dynamically heat the disk and move stars from the inner regions to the disk outskirts, either on rapid timescales as tidal features form during the initial encounter, or on longer timescales as the self-gravitating response of the disk drives radial migration of stars outwards (e.g., Sellwood & Binney 2002; Debattista et al. 2006; Roskar et al. 2008ab). In M101, we are likely witnessing the growth and reshaping of its outer disk due to these processes, triggered by interactions in the group environment.
References
- Allen & Goss (1979) Allen, R. J., & Goss, W. M. 1979, A&AS, 36, 135
- Arp (1966) Arp, H. 1966, Pasadena: California Inst. Technology, 1966,
- Bakos et al. (2008) Bakos, J., Trujillo, I., & Pohlen, M. 2008, ApJ, 683, L103
- Beale & Davies (1969) Beale, J. S., & Davies, R. D. 1969, Nature, 221, 531
- Bianchi et al. (2005) Bianchi, L., Thilker, D. A., Burgarella, D., et al. 2005, ApJ, 619, L71
- Bigiel et al. (2008) Bigiel, F., Leroy, A., Walter, F., et al. 2008, AJ, 136, 2846
- Bosma et al. (1981) Bosma, A., Goss, W. M., & Allen, R. J. 1981, A&A, 93, 106
- Bothun et al. (1997) Bothun, G., Impey, C., & McGaugh, S. 1997, PASP, 109, 745
- Bournaud et al. (2005) Bournaud, F., Combes, F., Jog, C. J., & Puerari, I. 2005, A&A, 438, 507
- Bullock & Johnston (2005) Bullock, J. S., & Johnston, K. V. 2005, ApJ, 635, 931
- Bush et al. (2010) Bush, S. J., Cox, T. J., Hayward, C. C., et al. 2010, ApJ, 713, 780
- Carraro et al. (2010) Carraro, G., Vázquez, R. A., Costa, E., Perren, G., & Moitinho, A. 2010, ApJ, 718, 683
- Combes (1991) Combes, F. 1991, A&A, 243, 109
- Dalcanton et al. (2012) Dalcanton, J. J., Williams, B. F., Lang, D., et al. 2012, ApJS, 200, 18
- Dalcanton et al. (2009) Dalcanton, J. J., Williams, B. F., Seth, A. C., et al. 2009, ApJS, 183, 67
- Dale et al. (2009) Dale, D. A., Cohen, S. A., Johnson, L. C., et al. 2009, ApJ, 703, 517
- Davies et al. (1980) Davies, R. D., Davidson, G. P., & Johnson, S. C. 1980, MNRAS, 191, 253
- de Geus et al. (1993) de Geus, E. J., Vogel, S. N., Digel, S. W., & Gruendl, R. A. 1993, ApJ, 413, L97
- de Mello et al. (2008) de Mello, D. F., Smith, L. J., Sabbi, E., et al. 2008, AJ, 135, 548
- de Vaucouleurs et al. (1991) de Vaucouleurs, G., de Vaucouleurs, A., Corwin, H. G., Jr., et al. 1991, Third Reference Catalogue of Bright Galaxies. Volume I: Explanations and references. Volume II: Data for galaxies between 0h and 12h. Volume III: Data for galaxies between 12h and 24h., by de Vaucouleurs, G.; de Vaucouleurs, A.; Corwin, H. G., Jr.; Buta, R. J.; Paturel, G.; Fouqué, P.. Springer, New York, NY (USA), 1991, 2091 p., ISBN 0-387-97552-7, Price US$ 198.00. ISBN 3-540-97552-7, Price DM 448.00. ISBN 0-387-97549-7 (Vol. I), ISBN 0-387-97550-0 (Vol. II), ISBN 0-387-97551-9 (Vol. III).,
- Debattista et al. (2006) Debattista, V. P., Mayer, L., Carollo, C. M., et al. 2006, ApJ, 645, 209
- Dekel & Birnboim (2006) Dekel, A., & Birnboim, Y. 2006, MNRAS, 368, 2
- Elmegreen et al. (2000) Elmegreen, B. G., Kaufman, M., Struck, C., et al. 2000, AJ, 120, 630
- Erwin et al. (2008) Erwin, P., Pohlen, M., & Beckman, J. E. 2008, AJ, 135, 20
- Feldmeier et al. (2002) Feldmeier, J. J., Mihos, J. C., Morrison, H. L., Rodney, S. A., & Harding, P. 2002, ApJ, 575, 779
- Ferguson et al. (1998) Ferguson, A. M. N., Wyse, R. F. G., Gallagher, J. S., & Hunter, D. A. 1998, ApJ, 506, L19
- Fukugita et al. (1995) Fukugita, M., Shimasaku, K., & Ichikawa, T. 1995, PASP, 107, 945
- Geller & Huchra (1983) Geller, M. J., & Huchra, J. P. 1983, ApJS, 52, 61
- Gil de Paz et al. (2005) Gil de Paz, A., Madore, B. F., Boissier, S., et al. 2005, ApJ, 627, L29
- Gil de Paz et al. (2007) Gil de Paz, A., Boissier, S., Madore, B. F., et al. 2007, ApJS, 173, 185
- Goddard et al. (2010) Goddard, Q. E., Kennicutt, R. C., & Ryan-Weber, E. V. 2010, MNRAS, 405, 2791
- Gutiérrez et al. (2011) Gutiérrez, L., Erwin, P., Aladro, R., & Beckman, J. E. 2011, AJ, 142, 145
- Hernquist & Mihos (1995) Hernquist, L., & Mihos, J. C. 1995, ApJ, 448, 41
- Hibbard & Mihos (1995) Hibbard, J. E., & Mihos, J. C. 1995, AJ, 110, 140
- Hoopes et al. (2001) Hoopes, C. G., Walterbos, R. A. M., & Bothun, G. D. 2001, ApJ, 559, 878
- Howard et al. (1993) Howard, S., Keel, W. C., Byrd, G., & Burkey, J. 1993, ApJ, 417, 502
- Huchtmeier & Richter (1988) Huchtmeier, W. K., & Richter, O.-G. 1988, A&A, 203, 237
- Huchtmeier & Witzel (1979) Huchtmeier, W. K., & Witzel, A. 1979, A&A, 74, 138
- Hunter & Elmegreen (2006) Hunter, D. A., & Elmegreen, B. G. 2006, ApJS, 162, 49
- Hunter et al. (2010) Hunter, D. A., Elmegreen, B. G., & Ludka, B. C. 2010, AJ, 139, 447
- Ivezić et al. (2007) Ivezić, Ž., Smith, J. A., Miknaitis, G., et al. 2007, AJ, 134, 973
- Kamphuis (2008) Kamphuis, P. 2008, Ph.D. Thesis, University of Groningen
- Karachentsev et al. (2004) Karachentsev, I. D., Karachentseva, V. E., Huchtmeier, W. K., & Makarov, D. I. 2004, AJ, 127, 2031
- Kaufman et al. (1999) Kaufman, M., Brinks, E., Elmegreen, B. G., et al. 1999, AJ, 118, 1577
- Keel & Wehrle (1993) Keel, W. C., & Wehrle, A. E. 1993, AJ, 106, 236
- Kennicutt (1998) Kennicutt, R. C., Jr. 1998, ARA&A, 36, 189
- Kennicutt (1989) Kennicutt, R. C., Jr. 1989, ApJ, 344, 685
- Kennicutt et al. (2003) Kennicutt, R. C., Jr., Bresolin, F., & Garnett, D. R. 2003, ApJ, 591, 801
- Kereš & Hernquist (2009) Kereš, D., & Hernquist, L. 2009, ApJ, 700, L1
- Kereš et al. (2009) Kereš, D., Katz, N., Fardal, M., Davé, R., & Weinberg, D. H. 2009, MNRAS, 395, 160
- Kereš et al. (2005) Kereš, D., Katz, N., Weinberg, D. H., & Davé, R. 2005, MNRAS, 363, 2
- Kobayashi & Tokunaga (2000) Kobayashi, N., & Tokunaga, A. T. 2000, ApJ, 532, 423
- Kornreich et al. (1998) Kornreich, D. A., Haynes, M. P., & Lovelace, R. V. E. 1998, AJ, 116, 2154
- Kornreich et al. (2000) Kornreich, D. A., Haynes, M. P., Lovelace, R. V. E., & van Zee, L. 2000, AJ, 120, 139
- Kotulla et al. (2009) Kotulla, R., Fritze, U., Weilbacher, P., & Anders, P. 2009, MNRAS, 396, 462
- Kovač et al. (2010) Kovač, K., Lilly, S. J., Knobel, C., et al. 2010, ApJ, 718, 86
- Krick et al. (2011) Krick, J. E., Bridge, C., Desai, V., et al. 2011, ApJ, 735, 76
- Kroupa (2001) Kroupa, P. 2001, MNRAS, 322, 231
- Krumholz et al. (2009) Krumholz, M. R., McKee, C. F., & Tumlinson, J. 2009, ApJ, 693, 216
- Kuntz & Snowden (2010) Kuntz, K. D., & Snowden, S. L. 2010, ApJS, 188, 46
- Kuntz et al. (2003) Kuntz, K. D., Snowden, S. L., Pence, W. D., & Mukai, K. 2003, ApJ, 588, 264
- Leitherer et al. (1999) Leitherer, C., Schaerer, D., Goldader, J. D., et al. 1999, ApJS, 123, 3
- Lupton et al. (1999) Lupton, R. H., Gunn, J. E., & Szalay, A. S. 1999, AJ, 118, 1406
- Maltby et al. (2012) Maltby, D. T., Gray, M. E., Aragón-Salamanca, A., et al. 2012, MNRAS, 419, 669
- Martínez-Delgado et al. (2010) Martínez-Delgado, D., Gabany, R. J., Crawford, K., et al. 2010, AJ, 140, 962
- Martin & Kennicutt (2001) Martin, C. L., & Kennicutt, R. C., Jr. 2001, ApJ, 555, 301
- Matheson et al. (2012) Matheson, T., Joyce, R. R., Allen, L. E., et al. 2012, ApJ, 754, 19
- McGaugh & de Blok (1997) McGaugh, S. S., & de Blok, W. J. G. 1997, ApJ, 481, 689
- McGee et al. (2008) McGee, S. L., Balogh, M. L., Henderson, R. D. E., et al. 2008, MNRAS, 387, 1605
- Mihos et al. (2005) Mihos, J. C., Harding, P., Feldmeier, J., & Morrison, H. 2005, ApJ, 631, L41
- Mihos et al. (2012) Mihos, C., Keating, K., Holley-Bockelmann, K., Pisano, D. J., & Kassim, N. 2012, arXiv:1210.8333
- Okamura et al. (1976) Okamura, S., Kanazawa, T., & Kodaira, K. 1976, PASJ, 28, 329
- Pohlen et al. (2002) Pohlen, M., Dettmar, R.-J., Lütticke, R., & Aronica, G. 2002, A&A, 392, 807
- Pohlen & Trujillo (2006) Pohlen, M., & Trujillo, I. 2006, A&A, 454, 759
- Pohlen et al. (2007) Pohlen, M., Zaroubi, S., Peletier, R. F., & Dettmar, R.-J. 2007, MNRAS, 378, 594
- Popescu et al. (2005) Popescu, C. C., Tuffs, R. J., Madore, B. F., et al. 2005, ApJ, 619, L75
- Radburn-Smith et al. (2011) Radburn-Smith, D. J., de Jong, R. S., Seth, A. C., et al. 2011, ApJS, 195, 18
- Radburn-Smith et al. (2012) Radburn-Smith, D. J., Roškar, R., Debattista, V. P., et al. 2012, ApJ, 753, 138
- Roškar et al. (2008) Roškar, R., Debattista, V. P., Quinn, T. R., Stinson, G. S., & Wadsley, J. 2008, ApJ, 684, L79
- Roškar et al. (2008) Roškar, R., Debattista, V. P., Stinson, G. S., et al. 2008, ApJ, 675, L65
- Roberts & Haynes (1994) Roberts, M. S., & Haynes, M. P. 1994, ARA&A, 32, 115
- Rownd et al. (1994) Rownd, B. K., Dickey, J. M., & Helou, G. 1994, AJ, 108, 1638
- Rudick et al. (2010) Rudick, C. S., Mihos, J. C., Harding, P., et al. 2010, ApJ, 720, 569
- Sancisi et al. (2008) Sancisi, R., Fraternali, F., Oosterloo, T., & van der Hulst, T. 2008, A&A Rev., 15, 189
- Schlafly & Finkbeiner (2011) Schlafly, E. F., & Finkbeiner, D. P. 2011, ApJ, 737, 103
- Sellwood & Binney (2002) Sellwood, J. A., & Binney, J. J. 2002, MNRAS, 336, 785
- Slater et al. (2009) Slater, C. T., Harding, P., & Mihos, J. C. 2009, PASP, 121, 1267
- Stewart et al. (2011) Stewart, K. R., Kaufmann, T., Bullock, J. S., et al. 2011, ApJ, 738, 39
- Struck et al. (2011) Struck, C., Dobbs, C. L., & Hwang, J.-S. 2011, MNRAS, 414, 2498
- Thilker et al. (2005) Thilker, D. A., Bianchi, L., Boissier, S., et al. 2005, ApJ, 619, L79
- Thilker et al. (2007) Thilker, D. A., Bianchi, L., Meurer, G., et al. 2007, ApJS, 173, 538
- Toomre & Toomre (1972) Toomre, A., & Toomre, J. 1972, ApJ, 178, 623
- Tran et al. (2001) Tran, K.-V. H., Simard, L., Zabludoff, A. I., & Mulchaey, J. S. 2001, ApJ, 549, 172
- Tully (1988) Tully, R. B. 1988, Cambridge and New York, Cambridge University Press, 1988, 221 p.,
- van der Hulst & Huchtmeier (1979) van der Hulst, J. M., & Huchtmeier, W. K. 1979, A&A, 78, 82
- van der Hulst & Sancisi (1988) van der Hulst, T., & Sancisi, R. 1988, AJ, 95, 1354
- van der Kruit (1979) van der Kruit, P. C. 1979, A&AS, 38, 15
- van Zee et al. (1998) van Zee, L., Salzer, J. J., Haynes, M. P., O’Donoghue, A. A., & Balonek, T. J. 1998, AJ, 116, 2805
- Walker et al. (1996) Walker, I. R., Mihos, J. C., & Hernquist, L. 1996, ApJ, 460, 121
- Waller et al. (1997) Waller, W. H., Bohlin, R. C., Cornett, R. H., et al. 1997, ApJ, 481, 169
- Walter et al. (2008) Walter, F., Brinks, E., de Blok, W. J. G., et al. 2008, AJ, 136, 2563
- Williams et al. (2011) Williams, B. F., Dalcanton, J. J., Johnson, L. C., et al. 2011, ApJ, 734, L22
- Younger et al. (2007) Younger, J. D., Cox, T. J., Seth, A. C., & Hernquist, L. 2007, ApJ, 670, 269
- Zaritsky et al. (1990) Zaritsky, D., Hill, J. M., & Elston, R. 1990, AJ, 99, 1108