A comprehensive study of NGC 2023 with XMM-Newton and Spitzer††thanks: This publication makes use of data products from the Two Micron All Sky Survey, which is a joint project of the University of Massachusetts and the Infrared Processing and Analysis Center/California Institute of Technology, funded by the National Aeronautics and Space Administration and the National Science Foundation. This research has also made use of the Centre de Donn es Astronomiques de Strasbourg (CDS) tool Aladin.
Abstract
Nearby star-forming regions are ideal laboratories to study high-energy emission of different stellar populations, from very massive stars to brown dwarfs. NGC 2023 is a reflection nebula situated to the south of the Flame Nebula (NGC 2024) and at the edge of the H ii region IC 434, which also contains the Horsehead Nebula (Barnard 33). NGC 2023, NGC 2024, Barnard 33 and the surroundings of the O-type supergiant star Ori constitute the south part of the Orion B molecular complex. In this work, we present a comprehensive study of X-ray emitters in the region of NGC 2023 and its surroundings. We combine optical and infrared data to determine physical properties (mass, temperature, luminosity, presence of accretion disks) of the stars detected in an XMM-Newton observation. This study has allowed us to analyze spectral energy distribution of these stars for the first time and determine their evolutionary stage. Properties of the X-ray emitting plasma of these stars are compared to those found in other nearby star-forming regions. The results indicate that the stars that are being formed in this region have characteristics, in terms of physical properties and luminosity function, similar to those found in the Taurus-Auriga molecular complex.
keywords:
(Galaxy:) open clusters and associations: general – stars: pre-main-sequence – stars: coronae – X-rays: stars1 Introduction
Star-forming regions are the best laboratories to study the different physical processes that give rise to X-ray emission. X-ray photons are little absorbed by interstellar material and young stars show higher levels of X-ray emission than main-sequence stars. High-energy radiation plays an important role in the development and evolution of stellar protoplanetary disks (Bally et al., 2000; Scally & Clarke et al., 2001) and planetary atmospheres (e.g. Penz et al., 2008) and contributes to the disruption of star formation by causing molecular material blow out. Outflows, jets and winds are the main mechanisms to modify the molecular cloud environment, except for supernova explosions. They displace cloud material but also trigger star formation.
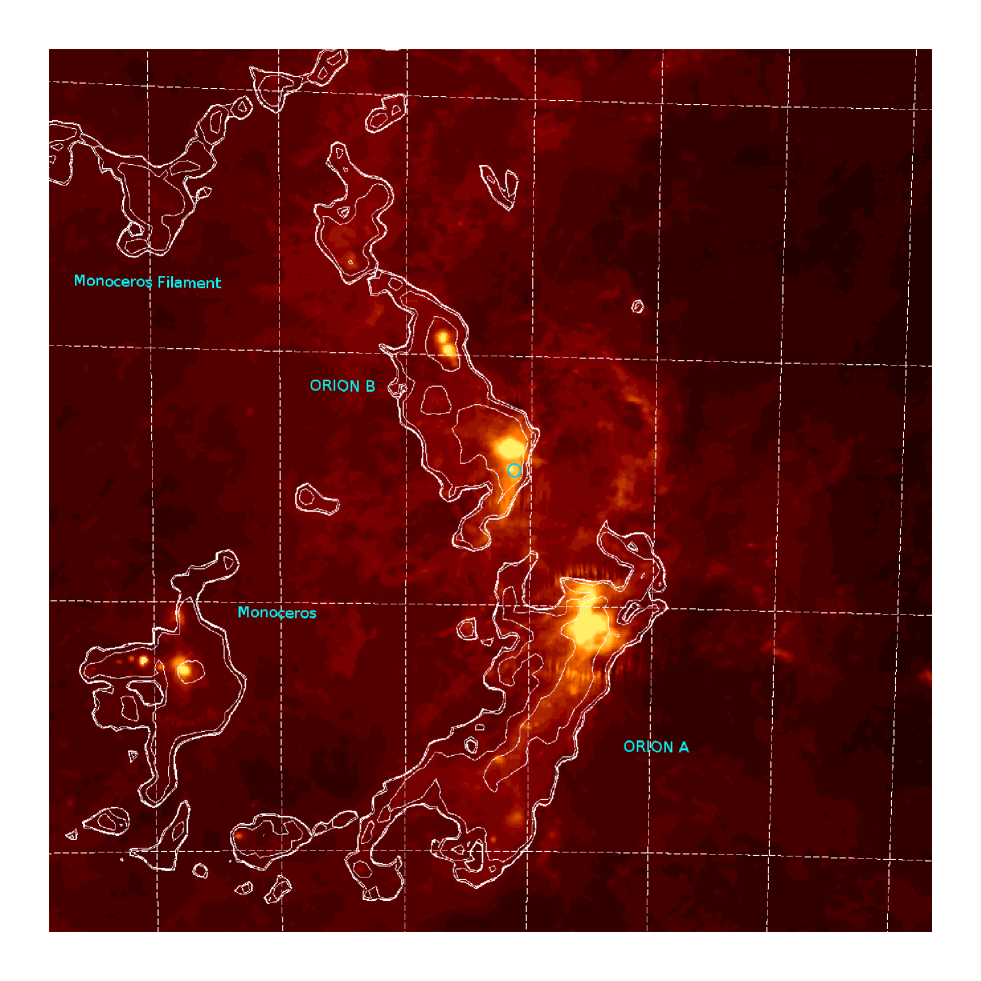
The Orion giant molecular complex (see Fig. 9) consists of two main large structures, usually referred to as Orion A and B, and a number of less massive filaments (see Genzel & Stutzki et al., 1989, for a detailed description). The Orion A molecular cloud contains the Orion Nebula Cluster (ONC) which is the closest OB association to the sun ( pc). Because of its proximity, the ONC is one of the most visited targets for numerous studies, including the relation between cloud kinematics and star formation (see Hartman & Burkert et al., 2007, and references therein), protostellar and circumstellar disk characteristics (e.g. Fang et al., 2009; Ingleby et al., 2009; Wilson et al., 2011) and the properties of the X-ray emission of young stellar objects and T Tauri stars (see Preibisch et al., 2005, and the rest of the articles of the Chandra Orion Ultradeep Project (COUP) in the special issue of the ApJS). An extensive study of Orion A combining data from the XMM-Newton and Spitzer missions is just being carried out (see preliminary results in Wolk et al., 2010a; Pillitteri et al., 2010).
Equally interesting for studies on stellar formation is the Orion B molecular cloud. The complex extends roughly south-north and contains the Horsehead Nebula, NGC 2023, NGC 2024, and several other reflection nebulae, such as NGC 2068 and NGC 2071. The southern part of Orion B (L 1630) borders the large H ii region IC 434, which is expanding into the molecular cloud. The interface between the molecular cloud and the H ii region (IC 434) is seen as a bright ridge of glowing gas with the Horsehead Nebula and several smaller pillars (Mookerjea et al., 2009). The Horsehead Nebula points directly towards the multiple system Ori, which is ionizing IC 434. At a distance of 350–450 pc, the Horsehead Nebula is the closest pillar to the Sun and represents an ideal laboratory to study the emergence and evolution of X-ray emission in very young stars, their X-ray properties and the influence of X-ray emission and its variability on the heating and evolution of proto-planetary disks (see infrared studies by Bowler et al., 2009; Mookerjea et al., 2009).
NGC 2023 is located about 15 arcmin to the northeast of the pillar. In contrast to NGC 2024, that contains an embedded stellar cluster with more than 200 members and several protostar candidates (Haisch et al., 2000; Skinner et al., 2003), NGC 2023 shows low stellar density. Some radio clumps have been detected using the VLA (Anglada & Rodríguez et al., 2002; Reipurth et al., 2004). One of them, the source NGC 2023 MM 1, is a confirmed (very cold) Class 0 source driving a large and well collimated molecular outflow (Sandell et al., 1999). Three Herbig-Haro objects were identified by Malin et al. (1987): [MOW87] HH1, HH2, and HH3. Mookerjea et al. (2009) associated HH3 with the classical T Tauri star V615 Ori, but the association of HH1 and HH2 with a detected source is more uncertain. The authors associated HH2 to the mid-infrared source MIR-51, while HH1 could be associated to the radio source NGC 2023 MM3, the mid-infrared source MIR-62 or even the near-infrared source NIR-15, merely at 40 arcsec from HH1.
The age of NGC 2023 is not well established. Alcala et al. (2000) derived ages in the range Myr for stars in the L 1641 and L 1630 clouds with an X-ray counterpart. For NGC 2024, Eisner & Carpenter (2003) determined an age of 0.3 Myr from the disk frequency, while Ali et al (1998) proposed 0.5 Myr as the age of this cluster, based in infrared photometry. The coexistence of both radio clumps and stars without a protoplanetary disk in the region of NGC 2023 (e.g. Mookerjea et al., 2009) suggests that star formation has taken place during several million years, although this hypothesis should be tested robustly.
In this work, we present for the first time a comprehensive study of the X-ray sources in the star-forming region NGC 2023 and its surroundings. We give general X-ray emission characteristics of the sources (temperature, column density and emission measure) and compare them with the results obtained for the nearby regions Taurus (Güdel et al., 2007) and Orion Nebula Cluster (ONC; Preibisch et al., 2005). We complete a multi-wavelength study of the X-ray detected sources using data from the literature. In addition, archival observations from the Spitzer infrared observatory are analyzed. We then classify the X-ray sources into classes I, II and III objects according to their infrared characteristics.
| PN | MOS1 | MOS2 | |
|---|---|---|---|
| Exp. time (ks) | 25.09 | 29.13 | 29.12 |
| Effective exp. time (ks) | 13.60 | 15.00 | 15.80 |
| Filter | Medium | Thin | Medium |
| Obs. mode | Extented Full Frame | Full Frame | Full Frame |
2 X-ray observation and data reduction
The XMM-Newton observation of the NGC 2023 reflection nebula (ID 0112640201) was part of an observing program aimed at studying deeply embedded stellar clusters in Orion B. The observation was performed as a single, 30 ks long exposure on 2002 during satellite revolution 419. The EPIC (European Photon Imaging Camera) was used in full-frame mode as primary instrument. The observation was centered at and . Table 1 summarizes the information of the parameters used for each EPIC detector.
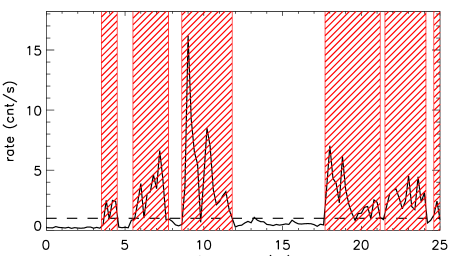
The data reduction was done through the XMM-Newton Science Analysis System (SAS) software, version 10.0. Images and spectra were produced with the standard SAS tools. We rejected high background periods from the analysis of the lightcurve of the whole detector (independently for EPIC-MOS and PN) and selected time periods with constant, low X-ray emission at keV (Fig. 1). Bad events and noise were also rejected to create the final (GTIs; good time intervals) event tables. From our analysis, we conclude that the observation was largely contaminated by high X-ray emission background periods (usually attributed to protons and other relativistic particles produced during solar flares). After our processing, the useful exposure time was reduced to 13.6 ks for PN, 15 ks for MOS1 and 15.8 ks for MOS2. Hereafter, we use the cleaned event lists.
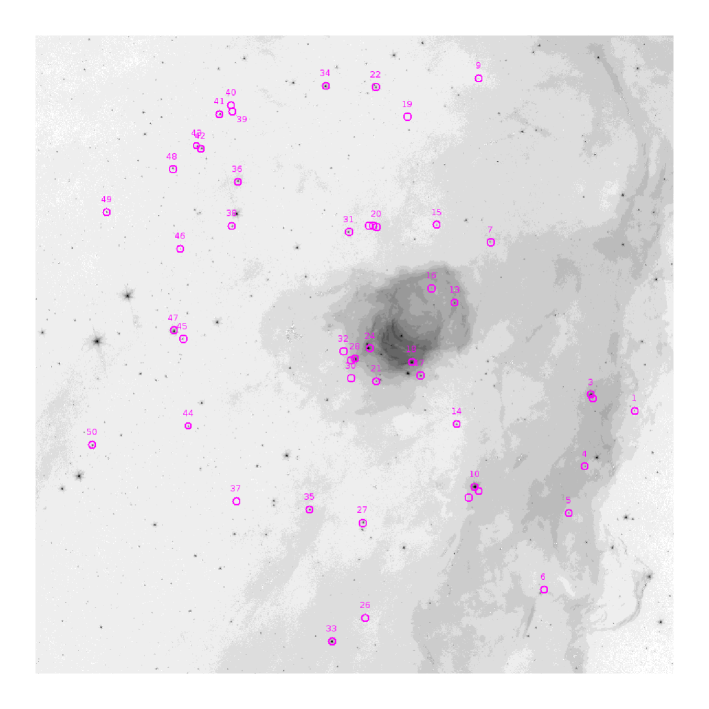
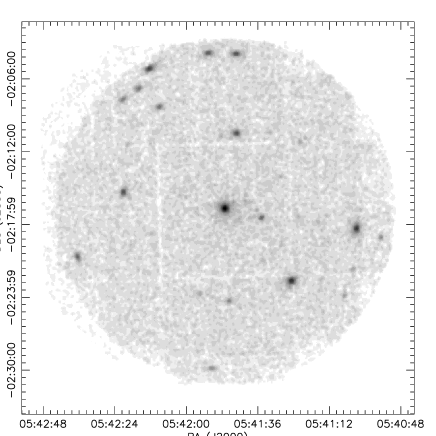
In Fig. 2, we show a mosaic of PN and MOS images of NGC 2023 in the energy band 0.3–8.0 keV, created with the task emosaic. We used the SAS task edetect_chain to reveal sources at three different energy bands (0.3–1.2, 1.2–2.5, 2.5–4.5 keV) in PN, MOS1 and MOS2 separately. A second stage consisted of using the 0.3-8.0 keV energy band to confirm the first detections. A total of 50 sources were detected. After a careful inspection that includes a cross-match with optical and infrared catalogs (see Section 3), we discarded 14 of them because they were multiple or spurious detections, typically at the detector border or close to a bright source. The list of the X-ray sources is given in appendix (Table 4). We have removed those sources considered as spurious detections during the optical and infrared analyses (Section 3) from the tables, although we have maintained the original numeration for convenience. X-ray sources of Yamauchi et al. (2000) are identified in the table last column as [YKK2000] followed by the ID number given by the authors.
3 Infrared properties of X-ray sources
3.1 Spitzer
The region of NGC 2023 and its surroundings present a large amount of gas and dust that produces high optical and near-infrared absorption (see Bowler et al., 2009). The absorption by the gas and dust is less dramatic in the mid-infrared, in particular in the Spitzer-IRAC bands and in radio-wavelengths. Mookerjea et al. (2009) used archive Spitzer observations of this region and sub-millimetric observations performed by themselves with the Submillimeter Common User Bolometric Array (SCUBA; Holland et al., 1999) to create an infrared census of young stellar objects and protostars. Mookerjea et al. (2009) analyzed only part of the Spitzer-IRAC observations, close to the Horsehead. The region they selected overlaps only partially with the XMM-Newton observation, that is centered on NGC 2023. We have reanalyzed the Spitzer data covering the XMM-Newton field of view to look for infrared counterparts of all the X-ray detected sources.
For our work, we used the observations with aorkey numbers 8773120 and 8773632. Two collections of images are present in those observations for each IRAC channel, corresponding to two different configurations with frame-time 0.6 and 10.4 seconds, respectively. We treated both datasets separately. The regular IRAC pipeline of MOPEX (version 18.4.9) was used for the reduction and the mosaic creation. At the end of the reduction process, we had two mosaics for each IRAC channel and observation, for a total of four mosaics per channel. Photometric analysis was performed in each mosaic independently.
It was not the aim of this work to obtain IRAC fluxes for all the sources in the field. We determined infrared fluxes only for the IR counterparts of the X-ray sources (see Fig. 10). To derive the fluxes, we used the daophot package included in IDL, which is an adaptation of the Fortran code also used in IRAF111IRAF: http://iraf.noao.edu/. Aperture photometry with three different extraction radii (2, 3 and 4 arcsec) was performed. For the background (sky) subtraction, we used an annulus with inner and outer radii 20 and 30 arcsec, respectively. The mosaics performed by MOPEX are in units of MJy/sr. We transformed them to mJy and applied an aperture correction. Aperture corrections were estimated from semi-empirical point response functions (PRFs)222“Spitzer pixels are relatively big relative to point sources, so MOPEX fits with Point Response Functions (PRFs), which take into account intra-pixel sensitivities.” given in the Spitzer Manual. Their values are given in Table 2 for each channel. The uncertainties include the effects of typical World Coordinate System (WCS) random alignment errors (always less than 1 pixel; see Pérez-González et al., 2008). For each source, we determined magnitudes in AB system and Vega system. The latter were determined using the flux to magnitude conversion of the GLIMPSE333GLIMPSE: http://www.astro.wisc.edu/sirtf/. For each infrared source, fluxes determined with extraction radii of two, three and four arcsec are very similar except for the two most brilliant IRAC sources, that show differences of up to 10% in the four channels. The same statement is applicable to the comparison between observations with frame times 0.6 and 12 seconds. In the latter case, the differences arise from the fact that those sources are very close to the saturation regime for long exposures. To avoid problems with those sources, we decided to use only the images with shorter exposure times. The Spitzer photometry for our sources is given in Table 6. We note that Src. 24 was not cross-identified with an unique IRAC counterpart because of the proximity of several infrared sources that contaminate the photometric measures. In the tables, we give photometry of the closest star to this Src. 24 for completeness. However, those values are not reliable and we did not used them in our study.
| IRAC channel | ||||
| Aperture | 3.6m | 4.5m | 5.4m | 8.0m |
| (arcsec) | (mag) | (mag) | (mag) | (mag) |
| 1.5 | 0.59 0.04 | 0.63 0.04 | 0.83 0.04 | 0.94 0.06 |
| 2.0 | 0.32 0.03 | 0.36 0.03 | 0.53 0.02 | 0.65 0.03 |
| 3.0 | 0.13 0.03 | 0.14 0.02 | 0.22 0.02 | 0.36 0.02 |
| 4.0 | 0.03 0.02 | 0.03 0.02 | 0.05 0.02 | 0.21 0.03 |
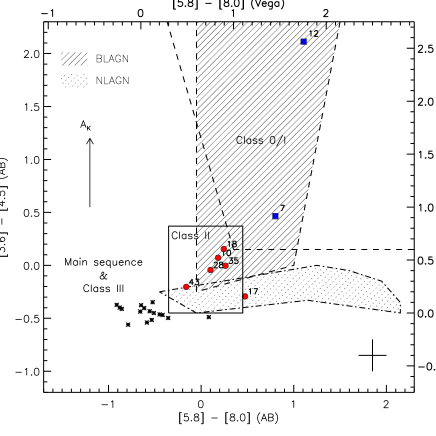
Figure 3 shows a color-color diagram of the four IRAC channels for those of our sources with a counterpart in the four bands. We have marked the typical location of infrared class I, II and III objects and the locii of broad-line and narrow-line active galactic nuclei as shown by Stern et al. (2005). Source ID numbers for class I and class II objects are overplotted. The cross at the right bottom corner represents the mean error bar in both colors. The typical error in the colors of bright sources is 0.1 mag. Faint sources show error bars with values as large as 1.2 mag in some cases.
The main concentration of sources is detected upon class III, that are usually identified with weak-line T Tauri and main sequence stars (asterisks in Figure 3). Five sources are situated inside the boundaries of the class II type objects and another two are very close to those boundaries. Stellar sources with infrared class II objects nature are typically identified with classical T Tauri stars. In Figure 3, we have plotted them as filled circles. Finally, two sources have colors typical of class I objects (squares in the figure). Stellar sources with such infrared properties use to be related to protostars and T Tauri stars with circumstellar envelopes. A note of caution must be given here. Very absorbed class II objects may present IRAC colors typical of class I objects. Therefore, the two sources in Fig. 3 classified as class I objects may be absorbed class II stars. In fact, one of the sources has been previously classified as a class II star in the literature. This is the case of the object detected by Mookerjea et al. (2009) with Spitzer and SCUBA (named VLA 3 and MIR 46 in their paper, source number 7 in our work, Src 7).
3.2 Other photometric data from the literature
We complemented our study by cross-correlating our sample against different catalogs. In particular, we used the second version of the TASS Mark IV photometric catalog (Droege et al., 2006, 2007) for magnitudes, DENIS database 3rd release (DENIS Consortium, 2005) for magnitudes, the 2MASS database (Skrutskie et al., 2006) for near-infrared, and the WISE preliminary data release (Cutri et al., 2012) for mid-infrared. The cross-correlation was performed through the specific Aladin Java tool (Bonnarel et al., 2000). We used a search radius of 5 arcsec to prevent the loss of coincidences due to the XMM-Newton positional uncertainties. We finally cross-matched our sample with the list of stars of Mookerjea et al. (2009).
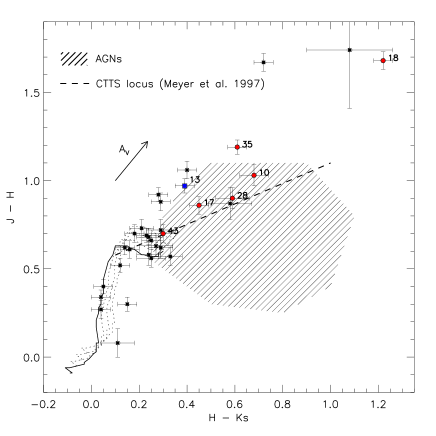
Tables 5 and 6 summarize the photometric data for each one of our sources. We note that 13 out of the 50 sources detected in X-rays have no counterpart in any of the catalogs mentioned above. We considered them as spurious X-ray detections and, therefore, we removed them from the tables. We maintained Src. 23 because it is situated at 11 arcsec from an optical source. We cannot discard this source as a real detection. The remaining sources have a counterpart in DENIS and/or 2MASS, except for source 7 (VLA3 in Mookerjea et al., 2009, see Section 3.1) and Src 12 (only Spitzer photometry). In Fig. 4 we plot the 2MASS color-color diagram for these sources. The main sequence for unabsorbed (dwarf) stars is overplotted as a continuous line. The shaded region in the figure is the locus of the active galactic nuclei (AGN) determined by us using data from Kouzuma & Yamaoka (2010). The position of most of the stars in the color-color diagram indicates the high interstellar extinction in this star-forming region. As in Fig. 3, we identified class II objects with its X-ray source ID number.
We estimated the value of the extinction () for each star, from the 2MASS color-color diagram (Fig. 4). Our results are given in Table 5. They will be discussed and compared with those obtained from SED fitting in Section 3.4.
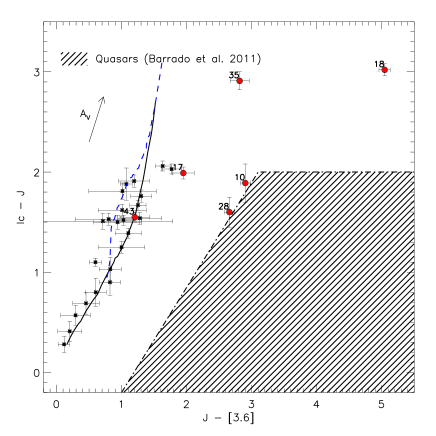
Barrado et al. (2011) showed that the vs [3.6] color-color diagram can be used to reject extragalactic objects from X-ray selected samples, as active galactic nuclei are well separated from stars. Figure 5 shows the same diagram for our 32 sources with a DENIS counterpart. Src 10 and Src 28 are situated close to the boundaries of extragalactic sources, but they have been clearly identified with stars in the optical images (in fact Src 10 is V615 Ori). Only Src 18 and Src 35 may be absorbed quasars, according to the direction of the extinction vector (In Tables 5 and 6 they are identified as possible AGN).
3.3 Age of the NGC 2023 members
It was mentioned in Section 1 that the age of the star-forming region around NGC 2023 is not well known. There are very few works about this issue in the literature (see Meyer et al., 2008, for a review). Alcala et al. (2000) gave a range of ages for the stars belonging to the Orion Molecular Complex, but there is no particular study on each individual region. Ages determined for these stars are in the range 0.5–7.0 Myr.
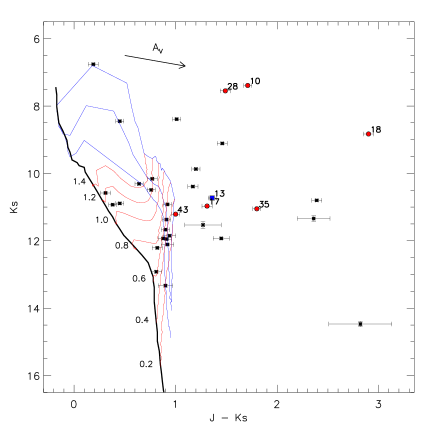
In Fig. 6, we show evolutionary tracks from Baraffe et al. (1998), with an extension to stellar masses over 1.6 M⊙ from Siess et al. (2000), in a 2MASS color-magnitud diagram. We assumed a mean distance of 400 pc for the region. The isochrones are 1, 3 and 7 Myr and the ZAMS. We also plot tracks for masses ranging from 0.2 to 1.4 M⊙. Although there is a concentration of low mass stars around the 7 Myr isochrone, the density of isochrones in that region of the diagram makes difficult to assure this is the age for the cluster. In fact, the most massive stars seem to follow younger isochrones. Therefore, we only may affirm the age of the stars in NGC 2023 is in the approximate range Myr.
3.4 SED fitting
To investigate in more detail the nature of our X-ray sources, we performed SED fitting using the photometric data we compiled for each source (Tables 5 and 6). We took full advantage of the grid of young stellar object radiation transfer models of Robitaille et al. (2007). In the model, we permitted the extinction to vary only from zero to the maximum value given by the 2MASS color-color diagram (Fig. 4). Extinction and distance are the only parameters external to the model.
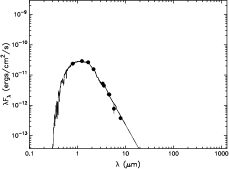
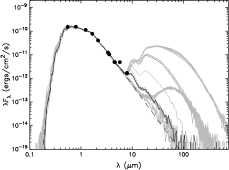
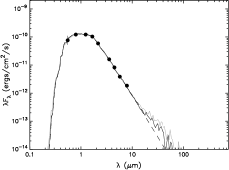
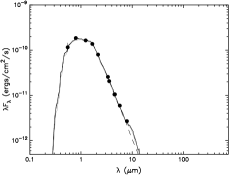
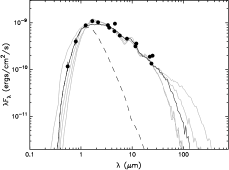
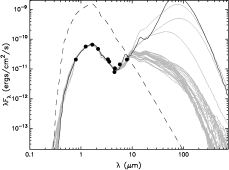
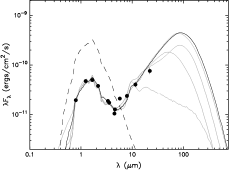
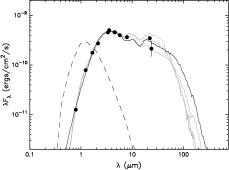
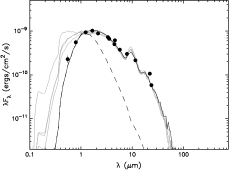
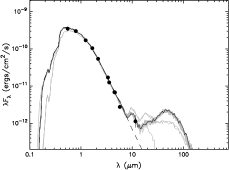
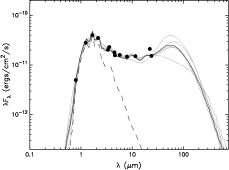
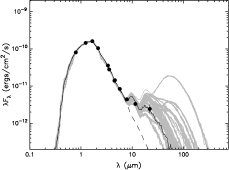
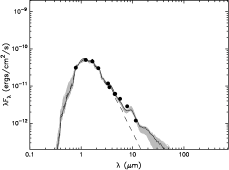
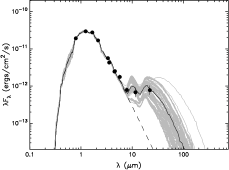
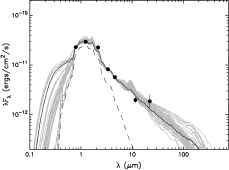
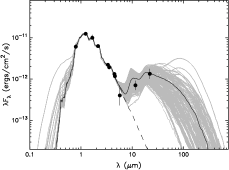
Fitting was performed for the 32 sources in our sample with a DENIS counterpart, to include at least one optical band. This should improve spectral type determination. The blue spectrum of a Class II is usually affected by accretion, as it produces an excess in the blue and ultraviolet spectral range. In Figs. 11 and 12, we show the best fit for those 32 sources. In some cases, there is more than one model that fits well our data. For those cases, we overplot them as grey lines. We have assumed as good models those in which (. In most of those cases, it is not possible to discard any of the fits. We would need some point in the sub-millimeter spectral range (see discussion in Section 5).
The classification into the different infrared classes given in Tables 5 and 6 was performed according to the results of the SED fitting, using the parameter , defined as the slope of the SED beyond 2.2 m (see Robitaille et al., 2007). We used every point of the SED for this purpose, joining WISE and Spitzer data. A review on the classification method can be found in Stahler & Palla (2005). We classified as class III objects those sources for which an absorbed stellar model is enough to fit the observed SED (). Only Src. 14 may show a very thin circumstellar disk (see Fig. 11). Nevertheless, the data fits well also to a stellar photosphere. Class II objects () show an obvious excess at the IRAC bands (see Fig. 12). For those sources, any attempt of fitting a stellar model without disk was unsuccessful. Src. 13 and Src. 17 show characteristics of both class I and II objects. Their SED first decreases between 1.0 and 5.4 m, but then increases again. We have classified them as class I/II objects. Finally, there are several sources that have SEDs typical of class III objects but with an excess at wavelengths longer than 10 m. We have classified them as class II/III objects. Src 42 is situated in the IRAC color-color diagram (Fig. 3) in a position that is usually occupied by stars with transition disks. Our classification into infrared classes using the SED coincides very well with that made first using the IRAC color-color diagram, except for Src 44, the SED of which shows an excess above 10 m but that in the color-color diagram is situated inside the boundaries of class III objects.
Finally, we note that the SED fitting tool of Robitaille et al. (2007) gives an age for each star. This value is determined through isochrone fitting, so its result depends strongly on the model chosen. Robitaille et al. (2007) use the Siess et al. (2000) pre-main sequence evolutionary models that differ slightly from the Baraffe et al. (1998) models. The tool also tends to fit low-age isochrones even when a simple photosphere model is suitable for the observed SED. Therefore, the results of the fitting tool should be used with some caution.
3.5 Extinction, stellar masses, temperatures and luminosities
Table 7 summarizes the results of the SED fitting for the 32 sources with an optical counterpart (see Section 3.4). For sources with more than one good fit, we give only parameters for the best fit. For class II objects, the accretion rate and evolutionary stage are also given. To account for the evolutionary stage of young stellar objects, Robitaille et al. (2007) defined a parameter based on physical properties of the circumstellar envelops, such as mass and accretion rate from it. The authors distinguished between stars with significant infalling envelops (Stage 0/I objects), stars with optically thick disks and thin envelopes (Stage II objects), and stars with optically thin disks (Stage III objects). We have determined this stage for our sources and included it in Table 7. We observe that this classification coincides very well with that given by the IRAC color-color diagram or the slope of the SED. Class I objects present properties of Stage I objects while class II objects are classified as Stage III objects following this method.
We previously mentioned that parameters listed in Table 7 are those given by the model. In fact, the extinction (AV) and the distance are parameters external to the radiative model (see Robitaille et al., 2007). In addition, stellar mass and radius are determined from evolutionary tracks (Robitaille, 2008). In essence, the parameters derived from the model are the temperature and luminosity of the star.
With respect to the interstellar extinction, the values coming from the SED fitting tool are quite similar to those determined with the 2MASS color-color diagram if one takes error bars into account for stars showing low extinction. For the remaining stars, there is a trend of determined using the color-color diagram to be higher than that coming from the SED fitting tool. The median of the ratio between determined with both methods is 1.35, or 1.5 if only stars with are considered. These stars are mainly those for which the extinction determined with both methods do not coincide even when error bars are taken into account.
| ID | Z | a | b | |||||
|---|---|---|---|---|---|---|---|---|
| cm | (keV) | (keV) | (Z⊙) | (d.o.f) | erg cm-2 s-1) | (erg s-1) | ||
| 3 | 0.00 | 0.62 | 1.26 | 0.70 | 0.23 | 1.29 (276) | 3.95 | 29.2 |
| 10 | 0.50 | 2.49 | … | … | 0.33 | 1.29 (140) | 12.20 | 31.3 |
| 17 | 0.22 | 1.24 | … | … | 1.27 (54) | 0.57 | 30.3 | |
| 20 | 0.07 | 0.78 | 1.64 | 2.59 | 0.13 | 0.88 (78) | 2.30 | 30.5 |
| 22 | 0.05 | 0.34 | 1.21 | 1.29 | 0.18 | 0.83 (120) | 3.30 | 30.5 |
| 27 | 0.41 | 18.3 | … | … | 0.51 (10) | 1.38 | 30.0 | |
| 28 | 0.44 | 0.28 | 1.24 | 1.02 | 0.16 | 1.10 (602) | 33.41 | 31.9 |
| 34 | 0.40 | 2.73 | … | … | 1.26 (59) | 6.99 | 30.9 | |
| 36 | 0.24 | 2.14 | … | … | 0.72 (61) | 2.17 | 30.4 | |
| 41 | 0.08 | 2.36 | … | … | 0.15 | 1.18 (271) | 11.53 | 30.6 |
| 50 | 0.22 | 2.00 | … | … | 1.33 (65) | 3.41 | 30.2 |
4 X-ray spectral analysis
In Section 2, we showed that the X-ray observation of the NGC 2023 nebula was affected by high background periods (see Fig. 1). The highly variable background prevented us to perform a study about variability of the detected sources. Therefore, our study was limited to the spectral analysis. The X-ray spectrum of sources with more than approximately 100 net counts was compared (using fitting procedures) to hot plasma models using XSPEC (Arnaud et al., 1996, 2004). The software first load the data previously extracted using specific SAS tools (source and background spectra, response matrix and ancillary file) and then generates the plasma model. Two hot (diffuse) plasma models are available in XSPEC: mekal (Mewe et al., 1985, 1986; Kaastra et al., 1992; Liedahl et al., 1995) and apec (Smith et al., 2001a). To be consistent with our previous works (e.g. López-Santiago & Caballero, 2008; López-Santiago et al., 2010a), we chose the latter for the present analysis. The apec uses the atomic data contained in the Astrophysical Plasma Emission Database (APED; Smith et al., 2001b).
Due to the limitations of our observation in terms of counts – because of the time lost due to the high background periods – we used only or -models for the fits. The results of the spectral fitting are given in Table 3 for those stars with accurate fits. For several stars, the value of the abundance obtained during the fit was unconstrained. In those cases, we fixed the abundance to . Although some authors have used other values in their works (e.g. Stelzer et al., 2004; Robrade & Schmitt et al., 2007; Giardino et al., 2007a), in other stars of this star-forming region we find always a value of very close to 0.2. We used Statistics to obtain the goodness of our fits. Energy channels were then grouped to contain at least 15 counts in each energy bin.
5 Discussion
Spectral fitting was performed for the eleven sources in our sample with at least 500 counts (combining PN and MOS detectors). The results are shown in Table 3.
The position in the color-color diagram of Fig. 5 of the eleven spectroscopically sources studied in this work indicates they are indeed stars. According to that diagram, only Src 18 and Src 35 may be (absorbed) extragalactic sources. General X-ray parameters obtained for these eleven stars are very similar to those observed in stars of the same class in other star-forming regions (e.g. Getman et, 2005; Güdel et al., 2007). Among them, three are classified as Class II from their SEDs (see Tables 5 and 6.). They are Src 10 (V615 Ori), Src 17 and Src 28. Another two stars likely have transition disks (Src 36 and Src 41). The remainder are classified as Class III or main-sequence stars.
Coronal temperatures are consistent with being young T Tauri stars (e.g. Güdel et al., 2007). Only Src 27 shows an extremely high temperature, although it is unconstrained (this is the source with the lowest number of counts we could fit). Unabsorbed X-ray fluxes in the energy band [0.3–8.0] keV were determined for the eleven sources for which a spectral fitting was performed and then transformed to luminosities using the distances obtained during the SED fitting procedure (Table 7). We note that for HD 37805 (Src 3), the distance given by the SED fitting tool is slightly underestimated (Hipparcos distance for HD 37805 is pc). However, this is the only star for which we could find a value for its distance in the literature. Therefore, an interpolation of this result to the remaining stars should not be done. In fact, the distance obtained with this procedure for V615 Ori (Src 10, pc) is consistent with some results found in the literature: there are hints that the Horsehead Nebula is a few parsecs closer to us than Orionis, that is situated at approximately 385 pc (see Caballero & Solano, 2008, and references therein). V615 Ori must be closer than the Horsehead Nebula as it is observed at the base of the nebula, in front of it. Therefore, the use of the distances obtained from the SED fitting tool seems to be a good option, undoubtedly better than using the same distance for all the sources. Observed X-ray luminosities are indicative of the shallowness of this observation. Typical X-ray luminosities of young M dwarfs are in the range erg s-1 (e.g. Preibisch & Feigelson, 2005). In this observation, the completeness limit is erg cm-2 s-1, what corresponds to erg s-1 at a distance of 400 pc. Stelzer et al. (2012) pointed out that there is a trend of a mass dependence of the X-ray emission level throughout the various evolutionary stages of young stellar objects. Comparing the luminosities of class II and class III objects in our sample, we do not find such differences, but our sample is too small to achieve robust results.
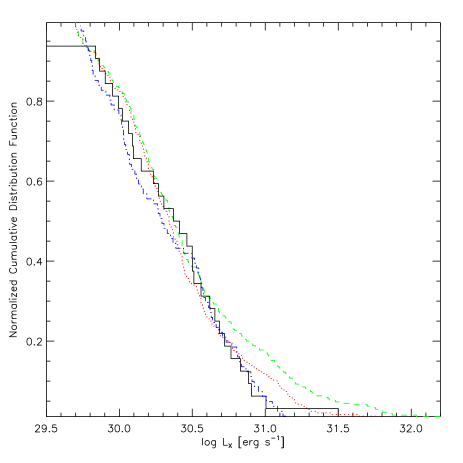
With the aim of comparing general results of our X-ray analysis of NGC 2023 with other star-forming regions, we plotted the X-ray luminosity cumulative distribution function of our sample, the Orion Nebula Cluster and the Taurus Molecular Complex together (see Fig. 7). The data of those regions were taken from Getman et (2005) and Güdel et al. (2007), respectively. For each star-forming region, we plot the whole sample accessible in those works with no distinction between infrared classes. For NGC 2023, we discarded HD 37805 (Src 3), that is likely a field star, and those stars for which we did not fitted a model to their SEDs (Src 7, Src 12, Src 16 and Src 24). For the stars for which a spectral analysis with XSPEC could not be performed, we determined X-ray fluxes from the observed count-rate in the following way. We used the subsample of eleven stars in Table 3 for which X-ray spectral fitting was done to determine a conversion factor between observed count-rate and (absorbed) flux. This conversion factor was determined for each star and each EPIC detector (PN, MOS1 and MOS2) independently. Then, we performed a linear regression to each one of the three datasets. The relationships obtained by us were:
Fluxes determined with these three relationships are compatible. Table 4 gives the flux values determined for our sample from their count-rates. We include in that table the eleven stars of Table 3, for completeness. For them, the values of the fluxes are those determined from the spectral fitting. As for the eleven stars for which we could perform spectral fitting (see above), fluxes were transformed into luminosities using the distances obtained from the SED fitting (Table 7).
The comparison of the X-ray luminosity function of the different star-forming regions was made only in the range of completeness of the XMM-Newton observation of NGC 2023 (). Known non-members of the ONC identified by Getman et (2005) were discarded for this study. From Fig. 7, NGC 2023 seems to be more similar to the Taurus molecular complex. In both cases, there is a lack of stars brighter than erg s-1, while the ONC have stars with X-ray luminosities up to 1031.5-32 erg s-1. This result may be explained as differences in the stellar population in each star-forming region. While the ONC have massive stars, they are not present in Taurus and NGC 2023. We have explored this hypothesis by constructing a new COUP sample with stars less massive than 3 M⊙ (similar to the mass range in NGC 2023). In Fig. 7, this new sample is plotted as a dotted (red) line. The figure suggests that the COUP sample restricted to the same mass range is more similar to NGC 2023 than the sample without mass restriction. We note here that the ages of the Taurus and ONC samples are not equal and that we could not determine robustly the age of NGC 2023. Therefore, this result must be used with caution.
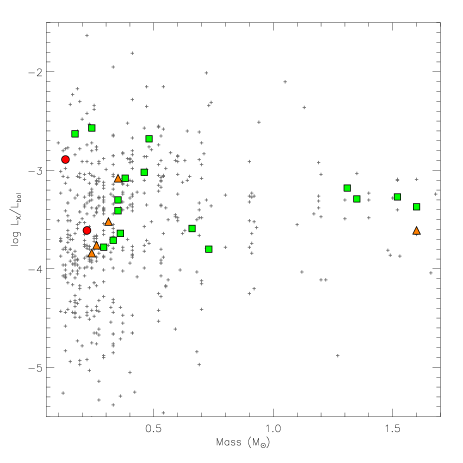
In Fig. 8, we overplot our sample of NGC 2023 sources over the COUP data (Getman et, 2005). For NGC 2023, we used the masses and bolometric luminosities given in Table 7 and X-ray luminosities determined from the distances given in Table 7 and fluxes of Table 4. All the NGC 2023 low-mass stars () are inside the boundaries of the stars of the COUP. Only the more massive stars in our sample (as determined by the SED fitting tool of Robitaille et al., 2007) have very low values of (out of the limits of Fig. 8, see Table 7). There are three types of sources with very low values of in our sample: (1) stars showing large infrared excess, for which the SED fitting tool gives very high luminosities, (2) intermediate-mass pre-main or main-sequence stars (A and F spectral types), and (3) Src. 18, that may be an AGN instead of a star (see Section 3.2 and Fig. 5). The SED fitting procedure derives bolometric luminosities and temperatures directly and then determine masses using evolutionary tracks (see Robitaille, 2008). For stars with large infrared excesses, to obtain a robust value for their luminosity may be difficult since it depends on the accurate determination of the disk (and envelope in some cases) parameters. Therefore, in those stars of our sample, may be overestimated.
For the two stars classified as infrared class III objects (i.e. stars without an accretion disk) their temperature may be also overestimated. Nevertheless, the star HD 37805 (Src. 3) that is one of these two pre-main or main-sequence stars with a very low value of the ratio , it is a known A star (e.g. Mookerjea et al., 2009), already detected in X-rays with ASCA (Yamauchi et al., 2000). Therefore, the presence of a low-mass companion responsible for the X-ray emission cannot be discarded in these three intermediate-mass stars in our sample. The other class III object with low is Src 33 (MIR 83).
6 Summary and conclussions
We have carried out a comprehensive analysis of the X-ray and infrared properties of 36 young stellar objects in the NGC 2023 star-forming region and its surroundings for the first time. The spectral energy distribution (SED) of 90% of this sample (32 out of 36 sources) has been analyzed using the star-disk models of Robitaille et al. (2007). We have identified only two AGN candidate among the 36 X-ray sources. A classification on different infrared classes has been made according to the position of the stars in infrared color-color diagrams and to their SED. The study of the SEDs has allowed us to determine several stellar parameters such as masses, radii and luminosities, and other physical parameters such as extinctions and distances.
The X-ray properties of NGC 2023 have been compared with those of other star-forming regions with different characteristics in terms of stellar population. Although the values of temperature and column density determined for our sample of young stars are similar to those observed in stars of the Orion Nebula Cluster and Taurus, the (X-ray luminosity) cumulative distribution function of members of NGC 2023 is more similar to that of the Taurus molecular complex. A possible explanation is the different stellar populations in each region. While in the ONC there is a number of massive stars, they are not present in Taurus and NGC 2023.
Acknowledgments
M.A.L-G. and J.L-S. acknowledge support by the Spanish Ministerio de Ciencia e Innovación under grant AYA2008-06423-C03-03. J.F.A.C. is researcher of the CONICET and acknowledges support by grant PICT 2007-02177 (SecyT). PGP-G acknowledges support from the Spanish Programa Nacional de Astronomía y Astrofísica under grants AYA2009-10368 and AYA2009-07723-E. We would like to acknowledge the anonymous referee for a fruitful discussion about the results of this work. His/Her comments on the text content have allowed us to notoriously improve this manuscript.
References
- Alcala et al. (2000) Alcalá, J. M., Covino, E., Torres, G., et al. 2000, A&A, 353, 186
- Ali et al (1998) Ali, B., Sellgren, K., Depoy, D. L., et al. 1998, Cool Stars, Stellar Systems, and the Sun, 154, 1663
- Anglada & Rodríguez et al. (2002) Anglada, G., & Rodríguez, L. F. 2000, Rev. Mexicana Astron. Astrofis., 38, 13
- Arnaud et al. (1996) Arnaud, K. 1996, XSPEC: The First Ten Years. In ASP Conf. Ser. 101, eds. George H. Jacoby and Jeannette Barnes, 17
- Arnaud et al. (2004) Arnaud, K. 2004, XSPEC: Progress and Plans. In the American Astronomical Society, HEAD meeting 8, 16.29
- Bally et al. (2000) Bally, J., O’Dell, C. R., & McCaughrean, M. J. 2000, AJ, 119, 2919
- Baraffe et al. (1998) Baraffe, I., Chabrier, G., Allard, F., & Hauschildt, P. H. 1998, A&A, 337, 403
- Barrado et al. (2011) Barrado, D., Stelzer, B., Morales-Calderón, M., et al. 2011, A&A, 526, A21
- Bonnarel et al. (2000) Bonnarel, F., et al. 2000, A&AS, 143, 33
- Bowler et al. (2009) Bowler, B. P., Waller, W. H., Megeath, S. T., Patten, B. M., & Tamura, M. 2009, AJ, 137, 3685
- Caballero & Solano (2008) Caballero, J. A., & Solano, E. 2008, A&A, 485, 931
- Cash et al. (1979) Cash, W. 1979, ApJ, 228, 939
- Cutri et al. (2012) Cutri, R. M., et al. 2012, VizieR Online Data Catalog, 2307, 0
- DENIS Consortium (2005) DENIS Consortium 2005, VizieR Online Data Catalog, 2263, 0
- Droege et al. (2006) Droege, T. F., Richmond, M. W., Sallman, M. P., & Creager, R. P. 2006, PASP, 118, 1666
- Droege et al. (2007) Droege, T., F., Richmond, M., W., & Sallman, M. 2007, VizieR Online Data Catalog, 2271, 0
- Eisner & Carpenter (2003) Eisner, J. A., & Carpenter, J. M. 2003, ApJ, 598, 1341
- Fang et al. (2009) Fang, M., van Boekel, R., Wang, W., Carmona, A., Sicilia-Aguilar, A., & Henning, T. 2009, A&A, 504, 461
- Genzel & Stutzki et al. (1989) Genzel, R., & Stutzki, J. 1989, ARA&A, 27, 41
- Getman et (2005) Getman, K. V., Flaccomio, E., Broos, P. S., et al. 2005, ApJS, 160, 319
- Giardino et al. (2007a) Giardino, G., Favata, F., Micela, G., Sciortino, S., & Winston, E. 2007a, A&A, 463, 275
- Giardino et al. (2007b) Giardino, G., Favata, F., Pillitteri, I., et al. 2007b, A&A, 475, 891
- Güdel et al. (2007) Güdel, M., Briggs, K. R., Arzner, K., et al. 2007, A&A, 468, 353
- Hartman & Burkert et al. (2007) Hartmann, L., & Burkert, A. 2007,ApJ, 654, 988
- Haisch et al. (2000) Haisch, K. E., Jr., Lada, E. A., & Lada, C. J. 2000, AJ, 120, 1396
- Holland et al. (1999) Holland, W. S., et al. 1999, MNRAS, 303, 659
- Ingleby et al. (2009) Ingleby, L., et al. 2009, ApJ, 703, L137
- Kaastra et al. (1992) Kaastra, J.S. 1992, An X-Ray Spectral Code for Optically Thin Plasmas (Internal SRON-Leiden Report, updated version 2.0)
- Kouzuma & Yamaoka (2010) Kouzuma, S., & Yamaoka, H. 2010, A&A, 509, A64
- Liedahl et al. (1995) Liedahl, D. A., Osterheld, A. L., & Goldstein, W. H. 1995, ApJ, 438, L115
- López-Santiago & Caballero (2008) López-Santiago, J., & Caballero, J. A. 2008, A&A, 491, 961
- López-Santiago et al. (2010a) López-Santiago, J., Albacete Colombo, J. F., & López-García, M. A. 2010, A&A, 524, A97
- Malin et al. (1987) Malin, D. F., Ogura, K., & Walsh, J. R. 1987, MNRAS, 227, 361
- Mewe et al. (1985) Mewe, R., Gronenschild, E. H. B. M., & van den Oord, G. H. J. 1985, A&AS, 62, 197
- Mewe et al. (1986) Mewe, R., Lemen, J. R., & van den Oord, G. H. J. 1986, A&AS, 65, 511
- Meyer et al. (1997) Meyer, M. R., Calvet, N., & Hillenbrand, L. A. 1997, AJ, 114, 288
- Meyer et al. (2008) Meyer, M. R., Flaherty, K., Levine, J. L., et al. 2008, Handbook of Star Forming Regions, Volume I, 662
- Mookerjea et al. (2009) Mookerjea, B., Sandell, G., Jarrett, T. H., & McMullin, J. P. 2009, A&A, 507, 1485
- Penz et al. (2008) Penz, T., Micela, G., & Lammer, H. 2007, A&A, 477, 309
- Pérez-González et al. (2008) Pérez-González, P. G., Rieke, G. H., Villar, V., et al. 2008, ApJ, 675, 234
- Pickles et al. (1998) Pickles, A. J. 1998, PAPS, 110, 863
- Pillitteri et al. (2010) Pillitteri, I., Sciortino, S., Flaccomio, E., et al. 2010, A&A, 519, A34
- Pillitteri et al. (2010) Pillitteri, I., Wolk, S. J., Allen, L., Megeath, S. T., Gutermuth, R. A., & Gutermuth 2010, IAU Symposium, 266, 509
- Pizzolato et al. (2003) Pizzolato, N., Maggio, A., Micela, G., Sciortino, S., & Ventura, P. 2003, A&A, 397, 147
- Prisinzano et al. (2008) Prisinzano, L., Micela, G., Flaccomio, E., et al. 2008, ApJ, 677, 401
- Preibisch & Feigelson (2005) Preibisch, T., & Feigelson, E. D. 2005, ApJS, 160, 390
- Preibisch et al. (2005) Preibisch, T., Kim, Y.-C., Favata, F., et al. 2005, ApJS, 160, 401
- Reipurth et al. (2004) Reipurth, B., Rodríguez, L. F., Anglada, G., & Bally, J. 2004, AJj, 127, 1736
- Robitaille et al. (2006) Robitaille, T. P., Whitney, B. A., Indebetouw, R., Wood, K., & Denzmore, P. 2006, ApJS, 167, 256
- Robitaille et al. (2007) Robitaille, T. P., Whitney, B. A., Indebetouw, R., & Wood, K. 2007, ApJS, 169, 328
- Robitaille (2008) Robitaille, T. P. 2008, Massive Star Formation: Observations Confront Theory, 387, 290
- Robrade & Schmitt et al. (2007) Robrade, J., & Schmitt, J. H. M. M. 2007, A&A, 461, 669
- Sandell et al. (1999) Sandell, G., et al. 1999 ApJ, 519, 236
- Scally & Clarke et al. (2001) Scally, A., & Clarke, C. 2001, MNRAS, 325, 449
- Sciortino et al. (2008) Sciortino, S. 2008, Astronomische Nachrichten, 329, 214
- Siess et al. (2000) Siess, L., Dufour, E., & Forestini, M. 2000, A&A, 358, 593
- Skinner et al. (2003) Skinner, S., Gagné, M., & Belzer, E. 2003, ApJ, 598, 375
- Skrutskie et al. (2006) Skrutskie, M. F., et al. 2006, AJ, 131, 1163
- Smith et al. (2001a) Smith, R. K., Brickhouse, N. S., Liedahl, D. A., & Raymond, J. C. 2001a, ApJ, 556, L91
- Smith et al. (2001b) Smith, R. K., Brickhouse, N. S., Liedahl, D. A., & Raymond, J. C. 2001b, ASP Conf. Ser. 247: Spectroscopic Challenges of Photoionized Plasmas, 247, 161
- Stahler & Palla (2005) Stahler, S. W., & Palla, F. 2005, The Formation of Stars, by Steven W. Stahler, Francesco Palla, pp. 865. ISBN 3-527-40559-3. Wiley-VCH , January 2005.
- Stelzer et al. (2004) Stelzer, B., Micela, G., & Neuhäuser, R. 2004, A&A, 423, 1029
- Stelzer et al. (2012) Stelzer, B., Preibisch, T., Alexander, F., et al. 2012, A&A, 537, A135
- Stern et al. (2005) Stern, D., Eisenhardt, P., Gorjian, V., et al. 2005, APJ, 631, 163
- Telleschi et al. (2007) Telleschi, A., Güdel, M., Briggs, K. R., Audard, M., & Palla, F. 2007, A&A, 468, 425
- Testa et al. (2008) Testa, P., Drake, J. J., Ercolano, B., et al. 2008, ApJL, 675, L97
- Tsujimoto et al. (2005) Tsujimoto, M., Feigelson, E. D., Grosso, N., et al. 2005, ApJS, 160, 503
- Wall & Jenkins et al. (2003) Wall, J. V., & Jenkins, C. R. 2003, Princeton Series in Astrophysics
- Wilson et al. (2011) Wilson, T. L., Muders, D., Dumke, M., Henkel, C., & Kawamura, J. H. 2011, ApJ, 728, 61
- Wolk et al. (2010a) Wolk, S. J., Pillitteri, I., Megeath, S. T., Allen, L., & consortium, S. 2010, Bulletin of the American Astronomical Society, 42, 683
- Yamauchi et al. (2000) Yamauchi, S., Kamimura, R., & Koyama, K. 2000, PASJ, 52, 1087
Appendix A Tables and Figures
| Src ID | rate [pn] | rate [mos1] | rate [mos2] | Obs. fluxa | HR1 | HR2 | Remarksb | ||
|---|---|---|---|---|---|---|---|---|---|
| (deg) | (deg) | (ks-1) | (ks-1) | (ks-1) | ( erg cm-2 s-1) | ||||
| 1 | 05 40 54.2 | -02 19 04.8 | … | 8 1 | 10 2 | 0.79 0.44 | -0.55 | -0.49 | |
| 3 | 05 41 02.6 | -02 18 18.0 | 310 8 | 67 5 | 87 4 | 3.95 0.10 | -0.72 | -0.80 | [YKK2000] A5 |
| 4 | 05 41 03.8 | -02 21 39.6 | 12 2 | … | 6 1 | 0.97 0.42 | -0.56 | -0.31 | |
| 5 | 05 41 06.7 | -02 23 52.8 | 13 2 | 5 1 | 4 1 | 0.98 0.42 | -0.71 | -1.00 | |
| 6 | 05 41 11.5 | -02 27 25.2 | … | 2 1 | 1 1 | 0.22 0.44 | … | … | |
| 7 | 05 41 21.6 | -02 11 09.6 | 8 1 | … | … | 0.93 0.41 | -0.53 | -0.15 | [YKK2000] A6 |
| 10 | 05 41 24.7 | -02 22 37.2 | 203 6 | 79 4 | 77 3 | 5.84 1.28 | 0.24 | -0.49 | [YKK2000] A7 |
| 12 | 05 41 25.7 | -02 23 06.0 | 3 1 | … | … | 0.87 0.41 | -0.45 | -0.34 | |
| 13 | 05 41 28.3 | -02 13 58.8 | 4 1 | … | … | 0.88 0.41 | -0.70 | -1.00 | |
| 14 | 05 41 28.3 | -02 19 44.4 | 3 1 | … | … | 0.87 0.41 | -0.78 | -1.00 | |
| 15 | 05 41 31.9 | -02 10 19.2 | 5 1 | … | … | 0.89 0.41 | -0.73 | -1.00 | |
| 16 | 05 41 32.6 | -02 13 19.2 | 3 1 | … | … | 0.87 0.41 | -1.00 | -0.08 | |
| 17 | 05 41 34.8 | -02 17 24.0 | 17 2 | 11 1 | 9 1 | 1.03 0.15 | -0.20 | -0.89 | |
| 18 | 05 41 36.5 | -02 16 48.0 | … | 1 1 | 1 1 | 0.22 0.44 | -0.63 | -0.42 | |
| 20 | 05 41 43.0 | -02 10 26.4 | 100 4 | 26 2 | 27 2 | 1.81 0.22 | -0.50 | -0.70 | [YKK2000] A9 |
| 21 | 05 41 43.2 | -02 17 38.4 | 2 1 | … | … | 0.86 0.41 | -0.95 | -1.00 | |
| 22 | 05 41 43.2 | -02 03 54.0 | 161 7 | 51 4 | 48 4 | 2.34 2.30 | -0.72 | -0.91 | [YKK2000] A10 |
| 23 | 05 41 43.7 | -02 10 22.8 | … | 4 1 | … | 0.72 0.39 | -0.79 | -1.00 | opt. source at |
| 24 | 05 41 44.2 | -02 16 08.4 | 3 1 | … | … | 0.87 0.41 | -0.95 | -0.03 | |
| 27 | 05 41 45.6 | -02 24 18.0 | 14 2 | 6 1 | 5 1 | 1.29 0.38 | 0.57 | -0.34 | |
| 28 | 05 41 47.0 | -02 16 37.2 | 477 7 | 166 4 | 159 4 | 8.32 0.87 | -0.18 | -0.68 | [YKK2000] A11 |
| 31 | 05 41 48.2 | -02 10 40.8 | 7 1 | 2 1 | … | 0.92 0.41 | -0.79 | -0.66 | |
| 33 | 05 41 51.1 | -02 29 52.8 | … | 15 2 | 10 2 | 0.73 0.44 | -0.01 | -0.70 | |
| 34 | 05 41 52.6 | -02 03 50.4 | 131 6 | 50 4 | 35 4 | 4.10 1.01 | 0.30 | -0.61 | [YKK2000] A12 |
| 35 | 05 41 55.7 | -02 23 42.0 | 14 2 | 3 1 | … | 1.26 0.47 | 0.16 | -0.77 | |
| 36 | 05 42 09.1 | -02 08 20.4 | 62 6 | 16 2 | 20 2 | 1.48 0.99 | -0.05 | -0.55 | |
| 38 | 05 42 10.1 | -02 10 22.8 | 7 1 | … | … | 0.92 0.41 | -0.91 | -1.00 | |
| 41 | 05 42 12.5 | -02 05 09.6 | 517 13 | … | 145 7 | 9.90 0.93 | -0.36 | -0.53 | |
| 42 | 05 42 16.1 | -02 06 46.8 | 72 5 | 27 3 | 18 2 | 1.57 0.74 | -0.71 | -0.61 | [YKK2000] A13 |
| 43 | 05 42 16.8 | -02 06 39.6 | 12 3 | 6 2 | … | 0.97 0.42 | -0.89 | -0.43 | [YKK2000] A13 |
| 44 | 05 42 18.5 | -02 19 44.4 | 4 1 | … | … | 0.88 0.41 | -0.95 | -0.58 | |
| 45 | 05 42 19.7 | -02 15 32.4 | … | 1 1 | 3 1 | 0.34 0.44 | … | … | |
| 46 | 05 42 20.2 | -02 11 27.6 | 9 2 | 3 1 | … | 0.94 0.41 | -0.46 | -1.00 | |
| 47 | 05 42 21.1 | -02 15 18.0 | 96 4 | 34 3 | 34 2 | 1.77 0.91 | -0.06 | -0.68 | [YKK2000] A14? |
| 48 | 05 42 21.4 | -02 07 44.4 | 50 4 | 20 3 | 19 2 | 1.36 0.59 | -0.38 | -0.92 | |
| 49 | 05 42 33.8 | -02 09 46.8 | 9 2 | … | … | 0.94 0.41 | … | … | |
| 50 | 05 42 36.7 | -02 20 38.4 | 96 4 | 25 3 | 35 3 | 1.78 1.58 | -0.08 | -0.60 |
| Src. ID | Name | V | I | J | H | Ks | AV | IR-Class† and |
|---|---|---|---|---|---|---|---|---|
| (mag) | (mag) | (mag) | (mag) | (mag) | (mag) | other remarks | ||
| 1 | … | 14.06 0.03 | 12.81 0.03 | 12.11 0.02 | 11.93 0.02 | 1.0 0.5 | III | |
| 3 | HD 37805/MIR 31 | 7.53 0.05 | 7.23 0.05 | 6.95 0.03 | 6.87 0.05 | 6.76 0.02 | 0.0 0.5 | III |
| 4 | … | 14.48 0.03 | 12.86 0.03 | 12.24 0.03 | 11.95 0.02 | 0.7 0.7 | III | |
| 5 | … | 14.56 0.03 | 13.03 0.03 | 12.45 0.03 | 12.21 0.02 | 0.0 0.5 | III | |
| 6 | … | 17.31 0.11 | 13.70 0.08 | … | 11.34 0.08 | … | III | |
| 7 | VLA 3/MIR 46 | … | … | … | … | … | … | I |
| 10 | V615 Ori/MIR 52 | 13.11 0.24 | 10.99 0.17 | 9.10 0.02 | 8.07 0.04 | 7.39 0.02 | 12.2 3.5 | II |
| 12 | … | … | … | … | … | … | - | |
| 13 | … | 14.21 0.03 | 12.09 0.02 | 11.12 0.02 | 10.73 0.02 | 6.6 1.5 | I/II | |
| 14 | MIR 55 | 12.83 0.25 | 12.03 0.09 | 11.34 0.02 | 10.94 0.02 | 10.89 0.02 | 0.0 0.6 | III |
| 15 | … | 15.74 0.05 | 14.23 0.03 | 13.60 0.03 | 13.33 0.04 | 0.7 0.5 | III | |
| 16 | NIR 17 | … | … | 17.29 0.23 | 15.55 0.10 | 14.47 0.08 | 23.8 6.0 | III? |
| 17 | MIR 60 | … | 14.27 0.03 | 12.28 0.03 | 11.42 0.02 | 10.97 0.02 | 1.0 0.5 | I/II |
| 18 | MIR 62 | … | 14.75 0.03 | 11.73 0.03 | 10.05 0.02 | 8.83 0.02 | 8.5 1.5 | II (AGN?) |
| 20 | MIR 71 | 13.58 0.39 | 12.28 0.10 | 11.25 0.02 | 10.63 0.02 | 10.49 0.02 | 0.0 0.5 | III |
| 21 | WB 57/NIR 24 | … | 14.57 0.03 | 13.03 0.03 | 12.35 0.02 | 12.11 0.03 | 1.0 0.3 | III |
| 22 | 13.13 0.24 | 11.83 0.10 | 10.93 0.03 | 10.32 0.02 | 10.16 0.02 | 0.0 0.8 | III | |
| 23 | … | … | … | … | … | … | opt. source at | |
| 24 | W 218/NIR 25 | … | … | 13.38 0.04 | 12.51 0.05 | 11.93 0.04 | … | not reliable‡ |
| 27 | MIR 76 | … | 16.90 0.11 | 13.19 0.03 | 11.52 0.02 | 10.80 0.02 | 14.8 1.5 | III |
| 28 | MIR 80 | 12.39 0.20 | 10.64 0.13 | 9.04 0.02 | 8.14 0.04 | 7.55 0.03 | 1.0 1.0 | II |
| 31 | MIR 81 | 11.93 0.14 | 11.30 0.07 | 10.89 0.03 | 10.62 0.02 | 10.58 0.02 | 0.5 0.5 | II/III |
| 33 | MIR 83 | … | 10.00 0.22 | 8.90 0.02 | 8.60 0.02 | 8.45 0.02 | 2.9 0.5 | III |
| 34 | V621 Ori | … | 12.63 0.02 | 10.57 0.03 | 9.51 0.02 | 9.11 0.02 | 7.5 0.7 | III |
| 35 | MIR 86 | … | 15.76 0.07 | 12.85 0.02 | 11.66 0.02 | 11.05 0.02 | 5.8 0.5 | II (AGN?) |
| 36 | … | 12.74 0.03 | 11.07 0.02 | 10.15 0.02 | 9.87 0.02 | 1.7 0.5 | II/III | |
| 38 | 12.60 0.20 | 11.88 0.08 | 11.31 0.02 | 10.97 0.02 | 10.93 0.02 | 0.0 1.5 | III | |
| 41 | … | 13.36 0.03 | 11.84 0.02 | 11.15 0.02 | 10.92 0.02 | 1.0 0.5 | II/III | |
| 42 | V622 Ori | 12.96 0.23 | 11.75 0.12 | 10.95 0.02 | 10.43 0.02 | 10.31 0.02 | 1.5 2.0 | III |
| 43 | … | 13.76 0.03 | 12.21 0.02 | 11.51 0.03 | 11.21 0.02 | 0.0 1.5 | II/III | |
| 44 | … | 14.29 0.04 | 12.79 0.03 | 12.06 0.02 | 11.85 0.03 | 1.5 0.7 | II/III | |
| 45 | V623 Ori | … | 14.10 0.04 | 12.80 0.08 | … | 11.53 0.10 | … | II/III |
| 46 | … | 15.54 0.06 | 13.73 0.02 | 13.17 0.03 | 12.92 0.03 | 0.5 0.6 | II | |
| 47 | 13.03 0.18 | 11.28 0.14 | 9.40 0.02 | 8.68 0.04 | 8.39 0.02 | 0.5 0.5 | III | |
| 48 | … | 13.67 0.03 | 12.28 0.02 | 11.62 0.02 | 11.37 0.02 | 1.0 0.6 | III | |
| 49 | … | 14.48 0.04 | 12.57 0.02 | 12.00 0.03 | 11.67 0.02 | 0.0 0.7 | III | |
| 50 | … | 13.32 0.03 | 11.56 0.03 | 10.68 0.02 | 10.39 0.02 | 4.5 1.0 | III |
| Src. ID | Name | F (mJy) | F (mJy) | F (mJy) | F (mJy) | F (mJy) | F(mJy) | F (mJy) | F (mJy) | F (mJy) | IR class†/Remarks |
|---|---|---|---|---|---|---|---|---|---|---|---|
| 1 | 5.9 0.4 | 5.3 0.3 | 3.5 0.3 | 3.5 0.3 | 1.6 0.6 | 1.0 0.1 | … | … | … | III | |
| 3 | HD 37805/MIR 31 | … | 518.2 5.2 | 336.5 3.5 | … | 219.7 2.5 | 149.8 2.0 | … | … | 55.4 0.2 | III |
| 4 | 5.5 0.4 | 5.1 0.3 | 4.6 0.3 | 3.8 0.3 | … | … | … | … | … | III | |
| 5 | … | 3.6 0.3 | 3.1 0.3 | … | … | … | … | … | … | III | |
| 6 | 13.1 0.5 | … | 8.2 0.3 | … | … | … | … | … | … | III | |
| 7 | VLA 3/MIR 46 | … | 3.0 0.2 | 4.6 0.3 | … | 6.5 0.5 | 13.6 0.6 | … | … | 23.4 0.2 | I |
| 10 | V615 Ori/MIR 52 | 998.9 36.3 | 931.9 9.0 | 995.2 9.6 | 1468.9 48.3 | 1020.1 9.9 | 1207.5 11.7 | 1215.3 32.9 | 1396.89 55.5 | 1067.0 0.5 | II |
| 12 | … | 0.1 0.2 | 0.7 0.3 | … | 2.2 0.7 | 6.1 1.0 | … | … | … | - | |
| 13 | 23.6 1.3 | 20.9 0.5 | 11.8 0.4 | 16.1 1.2 | 27.3 1.0 | … | … | … | .. | I/II | |
| 14 | MIR 55 | 14.0 0.4 | 12.4 0.4 | 7.4 0.3 | 7.5 0.2 | 9.3 0.6 | 4.5 0.4 | … | … | … | III |
| 15 | 1.5 0.1 | 1.1 0.2 | 1.3 0.2 | 1.0 0.1 | … | … | … | … | … | III | |
| 16 | NIR 17 | … | … | … | … | … | … | … | … | … | III? |
| 17 | MIR 60 | 21.1 0.8 | 20.7 0.5 | 15.8 0.5 | 19.59 0.7 | 40.4 2.1 | 62.5 2.4 | 156.1 18.4 | 559.7 79.3 | … | I/II |
| 18 | MIR 62 | 508.1 21.9 | 595.6 6.0 | 686.7 6.8 | 700.5 20.8 | 764.1 10.0 | 957.6 21.8 | … | 2560.7 162.5 | 1063.0 1.0 | II (AGN?) |
| 20 | MIR 71 | … | 19.0 0.5 | 12.4 0.4 | … | 7.4 0.6 | 4.9 0.6 | … | … | … | III |
| 21 | WB 57/NIR 24 | … | 5.6 0.3 | 3.0 0.3 | … | … | … | … | … | … | III |
| 22 | 28.7 0.7 | 25.4 0.6 | … | 16.24 0.4 | 11.6 0.6 | … | … | … | … | III | |
| 23 | … | … | … | … | … | … | … | … | … | opt. source at | |
| 24 | W 218/NIR 25 | … | 295.4 3.2 | 501.3 5.1 | … | 706.4 7.3 | 1161.2 12.6 | … | … | … | not reliable‡ |
| 27 | MIR 76 | 19.7 0.5 | 20.3 0.5 | 13.9 0.4 | 14.7 0.4 | 13.2 0.7 | 6.0 0.3 | … | … | … | III |
| 28 | MIR 80 | 811.2 30.8 | 785.9 7.7 | 755.0 7.4 | 944.0 27.2 | 719.1 7.2 | 789.3 8.7 | 827.8 21.1 | 785.5 33.2 | 458.7 0.3 | II |
| 31 | MIR 81 | 19.1 0.5 | 14.9 0.4 | 10.3 0.4 | 10.37 0.3 | 5.3 0.6 | … | 4.3 1.6 | … | … | II/III |
| 33 | MIR 83 | 160.5 4.3 | 134.1 1.7 | 89.7 1.2 | 91.1 2.3 | 65.9 1.2 | 36.0 0.7 | 11.6 1.5 | … | 24.4 0.2 | III |
| 34 | V621 Ori | 83.8 2.2 | 74.7 1.1 | … | 50.8 1.3 | 38.2 0.8 | … | 12.4 0.5 | … | … | III |
| 35 | MIR 86 | 22.6 0.5 | 27.2 0.6 | 27.1 0.6 | 24.1 0.6 | 30.5 0.8 | 38.9 0.8 | 58.3 2.2 | 154.9 9.6 | … | II (AGN?) |
| 36 | 39.8 1.1 | 33.2 0.6 | 21.0 0.5 | 22.1 0.5 | 16.1 0.6 | 11.6 0.5 | 12.8 1.0 | 17.9 4.5 | … | II/III | |
| 38 | 13.9 0.4 | 11.0 0.4 | 7.8 0.3 | 7.6 0.2 | 8.1 0.6 | 3.5 0.3 | … | … | … | III | |
| 41 | 15.4 0.4 | 13.3 0.4 | … | 9.4 0.2 | 6.9 0.7 | … | 3.4 0.6 | … | … | II/III | |
| 42 | V622 Ori | 24.5 0.7 | 20.4 0.5 | 13.0 0.4 | 13.4 0.3 | 6.3 0.6 | 6.8 0.3 | 4.8 0.9 | … | .. | III |
| 43 | 13.2 0.4 | 11.1 0.4 | 9.2 0.4 | 9.6 0.2 | 8.7 0.6 | 7.5 0.4 | 4.6 0.1 | … | … | II/III | |
| 44 | 6.3 0.2 | 5.1 0.3 | 3.7 0.3 | 3.9 0.1 | 3.4 0.5 | 2.1 0.3 | 2.6 0.8 | 5.7 1.6 | … | II/III | |
| 45 | V623 Ori | 9.1 0.2 | … | … | 8.8 0.2 | … | … | 7.6 0.9 | 13.7 4.2 | … | II/III |
| 46 | 2.5 0.1 | 2.3 0.2 | 2.0 0.2 | 1.8 0.1 | 0.9 0.5 | … | 2.8 0.7 | 9.9 2.7 | … | II | |
| 47 | 149.9 4.0 | 131.1 1.6 | 79.7 1.1 | 85.4 2.1 | 61.0 1.1 | 35.6 0.7 | 19.8 1.1 | 9.6 3.2 | … | III | |
| 48 | 8.8 0.2 | 9.5 0.3 | 6.0 0.3 | 5.6 0.2 | 3.1 0.6 | … | … | … | … | III | |
| 49 | 7.4 0.2 | 7.9 0.3 | 5.3 0.3 | 5.1 0.1 | 3.0 0.5 | 1.8 0.3 | … | … | … | III | |
| 50 | 24.8 0.7 | 22.1 0.5 | 15.3 0.5 | 14.6 0.4 | 11.9 0.6 | 5.3 0.4 | … | … | … | III |
| Src. ID | Name | AV | Distance | Stagea | IR Classb | ||||||
|---|---|---|---|---|---|---|---|---|---|---|---|
| (mag) | (pc) | (M⊙) | (R⊙) | (K) | (L⊙) | (M) | |||||
| 1 | 0.05 | 398 | 0.48 | 1.02 | 3735 | 0.19 | -2.68 | … | … | III | |
| 3 | HD 37805/MIR 31 | 0.10 | 56 | 1.45 | 1.77 | 7500 | 8.53 | -13.02 | … | … | III |
| 4 | 1.11 | 299 | 0.35 | 0.77 | 3550 | 0.09 | -3.41 | … | … | III | |
| 5 | 0.25 | 398 | 0.38 | 0.52 | 3650 | 0.01 | -3.08 | … | … | III | |
| 6 | 8.81 | 630 | 0.66 | 0.76 | 4672 | 0.27 | -3.59 | … | … | III | |
| 10 | V615 Ori/ MIR 52 | 5.19 | 371 | 2.96 | 4.39 | 7902 | 67.4 | -69.89 | III | II | |
| 13 | 1.90 | 500 | 1.09 | 10.14 | 4037 | 24.6 | -27.52 | I | I/II | ||
| 14 | MIR 55 | 0.00 | 575 | 1.60 | 1.88 | 5084 | 2.11 | -3.37 | … | … | III |
| 15 | 0.24 | 479 | 0.29 | 0.76 | 3399 | 0.07 | -3.78 | … | … | III | |
| 17 | MIR 60 | 1.19 | 575 | 0.48 | 5.40 | 3692 | 4.87 | -8.36 | I | I/II | |
| 18 | MIR 62 | 5.33 | 457 | 3.42 | 2.63 | 11725 | 118 | -121.6 | III | II | |
| 20 | MIR 71 | 0.76 | 347 | 1.31 | 1.46 | 4809 | 1.02 | -3.18 | … | … | III |
| 21 | NIR 24 | 0.42 | 245 | 0.24 | 0.72 | 3366 | 0.06 | -2.57 | … | … | III |
| 22 | 0.34 | 288 | 1.35 | 1.52 | 4886 | 1.18 | -3.29 | … | … | III | |
| 27 | MIR 76 | 7.65 | 275 | 0.35 | 1.92 | 3500 | 0.63 | -3.30 | … | … | III |
| 28 | MIR 80 | 3.11 | 436 | 2.96 | 4.39 | 7902 | 67.4 | -69.09 | III | II | |
| 31 | MIR 81 | 0.88 | 616 | 1.85 | 1.53 | 7978 | 9.32 | -12.03 | III | II/III | |
| 33 | MIR 83 | 2.15 | 280 | 1.93 | 2.78 | 6835 | 15.1 | -4.92 | … | … | III |
| 34 | V621 Ori | 4.30 | 309 | 2.05 | 2.96 | 4828 | 4.27 | -3.54 | … | … | III |
| 35 | MIR 86 | 3.87 | 550 | 0.22 | 2.86 | 3119 | 0.93 | -3.61 | I | II | |
| 36 | 2.88 | 309 | 1.60 | 1.91 | 4847 | 1.82 | -3.61 | III | II/III | ||
| 38 | 0.07 | 199 | 0.33 | 0.47 | 3500 | 0.01 | -3.71 | … | … | III | |
| 41 | 0.55 | 166 | 0.35 | 0.77 | 3567 | 0.09 | -3.08 | III | II/III | ||
| 42 | V622 Ori | 0.11 | 407 | 1.52 | 1.83 | 4759 | 1.54 | -3.27 | III | III | |
| 43 | 0.37 | 182 | 0.24 | 0.82 | 3343 | 0.08 | -3.84 | III | II/III | ||
| 44 | 0.51 | 257 | 0.31 | 0.29 | 3556 | 0.02 | -3.52 | III | II/III | ||
| 45 | V623 Ori | 0.13 | 309 | 0.26 | 0.27 | 3401 | 0.01 | -3.76 | III | II/III | |
| 46 | 0.07 | 500 | 0.13 | 0.15 | 3052 | 0.002 | -2.89 | III | II | ||
| 47 | 1.49 | 148 | 0.73 | 0.61 | 4331 | 0.13 | -3.80 | III | III | ||
| 48 | 0.09 | 275 | 0.36 | 1.00 | 3548 | 1.43 | -3.64 | … | … | III | |
| 49 | 0.29 | 398 | 0.17 | 0.16 | 3042 | 0.20 | -2.63 | … | … | III | |
| 50 | 1.37 | 190 | 0.46 | 1.11 | 3706 | 0.21 | -3.02 | … | … | III |