The explosion energy of early stellar populations: The Fe-peak element ratios in low metallicity damped Ly systems††thanks: Based on observations collected at the European Organisation for Astronomical Research in the Southern Hemisphere, Chile [Proposals 67.A-0078(A), 69.A-0613(A), 083.A-0042(A), and 085.A-0109(A)], and at the W.M. Keck Observatory which is operated as a scientific partnership among the California Institute of Technology, the University of California and the National Aeronautics and Space Administration. The Observatory was made possible by the generous financial support of the W.M. Keck Foundation. Keck telescope time was partially granted by NOAO, through the Telescope System Instrumentation Program (TSIP). TSIP is funded by NSF.
Abstract
The relative abundances of the Fe-peak elements (Ti–Zn) at the lowest metallicities are intimately linked to the physics of core-collapse supernova explosions. With a sample of 25 very metal-poor damped Ly systems, we investigate the trends of the Fe-peak element ratios with metallicity. For nine of the 25 DLAs, a direct measurement (or useful upper limit) of one or more of the Ti,Cr,Co,Ni,Zn/Fe abundance ratios could be determined from detected absorption lines. For the remaining systems (without detections), we devised a new form of spectral stacking to estimate the typical Fe-peak element ratios of the DLA population in this metallicity regime. We compare these data to analogous measurements in metal-poor stars of the Galactic halo and to detailed calculations of explosive nucleosynthesis in metal-free stars. We conclude that most of the DLAs in our sample were enriched by stars that released an energy of erg when they exploded as core-collapse supernovae. Finally, we discuss the exciting prospect of measuring Fe-peak element ratios in damped Ly systems with Fe/H of solar when 30-m class telescopes become available. Only then will we be able to pin down the energy that was released by the supernovae of the first stars.
keywords:
galaxies: abundances galaxies: evolution quasars: absorption lines supernovae: general1 Introduction
The physical mechanism that drives a core-collapse supernova (CCSN) explosion is a challenging mystery that remains unsolved. However, it has been widely recognised for some time that the relative abundances of the Fe-peak elements (Ti–Zn), which predominantly originate from explosive nucleosynthesis (see e.g. Woosley & Weaver 1995), can provide unique insights into the inner workings of a massive star in its death throes (Umeda & Nomoto, 2002). In particular, the ratios of the Fe-peak element yields depend sensitively on the progenitor mass, the explosion energy, and the amount of material that falls back onto the remnant (i.e. the mass-cut). The uncertain physics of the explosion mechanism forces model nucleosynthesis calculations to parameterise the explosion. There are two favoured prescriptions to define the central engine of the explosion: the first mechanism involves depositing momentum at a given mass coordinate (Woosley & Weaver 1995; Chieffi & Limongi 2004; Heger & Woosley 2010), whereas the second is a deposition of thermal energy (Nakamura et al., 2001). Both prescriptions appear to give consistent yields for the lighter -elements, although they produce quite different abundances of the Fe-peak elements (Aufderheide, Baron, & Thielemann, 1991). This is not surprising, given that the Fe-peak elements are intimately linked to the details of the explosion.
It is reassuring that one of these prescriptions (momentum deposition) is able to do a remarkably good job at reproducing the large variety of abundance patterns that massive Population III stars (10–100 M⊙) encoded in the second generation of stars (see, for example, the comparisons performed by Heger & Woosley 2010). These early stellar populations have largely been discovered through the dedicated HK (Beers, Preston, & Shectman, 1992) and Hamburg/European Southern Observatory (HES; Christlieb et al., 2001) surveys, with detailed abundance analyses being notably conducted by McWilliam et al. (1995), Cayrel et al. (2004), and Lai et al. (2008) and references therein. The observations have uncovered some unexpected trends in the relative abundance of Fe-peak elements with decreasing metallicity, which we now briefly discuss.
The first detailed study of the Fe-peak elements in stars with metallicities of solar ([Fe/H] ) was conducted by McWilliam et al. (1995). Their sample comprised the 33 most metal-poor halo stars known at the time, extending down to [Fe/H] . These authors noted changes in the general trends of some of the Fe-peak element ratios for metallicities [Fe/H] . In particular, they found that the Cr/Fe ratio, which is roughly solar in stars with [Fe/H] , decreases to [Cr/Fe] at [Fe/H] , albeit with some scatter. This trend was later confirmed by Cayrel et al. (2004) and Lai et al. (2008), whose data exhibited reduced scatter. Unfortunately, there is still a worrisome disagreement between the Cr/Fe ratios deduced from either the Cr i or Cr ii lines; differences of up to dex for metallicities [Fe/H] may be expected (Sobeck, Lawler, & Sneden, 2007), and the true Cr/Fe relative abundance in the low metallicity regime may in fact not be significantly different from the solar value.
The Ni/Fe ratio, on the other hand, exhibits no discernible trend away from the solar value down to the lowest metallicities probed by the above surveys. This is quite unlike the Zn/Fe ratio, which is roughly solar in the metallicity interval , but then gradually increases with decreasing metallicity reaching [Zn/Fe] at [Fe/H] (Primas et al., 2000; Cayrel et al., 2004). If such a behaviour were due to CCSN nucleosynthesis, the excess production of zinc is likely the result of a strong -rich freeze out (Woosley & Weaver, 1995), which in turn is linked to the explosion energy. In fact, Umeda & Nomoto (2002) invoked the dominance of hypernovae—a CCSN explosion with an order-of-magnitude more energy released than normal—at the lowest metallicities to explain the elevated [Zn/Fe] values. This interpretation is also consistent with the observed rise in the [Co/Fe] values exhibited by the same group of stars.
Despite these significant advances in the stellar abundance measurements, it would be highly advantageous to have complementary probes to independently confirm the trends uncovered in the most metal-poor stars. This will ensure that we are not biased by systematics that may affect the modelling of the absorption lines in the stellar atmospheres. With this goal in mind, we and other groups have recently focussed our attention on the most metal-poor clouds of neutral gas at redshifts –3 (Pettini et al. 2008; Penprase et al. 2008; Cooke et al. 2011a, b; see also Becker et al. 2012). Such clouds are identified amongst the damped Ly systems (DLAs), absorbers with neutral hydrogen column densities (H i) atoms cm-2 (Wolfe et al. 1986; for a review of this topic see Wolfe, Gawiser, & Prochaska 2005). At such large column densities the clouds are self-shielded from the metagalactic ionizing background, and most elements are concentrated in a single dominant ionization state, usually the neutrals or the first ions (e.g. Vladilo et al. 2001). This simple ionization structure makes the measurement of element abundances straightforward. In a recently completed survey of 22 DLAs with [Fe/H] , Cooke et al. (2011b) noted a good agreement in the abundances of C, O and Fe between halo stars and DLAs of comparable metallicity. This is perhaps not surprising, since high redshift very metal-poor (VMP) DLAs likely contain the gas from which the most metal-poor stars may have later condensed. As discussed by Pettini & Cooke (2013), VMP DLAs are therefore an ideal, complementary probe to measure the relative abundances of the Fe-peak elements, and compare them to those found in Galactic halo stars.
This is the subject of the present paper, where we measure Fe-peak element ratios in a slightly expanded version of the sample of VMP DLAs considered by Cooke et al. (2011b). This is a difficult prospect because most Fe-peak elements are less abundant than Fe by one to two orders of magnitude and the absorption lines of their dominant ion stages in VMP DLAs are generally too weak to be detected with current observational facilities. To circumvent this issue, we introduce a form of spectral stacking that allows us to measure typical Fe-peak element ratios for the whole sample of VMP DLAs. In Section 2, we briefly describe the sample. In Section 3 we introduce the spectral stacking technique and present the results of our analysis. We then compare in Section 4 the DLA Fe-peak element ratios with those measured in metal-poor halo stars. Finally, in Section 5 we compare these ratios with theoretical yields calculated with the current generation of explosive nucleosynthesis models for metal-free stars, before concluding in Section 6.
2 The Sample
The majority of the VMP DLAs considered in the present work were drawn from the survey by Cooke et al. (2011b) which comprises 22 DLAs with metallicities less than 1/100 of solar. We excluded three DLAs from that sample. Two of these were excluded because no Fe ii absorption lines were detected. In the third case, we found that the wavelength calibration was too uncertain to reliably stack portions of the spectrum for the purpose of detecting a signal from weak absorption lines (see Section 3.1). We augmented the VMP DLA sample of Cooke et al. (2011b) with two further systems from our own work, one published (Cooke, Pettini, & Murphy, 2012) and one which is the subject of a forthcoming study (Cooke et al., in preparation). Furthermore, we have also included five VMP DLAs reported in the literature that didn’t meet the selection cuts of Cooke et al. (2011b), but show clear detections of absorption lines from Fe-peak elements. Thus the total sample considered here consists of 25 VMP DLAs. Details of these systems are collected in Table 1.
| QSO Name | log | log | S/Na | ||
|---|---|---|---|---|---|
| J00350918 | 2.420 | 2.340097 | 12.99 | 20.55 | 17 |
| Q0112306 | 2.985 | 2.418440 | 13.33 | 20.50 | 23 |
| J01400839 | 3.716 | 3.696600 | 12.77 | 20.75 | 31 |
| J08313358 | 2.427 | 2.303642 | 13.33 | 20.25 | 15 |
| Q0913072 | 2.785 | 2.618376 | 12.99 | 20.34 | 47 |
| J10010343 | 3.198 | 3.078413 | 12.50 | 20.21 | 40 |
| J10370139 | 3.059 | 2.704870 | 13.53 | 20.50 | 45 |
| Q1108077 | 3.922 | 3.607670 | 13.88 | 20.37 | 49 |
| J11121333 | 2.420 | 2.270940 | 13.58 | 20.44 | 53 |
| J13373152 | 3.174 | 3.167667 | 13.14 | 20.41 | 19 |
| J13401106 | 2.914 | 2.507918 | 13.49 | 20.09 | 50 |
| J13401106 | 2.914 | 2.795826 | 14.32 | 21.00 | 50 |
| J13586522 | 3.173 | 3.067295 | 13.10 | 20.47 | 30 |
| J14190829 | 3.030 | 3.049840 | 13.54 | 20.391 | 43 |
| J14195923 | 2.321 | 2.247296 | 14.35 | 20.95 | 18 |
| J15580031 | 2.823 | 2.702389 | 14.11 | 20.67 | 31 |
| J15584053 | 2.635 | 2.553766 | 13.07 | 20.30 | 18 |
| J19447705 | 2.994 | 2.844300 | 13.24 | 20.27 | 110 |
| Q2059360 | 3.090 | 3.082833 | 14.48 | 20.98 | 27 |
| J21551358 | 4.256 | 4.212210 | 12.93 | 19.61 | 22 |
| Q2206199 | 2.559 | 2.076227 | 13.33 | 20.43 | 100 |
aIndicative signal-to-noise ratio at 5000 Å (or 6000 Å in the case of J01400839, Q1108077, J13373152, J13401106 and J21551358).
The composition of the DLAs is derived by searching for the absorption lines of elements in their dominant ionization state (usually the neutral or singly ionized species for DLAs) against the emission spectrum of a more distant, background QSO. In all cases, the QSOs were observed with either the European Southern Observatory’s (ESO) Ultraviolet and Visual Echelle Spectrograph (UVES, Dekker et al. 2000), or the W. M. Keck Observatory’s High Resolution Echelle Spectrometer (HIRES, Vogt et al. 1994). These spectra typically have resolving power , and signal-to-noise ratio S/N per wavelength bin ( km s-1). Details of the data acquisition and reduction can be found in Cooke et al. (2011b).
For the present study, we extracted a km s-1 window around each of the absorption lines of interest and fitted a low order polynomial to regions deemed to be free of absorption. The details of this continuum fit (i.e. the polynomial order and pixels used in the continuum fit) are stored, and are used later to derive the systematic errors introduced by our choice of continuum. The absorption lines targeted are listed in Table 2; vacuum wavelengths and oscillator strengths are from the compilation by Morton (2003) with updates by Jenkins & Tripp (2006).
| Ion | Wavelength | Ion | Wavelength | Ion | Wavelength | |||||||||||
|---|---|---|---|---|---|---|---|---|---|---|---|---|---|---|---|---|
| (Å) | (Å) | (Å) | ||||||||||||||
| Si ii | 1808. | 01288 | 0. | 00208 | Co ii | 1424. | 7866 | 0. | 0109 | Ni ii | 1370. | 132 | 0. | 05 | ||
| S ii | 1250. | 578 | 0. | 00543 | Co ii | 1466. | 2110 | 0. | 031 | Ni ii | 1393. | 324 | 0. | 0101 | ||
| S ii | 1253. | 805 | 0. | 0109 | Co ii | 1480. | 9546 | 0. | 0119 | Ni ii | 1454. | 842 | 0. | 0323 | ||
| S ii | 1259. | 5180 | 0. | 0166 | Co ii | 1552. | 7624 | 0. | 0116 | Ni ii | 1502. | 1480 | 0. | 0133 | ||
| Ti ii | 1910. | 9538 | 0. | 098 | Co ii | 1572. | 6480 | 0. | 0120 | Ni ii | 1709. | 6042 | 0. | 0324 | ||
| Ti ii | 1910. | 6123 | 0. | 104 | Co ii | 1574. | 5508 | 0. | 025 | Ni ii | 1741. | 5531 | 0. | 0427 | ||
| Cr ii | 2056. | 25693 | 0. | 1030 | Co ii | 1941. | 2852 | 0. | 034 | Ni ii | 1751. | 9157 | 0. | 027 | ||
| Cr ii | 2062. | 23610 | 0. | 0759 | Co ii | 2012. | 1664 | 0. | 0368 | Zn ii | 2026. | 13709 | 0. | 501 | ||
| Cr ii | 2066. | 16403 | 0. | 0512 | Ni ii | 1317. | 217 | 0. | 057 | Zn ii | 2062. | 66045 | 0. | 246 | ||
aFrom Morton (2003) with updates by Jenkins & Tripp (2006).
3 Analysis and Results
The primary goal of this study is to measure the relative abundances of a few Fe-peak elements with atomic number in the range 22 (Ti) to 30 (Zn), in the lowest metallicity systems known at redshifts . Of these elements, we adopt Fe as the ‘reference’ element since it is the most abundant of the Fe-peak elements, and its absorption lines are detected in all of the DLAs in our sample with at least confidence.
The remaining Fe-peak elements are all less abundant than Fe, and their absorption lines are rarely seen in the most metal-poor DLAs; the only reported detections in individual VMP DLAs are those discussed here. The reason for such dearth of data can be appreciated by considering the following. Even the strongest Ni ii absorption line in Table 2, Ni ii , would require a signal-to-noise ratio S/N per resolution element to be detected at the level in a DLA with [Fe/H] and (H i)/cm. Such a high S/N ratio is beyond current observational capabilities given that most VMP DLAs are found in the spectra of faint QSOs (). Consequently, all measures of [Ni/Fe] in individual VMP DLAs reported to date refer to higher (and rarer) column density systems than the DLA threshold (H i)/cm.
To circumvent this issue, we developed a new type of stacking technique to measure, or place limits on, the ratios of several Fe-peak elements in the DLAs in our sample.
3.1 Stacking Technique
The stacking technique that we now describe can be used to combine either: (i) multiple transitions of a given ion for a single DLA; or (ii) all transitions of a given ion in all DLAs (assuming that Fe-peak element ratios do not vary significantly between different VMP DLAs). In individual DLAs where we detect at least one absorption line from an Fe-peak element (other than Fe), we used the former approach and stacked all transitions of that ion covered by our spectrum of the DLA, whether detected or not. This has the effect of utilising all of the information available to improve the precision of the ion column density determination over that achievable from the analysis of only the absorption lines that have been detected. For DLAs where a given ion has not been detected, we adopted the latter approach and produced a ‘population’ stack.
One advantage of working with weak, undetected absorption lines is that they fall on the linear part of the curve of growth111This statement does not necessarily apply to low resolution spectra, but is valid at the high spectral resolution of our echelle observations.. In this regime, one can simply relate the rest-frame equivalent width of an absorption line to the column density (cm-2) of element X in ionization state n by:
| (1) |
where and are the oscillator strength and the rest wavelength of the atomic transition (in Å) respectively; values relevant to this work are collected in Table 2. This technique has the clear advantage of being independent of the cloud modelling, and the spectral resolution. Given that in all cases we have at least one unsaturated Fe ii absorption line from which the column density of singly ionized iron, (Fe ii), can be deduced with confidence, equation (1) can be rearranged as follows:
| (2) |
where EWpp is the equivalent width per pixel. Thus, for each pixel in the spectrum where we see absorption by X n, the rest-frame equivalent width of this pixel alone [weighted by the fraction on the right side of equation (2)] represents the fractional contribution to the total column density ratio of species X n relative to Fe ii. If the width of each pixel is measured in km s-1, the quantity on the left side of equation (2) has the units km-1 s. Integrating equation (2) over all pixels where the absorption takes place then gives the final value of .
For a given DLA, equation (2) can be used to create a ‘stacked’ spectrum for all lines of a given species. As an example, the suite of Ni ii lines available in many of the DLA spectra can be combined to provide a single, more precise measure of the Ni ii/Fe ii ratio. To do this, we first convert the spectrum in the vicinity of each transition to a common velocity scale. The zero point of the velocity scale is established from the profiles of the Fe ii lines available. We then calculate the rest-frame equivalent width for each pixel for all transitions and use equation (2) to convert this to a column density ratio. Finally, we determine the weighted mean of all transitions for a given species, where the weights correspond to the inverse variance of each pixel. In this way, we ensure that the final stack has the highest achievable S/N. We stress that this technique can be implemented for a single DLA without any assumptions. Therefore, for DLAs where we detect at least one transition of a given Fe-peak element (apart from Fe itself), we will use this technique to stack all the available transitions in that DLA spectrum and obtain the value of appropriate to that DLA.
The stacking method just described can only be applied to the few cases where we do detect at least one absorption line of a given Fe-peak element. However, for most VMP DLAs in our survey, even stacking all the (undetected) absorption lines of a given ion in the spectrum will not improve the S/N sufficiently to lead to a meaningful measure of . In these circumstances, however, we can still apply the above method to construct a stacked spectrum of all lines of a given ion for all DLAs with non-detections. In this way, we can derive an averaged measure of (or an upper limit to this ratio) for the population of VMP DLAs in our sample. Of course, such an average value does not tell us about the spread of values of (X n)/(Fe ii) within the population of DLAs, but it is nevertheless instructive, given the relatively small scatter in the ratios of most Fe-peak elements exhibited by Galactic halo stars of comparable metallicity (Cayrel et al., 2004; Lai et al., 2008; Yong et al., 2012).
There are two potential systematics that may introduce a bias when stacking the absorption lines for a selection of DLAs with a variety of metallicities and H i column densities. The first concern is that certain species may be depleted (relative to Fe) onto dust grains, an effect which is known to depend on metallicity. Fortunately, when the DLA metallicity is [Fe/H] , dust depletions become unimportant (Pettini et al., 1997; Akerman et al., 2005). Furthermore, the elements that we consider here have roughly the same affinity for dust (excluding Zn; see our discussion in Secion 4.5) so their relative dust depletions are negligible. The other concern is that the radiation field to which the gas is exposed may vary from DLA to DLA, depending among other factors on the H i column density. However, for the ions of the elements under consideration here, which are the dominant ions in neutral gas, the differential ionization corrections required to convert the measured to the element abundance ratio X/Fe are minimal and can be safely neglected (see e.g. Vladilo et al. 2001; Cooke et al. 2010).
Thus, in what follows we assume (X n)/(Fe ii) = (X)/(Fe). Comparing the above ratio to the solar value then gives the quantity of interest, [X/Fe] . We adopt the Asplund et al. (2009) solar abundance scale, taking either the photospheric, meteoritic, or an average of the two determinations following Lodders, Plame, & Gail (2009). The solar abundances adopted in this work are listed in Table 3.
| X | log(X/H)⊙ | X | log(X/H)⊙ | |
|---|---|---|---|---|
| Si | Fe | |||
| S | Co | |||
| Ti | Ni | |||
| Cr | Zn |
aFrom Asplund et al. (2009).
The most likely source of systematic error is in the choice of the continuum around each absorption line, which is especially important when dealing with weak lines. To estimate the additional uncertainty (and bias) that is introduced by our placement of the continuum level, we adopted a Monte Carlo approach similar to that described by Pettini & Cooke (2012). We used the measured line equivalent widths (or upper limits) to generate a series of line profiles for each of the transitions used in the stack. We then combined these profiles with the stacking technique described above—first without any continuum adjustments and then again with the identical continuum adjustments applied to the real data (see Sec. 2). This exercise was repeated 1000 times, and the deviations between the equivalent widths derived with and without the continuum adjustments were taken to be a measure of the systematic uncertainty. In general, we found that the systematic errors are of the same order as the random errors. Perhaps more importantly, we also verified that in all of the cases described below there were no significant systematic biases introduced by our estimate of the continuum level.
3.2 J13401106 – A test case
We tested the validity of this technique by applying it to one of the few clear detections of Cr ii and Ni ii absorption in our sample. With a relatively high column density (H i) cm-2, the DLA at redshift toward J13401106 shows an unusually high number of metal lines for its low metallicity [Fe/H] (Cooke et al., 2011b). From the analysis of 36 absorption lines from 11 ions dominant in H i regions, Cooke et al. (2011b) derived a ‘cloud model’ which successfully reproduced the line profiles. This model was used to derive the ion column densities, including those of Cr ii and Ni ii.
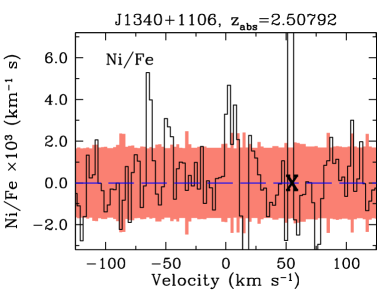
In Fig. 1, we have reproduced the stacks of Cr ii and Ni ii lines derived from equation (2), showing clear detections near relative velocity km s-1. The total Cr ii/Fe ii and Ni ii/Fe ii ratios are obtained by integrating these profiles over the velocity range of the absorption, defined by the extent of the stronger absorption lines of Fe ii. We find [Cr/Fe] and [Ni/Fe] . These values compare well with [Cr/Fe] and [Ni/Fe] deduced by Cooke et al. (2011b) from profile fitting of the absorption lines.
3.3 Individual systems with detections
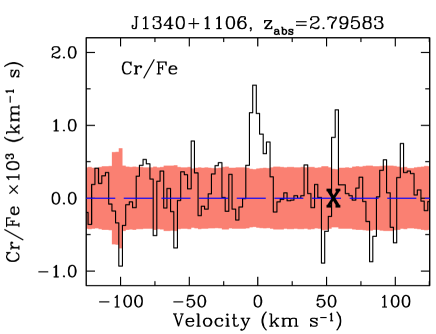
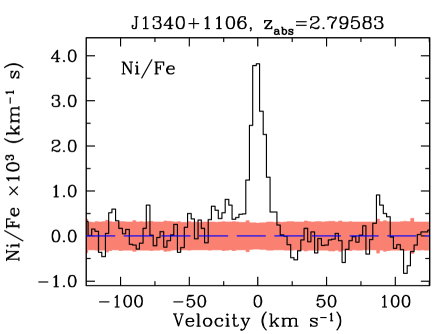
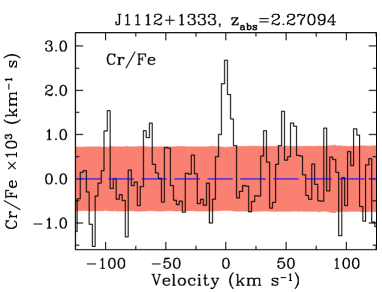
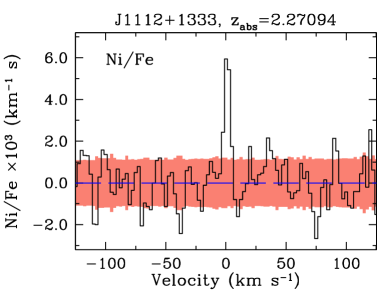
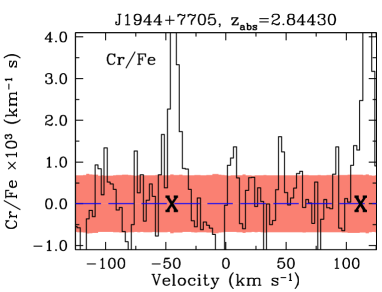
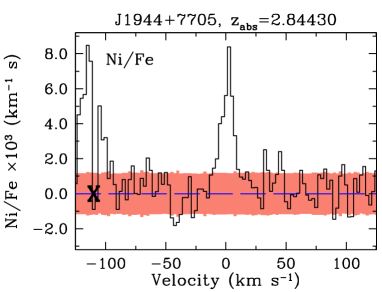
We now apply the stacking technique described in Section 3.1 to the five DLAs in our sample that: (i) either show absorption by at least one Fe-peak element (other than Fe), or (ii) where the data are of sufficient quality to allow a useful upper limit to be set. For this to be the case, these VMP DLAs either have a large H i column density, or their spectra have been recorded at an unusually high S/N, or both. Even in these most favourable cases, however, the only Fe-peak elements detected are Ni and Cr, the two most abundant after Fe. In Table 4 we list five detections (four for Ni ii and one for Cr ii) and three upper limits (one for Ni ii and two for Cr ii). For each system, we give [Fe/H], the significance of detections of Ni ii and Cr ii, and the number of transitions used in the stacked spectrum. In all cases, we integrated the stacked profile over the velocity range exhibited by the stronger Fe ii absorption lines, which is provided in column 6 of Table 4.
The stacked profiles for these five DLAs are shown in Fig. 1 and Fig. 2. All of the right panels in Fig. 2 have significant features (see penultimate column of Table 4). In the lower-left and middle-left panels of the figure, we see no discernible absorption and deduce corresponding upper limits to the ratios Ni/Fe and Cr/Fe. The top-left panel shows a feature that is ‘detected’ at the level from which we conservatively derive a upper limit to [Cr/Fe].
3.4 Systems with non-detections
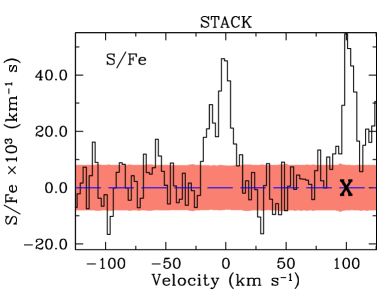
The remaining 16 DLAs in our sample do not show individual absorption lines from any Fe-peak element besides Fe; these systems are now used to produce a mean ‘population’ stack. As discussed earlier, in generating this stack we assume that VMP DLAs do not exhibit a wide range of [X/Fe] values over the metallicity range probed here, . Cases with individual detections described in Section 3.3 were not included in the stacks. By inspecting the Fe ii absorption lines for all systems in the stack, we determined that most absorption occurs over the velocity interval km s-1 from the reference redshift. We then confirmed that all of the undetected absorption lines used in the stack contained no significant absorption within this velocity interval (i.e. all pixels are within of the continuum level in this velocity interval). Furthermore, to be certain that we are not including spurious contributions from coincident, unrelated absorption, we rejected the high and low values for each pixel in the stack. This procedure ensures that we suffer minimal contamination.
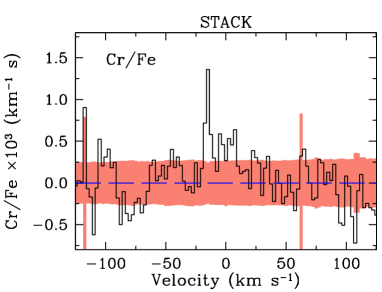
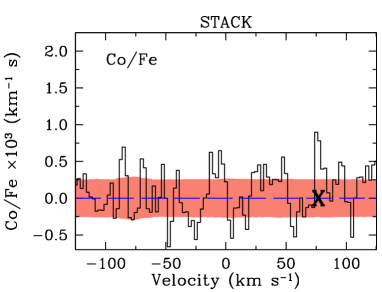
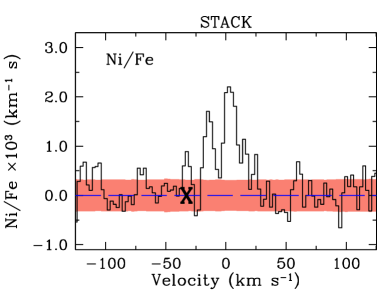
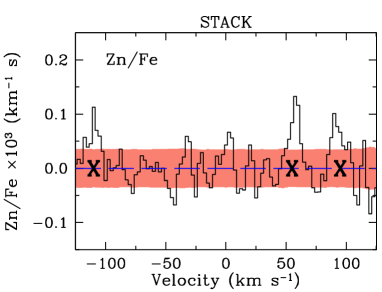
The results of these stacks are reproduced in Fig. 3. Due to the wider variety of line profile shapes that have been used in the stack (which in some cases contain multiple components and extend to km s-1), the features appear more broadened than those shown in Fig. 2 which typically exhibit a single dominant absorption component. The corresponding values of [X/Fe] are listed in the fourth column of Table 4. The metallicity [Fe/H] to which these values refer is not the same for every element X considered, because not all of the 16 DLAs contribute the same number of absorption lines to each stack. The values of [Fe/H] and their ranges listed in the fifth column of Table 4 under the heading ‘Stacked systems with non-detections’ were determined using a weighted bootstrap method on the array of Fe/H values for each stack, with (Fe ii) as the weight on each line used in the stack.
In order to check the consistency of our results, we also produced two stacks of lines from -capture elements, one for the weak Si ii line, and the other for the S ii triplet at . As can be seen from Table 4, we find [Si/Fe] (random and systematic error respectively) and [S/Fe] . The modest enhancement by a factor of of these two -capture elements relative to Fe is consistent with the mean value deduced by Cooke et al. (2011b) in the same metallicity interval.


3.5 Other systems in the literature
To our knowledge, this is the first detailed investigation into the Fe-peak element ratios in very metal-poor DLAs. This is perhaps not surprising, given that there are just a few VMP DLAs that we could find in the literature with column density measurements of Fe-peak elements: (1) the DLA with /cm at towards Q00002619 (Molaro et al., 2000); (2) the DLA towards Q025500 with /cm (Prochaska et al., 2001); (3) the system at with /cm towards Q234801 (Prochaska et al., 2001); and (4) the DLA towards Q23481444 at with /cm (Dessauges-Zavadsky et al., 2007). Other relevant details for these absorbers are collected in Table 4, under the heading ‘Literature sample’. All literature values have been adjusted to the solar abundance scale adopted here.
| Name | X | [X/Fe]a | [Fe/H] | Confidence | Number | ||
|---|---|---|---|---|---|---|---|
| km s-1 | of lines | ||||||
| Individual systems with detections | |||||||
| J | Cr | 2 | |||||
| J | Ni | 6 | |||||
| J | Ni | 5 | |||||
| J | Cr | 2 | |||||
| J | Ni | 7 | |||||
| J | Ni | 7 | |||||
| J | Cr | 2 | |||||
| J | Ni | 7 | |||||
| Stacked systems with non-detections | |||||||
| STACK | Si | 6 | |||||
| STACK | S | 14 | |||||
| STACK | Ti | 16 | |||||
| STACK | Cr | 8 | |||||
| STACK | Co | 85 | |||||
| STACK | Ni | 52 | |||||
| STACK | Zn | 11 | |||||
| Literature sample | |||||||
| Q | Cr | 1 | |||||
| Q | Ni | 1 | |||||
| Q | Zn | 1 | |||||
| Q | Ni | 3 | |||||
| Q | Cr | 2 | |||||
| Q | Ni | 2 | |||||
| Q | Zn | 1 | |||||
| Q | Cr | ||||||
| Q | Ni | 1 | |||||
| Q | Zn | 1 | |||||
aFor the cases where two errors are given, they refer to random and systematic errors respectively.
bMolaro et al. (2000).
cProchaska et al. (2001).
dDessauges-Zavadsky et al. (2007).
4 Comparison with low-metallicity stars
Our knowledge of the Fe-peak elements in the VMP regime ([Fe/H] ) is currently based primarily on observations of the most metal-poor stars in the halo of our Galaxy and its companions. VMP DLAs offer a new probe to verify independently the validity of the stellar trends with metallicity. One advantage of using DLAs to measure relative element abundances is that the derived ratios are model independent; in metal-poor stars, systematic uncertainties in the abundances may arise for some absorption lines that are modelled in one-dimension, or if the assumption of local thermodynamic equilibrium (LTE) is not valid.
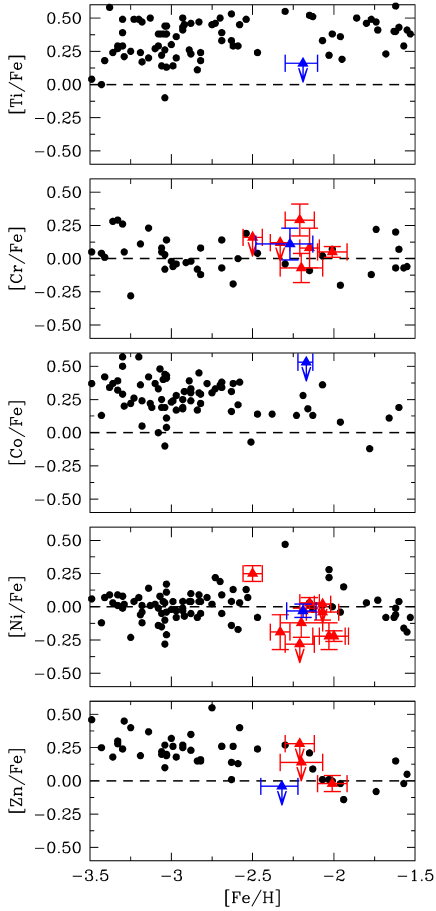
To obtain independent confirmations of the stellar trends, we compare in Fig. 4 the Fe-peak ratios Ti, Cr, Ni, Zn/Fe measured in our sample of VMP DLAs (filled triangles) with the values found in the halo star surveys (filled circles) by Gratton et al. (2003), Cayrel et al. (2004), Lai et al. (2008), Bonifacio et al. (2009) and Bergemann, Pickering, & Gehren (2010). In all cases except Cr/Fe, stellar abundances were derived from 1-D LTE models. For the Cr/Fe ratio we have instead used the one dimensional non-LTE (NLTE) estimate by Bonifacio et al. (2009). Where necessary, the stellar measurements have been corrected to the abundance scale adopted in this work (see Section 3.1 and Table 3).
Overlaid on the five panels of Fig. 4 are the DLA measurements and upper limits from Table 4. The red triangles are for DLAs with detections of Fe-peak element lines, or where a useful upper limit could be derived. The single blue triangle in each panel shows the mean value of [X/Fe] for the population of VMP DLAs without individual detections. The error bars on the values of [X/Fe] include both random and systematic uncertainties, and the ranges of [Fe/H] to which the stacks of undetected lines refer were estimated as explained in Section 3.4. We now comment separately on the individual Fe-peak element ratios.
4.1 Titanium
There are two resonance lines of Ti ii accessible in the rest-frame ultraviolet, at and . The corresponding velocity separation, km s-1 is sufficient to avoid contamination between the two spectral regions over which we integrate, of width km s-1 centred on each line. In any case, any contamination would have the result of making the upper limit we deduce for the Ti/Fe abundance more conservative. As can be seen from Fig. 3 (second row, left panel) even by stacking 16 Ti ii lines we do not achieve a detection; the upper limit we deduce, [Ti/Fe] at [Fe/H] (Table 4) is plotted as a blue triangle in the top panel of Fig. 4.
The derived limit on [Ti/Fe] is close to the lower envelope of [Ti/Fe] values in stars of comparable metallicity, derived from the analysis of Ti ii lines222We ignore stellar abundances derived from Ti i, as per the recommendation by Bergemann (2011).. This does not leave much room for agreement between stars and DLAs, and the lack of any discernible absorption beyond the region near km s-1 in the Ti/Fe panel of Fig. 3 further suggests some level of disagreement. Departures from LTE may result in small corrections to the stellar Ti/Fe ratios measured from Ti ii lines (Bergemann, 2011). This may explain some of the mismatch between stars and DLAs. An alternative, or additional, possibility is that there may be a small residual degree of Ti depletion onto dust grains in VMP DLAs. Although it is usually assumed that DLAs with metallicities of solar exhibit negligible depletion (Pettini et al., 1997; Akerman et al., 2005), Ti is one of the most refractory elements, and is readily incorporated into dust grains in the local interstellar medium (see e.g. Spitzer & Jenkins 1975). We thus caution that Ti may suffer from a mild depletion in DLAs when [Fe/H] . However, given that the upper limit of Ti/Fe derived here for the most metal-poor DLAs is consistent with the values obtained from explosive nucleosynthesis calculations of core-collapse supernovae (see Section 5 and Figure 5), with no appreciable -enhancement, we suggest that Ti in the most metal-poor DLAs behaves like an Fe-peak element rather than an -capture element.
4.2 Chromium
Chromium is accessible via the well known triplet Cr ii (e.g. Pettini et al., 1990). In the present sample, we have four measures of [Cr/Fe] and two upper limits in individual DLAs, and a detection in the stack of DLAs without individual detections (see Table 4). These seven determinations are all in good mutual agreement, and they broadly agree with the stellar data, as can be seen in the second panel from the top in Fig. 4. In the DLAs, [Cr/Fe] is approximately solar, or possibly slightly supersolar by dex, down to [Fe/H] .
In stars the Cr/Fe ratio is found to be roughly solar down to [Fe/H] . For [Fe/H] , the earliest measures of Cr/Fe (based on the Cr i lines) suggested that this ratio gradually decreases to [Cr/Fe] when [Fe/H] (Cayrel et al., 2004). This decline may however be spurious, reflecting an increasing correction with decreasing metallicity for NLTE effects to the Cr i lines used in the analysis. On the basis of their NLTE calculations, Bergemann & Cescutti (2010) have argued that the [Cr/Fe] ratio remains close to solar down to the lowest metallicities, in good agreement with the Cr/Fe ratio in metal-poor stars measured from the Cr ii lines (Lai et al. 2008; Bonifacio et al. 2009, as plotted in Fig. 4). Unfortunately, our survey does not extend to lower metallicities where the stellar data may deviate from solar Cr/Fe. In future, it should be possible to verify the behaviour of the Cr/Fe ratio at the lowest metallicities with observations of VMP DLAs of lower metallicity than those considered here. This is an important check to perform because models of Population III nucleosynthesis interpret sub-solar Cr/Fe ratios as resulting from a deeper mass cut (i.e. larger explosion energy; Umeda & Nomoto 2002). Such an explanation is in line with the observed rise in both the Co/Fe and Zn/Fe ratios at metallicities [Fe/H] (see below).
4.3 Cobalt
Together with Ti, Co is the least common of the Fe-peak elements considered here, with an abundance of only of that of Fe in the Sun (Table 3). Thus, it is not surprising that we do not detect Co ii absorption in any of the 25 VMP DLAs in the present sample. This difficulty is offset to some degree by the availability of many Co ii transitions in the wavelength interval 1400–2000 Å which is well observed in DLAs at –3 (see Table 2). By stacking a total of 85 such features we are able to set an instructive upper limit of [Co/Fe] for the VMP DLA population at a mean metallicity [Fe/H] (Table 4).
The earliest compilations of element ratios in the most metal-deficient stars indicated that Co is enhanced relative to Fe when [Fe/H] (Ryan, Norris, & Bessell, 1991; McWilliam et al., 1995), if the Co abundance is measured from Co i lines assuming LTE, as is the case for the data in Fig. 4. Even though later studies have confirmed the trend of increasing [Co/Fe] with decreasing metallicity (Cayrel et al., 2004; Lai et al., 2008; Bonifacio et al., 2009), the true level of the enhancement of Co relative to Fe is still a matter of debate. The Co i lines appear to suffer from large (positive) corrections due to the neglect of modelling their hyperfine structure (HFS) as well as departures from LTE (Bergemann, Pickering, & Gehren, 2010). In some cases, the offset is calculated to be as large as dex. Applying these corrections would result in a substantial enhancement of Co, to a level that may be inconsistent with the upper limit to [Co/Fe] we have determined in the DLAs (see middle panel of Fig. 4). Furthermore, model calculations of Co production in CCSNe have difficulty in reproducing such extreme enhancements of the Co/Fe ratio. Some authors have interpreted the rise in [Co/Fe] at low metallicities as evidence for high energy CCSN enrichment (Umeda & Nomoto, 2002), but even then there is still a shortfall in the model abundances compared to the stellar values corrected for NLTE and HFS effects. DLAs can provide new insights into this problem, and will undoubtedly play an important role in future to help settle the debate.
4.4 Nickel
Ni is the second most abundant Fe-peak element in the Universe. This fact, in addition to the multitude of relatively strong transitions that are easily accessible (i.e. the lines are usually free from both the Ly forest and telluric absorption), has resulted in Ni being the most commonly observed Fe-peak element in high redshift DLAs (besides Fe). For the sample of metal-poor DLAs considered here, we have seven detections and two upper limits in individual systems, and a total of 52 lines contributing to the stack of undetected lines.
In Galactic stars, the relative abundances of Ni and Fe remain essentially constant over the entire range of metallicity probed. Although there are notable exceptions to the rule, the typical stellar [Ni/Fe] value is solar ([Ni/Fe]), in very good agreement with the value [Ni/Fe] we derive for VMP DLAs at a mean [Fe/H] (see Fig. 4). It is interesting, however, that most of the systems with detected Ni ii absorption exhibit slightly sub-solar ratios, except for one DLA with an unusually high Ni/Fe ratio. It appears that both stars and DLAs show significant variation in their Ni/Fe ratios, and DLAs preferentially have sub-solar values of [Ni/Fe].
4.5 Zinc
Zn is rarely detected in DLAs when the metallicity is less than 1/100 of solar; we have only one detected system in our sample (reported by Molaro et al. 2000) in a DLA with one of the largest recorded values of neutral hydrogen column density, (H i)/cm. In addition, there are a further two systems in the literature with useful upper limits. From the stacked spectrum of 11 unblended Zn ii lines in DLAs without individual detections, we deduce a upper limit [Zn/Fe] at a mean [Fe/H] .
While [Zn/Fe] is close to solar in stars with [Fe/H] (Nissen et al., 2004, 2007), it rises to supersolar values at lower metallicities (see bottom panel of Fig. 4). This trend, first noted by Primas et al. (2000) and later confirmed by Cayrel et al. (2004) with a larger sample of halo stars, is unlikely to be due to the details of the stellar atmosphere modelling. The currently favoured interpretation, suggested by Umeda & Nomoto (2002), is that it reflects nucleosynthesis by hypernovae — supernovae with an order of magnitude larger explosion energy than normal. The higher energy explosion results in a stronger -rich freezeout, which in turn favours the production of Zn.
Although the statistics for VMP DLAs are limited, our upper limit [Zn/Fe] for the population of DLAs with a mean [Fe/H] (blue triangle in the bottom panel of Fig. 4) is not consistent with an enhancement of Zn at these metallicities. There is no hint of Zn ii absorption in the stack shown in the bottom panel of Fig. 3, suggesting that the true value of [Zn/Fe] in VMP DLAs may well be sub-solar and thus different from the values found in stars of comparable metallicity. Corrections due to dust depletion effects or unseen ion stages, although expected to be small, would both act to lower the Zn/Fe ratio compared to the value listed in Table 4 and plotted in Fig. 4. Given that Zn has the potential to be a powerful probe of the explosion energy, it is now important to increase the sample of DLAs with measurable [Zn/Fe] down to at least [Fe/H] for a more instructive comparison with the stellar data than is possible at the moment. A full accounting of the relevant non-LTE effects is also required to firmly establish the elevated Zn/Fe ratio that is seen in stars at the lowest metallicities.
5 explosion energy of Type-II supernovae
It was shown in Cooke et al. (2011b) that the chemical composition of the most metal-poor DLAs is consistent with the hypothesis that they were enriched by massive stars that ended their lives as core-collapse supernovae. Specifically, the enhanced [O/Fe] ratio that is observed for all of the DLAs in our sample, implies that the dominant sources of metals in these systems are Type-II supernovae. In this section, we will attempt to estimate the typical explosion energy of these supernovae by comparing the abundances of Fe-peak elements deduced above with the relative yields calculated with models of explosive nucleosynthesis in metal-free stars. It has been known for over a decade that the relative abundances of the Fe-peak elements at low metallicity can provide clues regarding the physics of a core-collapse supernova explosion (Woosley & Weaver, 1995; Umeda & Nomoto, 2002). Progress in this area is highly desirable, because we still lack a physical understanding of the mechanism that drives the explosion, despite many recent efforts (e.g. Mezzacappa 2005; Ott, O’Connor, & Dasgupta 2011). In the current generation of massive star nucleosynthesis models this shortcoming is circumvented by parameterising the physics of the explosion in order to calculate the resulting element yields. The parameterisation is typically achieved by employing a simple description of the mixing that occurs between the stellar layers (due to either Rayleigh-Taylor or rotationally-induced mixing), and specifying a mass-coordinate (or mass-cut) that defines the material that either escapes the binding energy of the exploding star, or falls back onto the newly formed compact object.
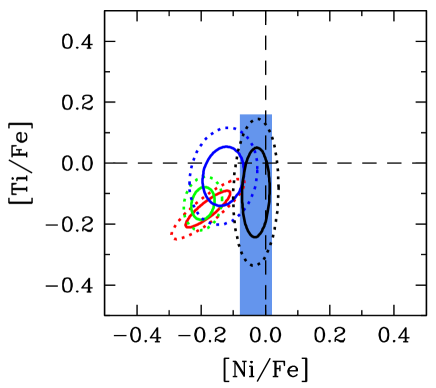
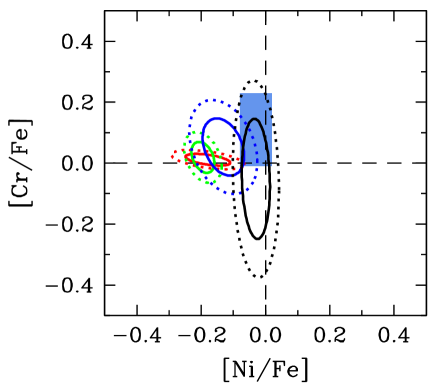
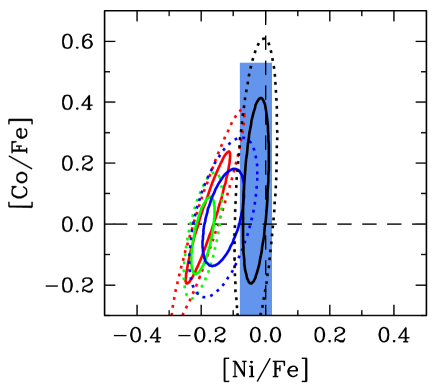
Perhaps the most detailed CCSN explosive nucleosynthesis calculations are those by Heger & Woosley (2010). These authors have investigated the explosive nucleosynthesis in massive stars (– M⊙) with a fine mass-resolution ( M⊙); the entire suite consists of 120 stellar models. Each star undergoes a supernova explosion, which is simulated as a moving piston that deposits momentum at a specified mass-coordinate. We have adopted the standard case which sets the piston to be at the base of the oxygen burning shell, corresponding to an entropy per baryon of . Each exploding star is simulated with 10 different values of the final kinetic energy at infinity, taken to be in the range () erg. A simple prescription of the mixing that occurs between the stellar layers during the explosion is also implemented. This is achieved by running a boxcar filter with a variety of widths (14 in total), ranging from no mixing at all to the maximum filter width of 25% of the He core size. The entire suite of models consists of a total of 16 800 combinations of these parameters.
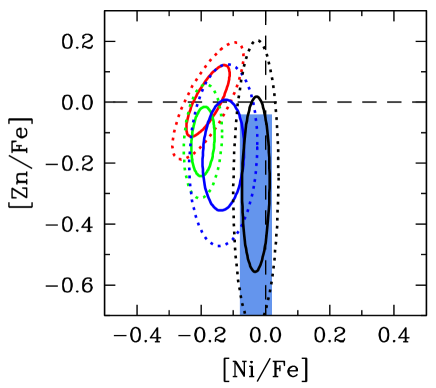
For a given final kinetic energy at infinity and amount of mixing, we weight these chemical yields by a power-law stellar initial mass function (IMF) with an exponent that can take values in the range 0.35–2.35, where a Salpeter-like IMF corresponds to 1.35. Our conclusions on the explosion energy therefore apply to the mass range of stars with the dominant Fe-peak element yields. We subdivide the weighted yields into four arbitrary groups depending on the final kinetic energy at infinity: (1) the hypernovae, with energies in the range (5.0– erg; (2) the high-energy supernovae, with energies in the range (1.8– erg; (3) the typical supernovae, with energies in the range (0.9–1.5) erg; and (4) the faint supernovae, with energies in the range (0.3– erg. In Fig. 5, these four groups are colour-coded in red, green, blue, and black respectively. Given the large number of models considered, in Fig. 5 we represent each of these four explosion energy ranges with two ellipses that enclose, respectively, 68% (solid lines) and 95% (dotted lines) of the models in that range. In this way, we can learn how likely a certain explosion energy is, given two measured Fe-peak element ratios. For all panels in the figure, we also show the ranges of Fe-peak element ratios determined from the DLA stacks (displayed as shaded boxes).
In all of the panels for Fig. 5, it is evident that [Ni/Fe] has the strongest discriminatory power on separating the low and high energy supernovae. The abundances of Ti, Cr, and Co relative to iron, on the other hand, are similar for all four energy groups. Nevertheless, it is reassuring that the model calculations and VMP DLA measures (or upper limits) of the Ti/Fe, Cr/Fe and Co/Fe ratios are in good agreement with each other.
As can be seen from the bottom right panel of Fig. 5, it is the combination of the Zn/Fe and Ni/Fe ratios that provides the most discriminatory power on the explosion energy. The relationship between Zn/Fe and explosion energy has been previously noted by Umeda & Nomoto (2002). These authors invoked the increased importance of hypernovae with decreasing metallicity to explain the gradual rise to [Zn/Fe] at [Fe/H] discovered in the most metal-poor halo stars (Primas et al., 2000; Cayrel et al., 2004). However, even the most energetic supernovae in the Heger & Woosley (2010) models underproduce Zn compared to the enhanced values reported by Cayrel et al. (2004) and Lai et al. (2008). To account for this deficiency, Heger & Woosley (2010) caution that Zn can also be produced by other (unaccounted for) sources, such as the neutrino wind from a newly formed neutron star (i.e. the ‘hot bubble’ component; for a relevant discussion, see Pruet et al. 2005). Izutani & Umeda (2010), however, point out that such a scenario requires a contrived degree of fine-tuning for the explosion parameters and favour hypernovae as the more natural explanation for the elevated Zn/Fe ratios.
Thus, the jury is still out regarding the origin of the high Zn/Fe ratios measured in the most-metal poor stars. As has been shown to be the case for other elements (e.g. Cooke et al., 2011b), complementary observations in VMP DLAs have the potential of resolving the impasse. Unfortunately, the Zn ii lines in VMP DLAs are very weak, and their detection with current instrumentation will require the rare combination of bright background QSOs and unusually high column densities of neutral hydrogen. We estimate that DLAs with cm-2 are required to have a chance of detecting the Zn ii lines in the metallicity regime [Fe/H] ; such DLAs do exist, but all known cases are located in front of QSOs too faint for their spectra to be recorded at the required S/N and resolution with current instrumentation. However, measuring the Zn/Fe ratio in the most metal-poor DLAs is a goal that can be readily achieved with the forthcoming generation of 30-m class telescopes. This is a very exciting prospect. Only by measuring the relative abundance of the Fe-peak elements in DLAs with [Fe/H] , can we confirm the trend of [Zn/Fe] at the lowest metallicities, and thereby pin down the typical energy released by the CCSNe of the first stars.
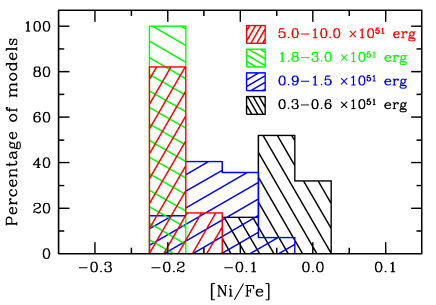
Although the Zn/Fe ratio provides the strongest separation between hypernovae and other types of SNe, it cannot discriminate the typical SNe from faint SNe. The clear, but weak dependence of [Ni/Fe] on the explosion energy, which has not previously been noted, provides the required separation. To illustrate this point better we show in Fig. 6 the full distribution of [Ni/Fe] values derived from the Heger & Woosley (2010) models with the same colour-coding as in Fig. 5. Thus, the combination of these three elements, Fe, Ni and Zn, offers the prospect of pinning down the explosion energy of the stars that produced most of the Fe-peak elements in the most metal-poor DLAs.
The primary motivation of this work was to estimate the energy released by the stars that enriched the most metal-poor DLAs. The results presented here are only a first step in this direction and have mostly highlighted the need for further observations of DLAs at even lower metallicities than the regime probed so far. Based on the low value of [Zn/Fe] and near-solar values of [Ni/Fe] we have found, we tentatively conclude that VMP DLAs were probably enriched by massive stars that released erg of energy, However, we caution that this conclusion is based on the assumption that these absorbers were enriched only by Population III stars (and that the nucleosynthesis by such stars is accurately reproduced by current models). It remains to be tested how the relative Ni, Zn and Fe yields depend on the metallicity of the progenitor star, as well as the explosion energy. This is a goal for future, high mass-resolution, metallicity-dependent stellar yield calculations.
6 Summary and Conclusions
We have presented the first dedicated survey of Fe-peak elements in very metal-poor DLAs at redshifts –3, focussing in particular on the ratios of Ti, Cr, Co, Ni, Zn to Fe. Based on the analysis of the relative abundances of these elements in a sample of 25 DLAs with [Fe/H] , we draw the following conclusions:
(i) In nine of the 25 DLAs, we could measure element ratios, or useful upper limits, directly from detected absorption lines. In the majority of DLAs, however, the lines are too weak to be detected in available spectra. To deal with such cases, we have devised a form of spectral stacking that allows us to measure the Fe-peak element ratios typical of the VMP DLA population as a whole, at mean metallicities [Fe/H] .
(ii) Comparing the Fe-peak element ratios deduced in VMP DLAs with the values measured in metal-poor stars of the Galactic halo, we found fair agreement for [Cr/Fe] and [Ni/Fe]. Furthermore, the upper limit on [Co/Fe] in VMP DLAs is consistent with the stellar values, provided the non-LTE corrections to the latter are not too severe. On the other hand, the upper limits we place on the [Ti/Fe] and [Zn/Fe] values in VMP DLAs are barely consistent with the stellar measurements; the DLA upper limits lie near the lower envelope of these ratios in halo stars. Whether there is indeed a discrepancy or not can only be confirmed by future observations of DLAs with [Fe/H] , this being the metallicity regime where the stellar trends exhibit marked deviations from the solar ratios.
(iii) By comparing the Fe-peak element ratios in the DLAs to the values computed with the most detailed current models of nucleosynthesis by metal-free stars, we tentatively concluded that the DLAs in our sample were probably enriched by massive stars that released erg when they exploded as core-collapse supernovae. An extension of models such as those by Heger & Woosley (2010) to Population II stars is required to test if the Fe-peak element yields, particularly those of Ni, Zn and Fe, depend on metallicity as well as the stellar mass and explosion parameters.
The present belief is that the most metal-poor Galactic stars contain the metals synthesised by an earlier generation of massive stars that had ended their lives as hypernovae; however, we have found little evidence so far for this hypothesis in the chemical composition of the most metal-poor DLAs. Future observations with the forthcoming generation of 30-m class telescopes, equipped with echelle spectrographs, will allow us to confidently measure the relative abundances of Fe-peak elements in individual DLAs with [Fe/H] of solar. We suspect that only then will we be able to reliably determine the energy released by the first stars.
Acknowledgements
We are grateful to the staff astronomers at the VLT and Keck Observatories for their assistance with the observations, and to the telescope time assignment committees for their support of the VMP DLA survey. We thank the referee, Paolo Molaro, for a prompt and helpful report that improved the paper, and Piercarlo Bonifacio for communicating his measurements of Cr/Fe in very metal-poor stars. It is also a pleasure to acknowledge valuable discussions with Poul Nissen and Stan Woosley, regarding the stellar abundance measurements and nucleosynthesis calculations. We thank the Hawaiian people for the opportunity to observe from Mauna Kea; without their hospitality, this work would not have been possible. RC acknowledges the support of a Morrison Fellowship provided by the University of California, Santa Cruz. RAJ is supported by an NSF Astronomy and Astrophysics Postdoctoral Fellowship under award AST-1102683. MTM thanks the Australian Research Council for a QEII Research Fellowship (DP0877998).
References
- Akerman et al. (2005) Akerman C. J., Ellison S. L., Pettini M., Steidel C. C., 2005, A&A, 440, 499
- Asplund et al. (2009) Asplund M., Grevesse N., Sauval A. J., Scott P., 2009, ARA&A, 47, 481
- Aufderheide, Baron, & Thielemann (1991) Aufderheide M. B., Baron E., Thielemann F.-K., 1991, ApJ, 370, 630
- Becker et al. (2012) Becker, G. D., Sargent, W. L. W., Rauch, M., Carswell, R. F. 2012, ApJ, 744, 91
- Beers, Preston, & Shectman (1992) Beers T. C., Preston G. W., Shectman S. A., 1992, AJ, 103, 1987
- Bergemann, Pickering, & Gehren (2010) Bergemann M., Pickering J. C., Gehren T., 2010, MNRAS, 401, 1334
- Bergemann & Cescutti (2010) Bergemann M., Cescutti G., 2010, A&A, 522, A9
- Bergemann (2011) Bergemann M., 2011, MNRAS, 413, 2184
- Bonifacio et al. (2009) Bonifacio P., et al., 2009, A&A, 501, 519
- Cayrel et al. (2004) Cayrel R., et al., 2004, A&A, 416, 1117
- Chieffi & Limongi (2004) Chieffi A., Limongi M., 2004, ApJ, 608, 405
- Christlieb et al. (2001) Christlieb N., Green P. J., Wisotzki L., Reimers D., 2001, A&A, 375, 366
- Cooke et al. (2010) Cooke R., Pettini M., Steidel C. C., King L. J., Rudie G. C., Rakic O., 2010, MNRAS, 409, 679
- Cooke et al. (2011a) Cooke R., Pettini M., Steidel C. C., Rudie G. C., Jorgenson R. A., 2011a, MNRAS, 412, 1047
- Cooke et al. (2011b) Cooke R., Pettini M., Steidel C. C., Rudie G. C., Nissen P. E., 2011b, MNRAS, 417, 1534
- Cooke, Pettini, & Murphy (2012) Cooke R., Pettini M., Murphy M. T., 2012, MNRAS, 425, 347
- Dekker et al. (2000) Dekker H., D’Odorico S., Kaufer A., Delabre B., Kotzlowski H., 2000, in Iye M., Moorwood A. F. eds, Proc. SPIE 4008, Optical and IR Telescope instrumentation and Detectors, p. 534 Dekker H., D’Odorico S., Kaufer A., Delabre B., Kotzlowski H., 2000, SPIE, 4008, 534
- Dessauges-Zavadsky et al. (2007) Dessauges-Zavadsky M., Calura F., Prochaska J. X., D’Odorico S., Matteucci F., 2007, A&A, 470, 431
- Gratton et al. (2003) Gratton R. G., Carretta E., Claudi R., Lucatello S., Barbieri M., 2003, A&A, 404, 187
- Heger & Woosley (2010) Heger A., Woosley S. E., 2010, ApJ, 724, 341
- Izutani & Umeda (2010) Izutani N., Umeda H., 2010, ApJ, 720, L1
- Jenkins & Tripp (2006) Jenkins, E. B., & Tripp, T. M. 2006, ApJ, 637, 548
- Lai et al. (2008) Lai D. K., Bolte M., Johnson J. A., Lucatello S., Heger A., Woosley S. E., 2008, ApJ, 681, 1524
- Lodders, Plame, & Gail (2009) Lodders K., Plame H., Gail H.-P., 2009, Trümper J.E., ed., Landolt-Börnstein, New Series, Abundances of the Elements in the Solar System. Springer-Verlag, Berlin, p. 44
- McWilliam et al. (1995) McWilliam A., Preston G. W., Sneden C., Searle L., 1995, AJ, 109, 2757
- Mezzacappa (2005) Mezzacappa A., 2005, Ann. Rev. Nuc. Part. Sci., 55, 467
- Molaro et al. (2000) Molaro P., Bonifacio P., Centurión M., D’Odorico S., Vladilo G., Santin P., Di Marcantonio P., 2000, ApJ, 541, 54
- Morton (2003) Morton, D. C. 2003, ApJS, 149, 205
- Nakamura et al. (2001) Nakamura T., Umeda H., Iwamoto K., Nomoto K., Hashimoto M.-a., Hix W. R., Thielemann F.-K., 2001, ApJ, 555, 880
- Nissen et al. (2004) Nissen, P. E., Chen, Y. Q., Asplund, M., Pettini, M. 2004, A&A, 415, 993
- Nissen et al. (2007) Nissen P. E., Akerman C., Asplund M., Fabbian D., Kerber F., Kaufl H. U., Pettini M., 2007, A&A, 469, 319
- Ott, O’Connor, & Dasgupta (2011) Ott C., O’Connor E. P., Dasgupta B., 2011, DESY Proc. Ser. Hamburg Neutrinos from Supernova Explosions (HASE), Hamburg, Germany, p. 22
- Penprase et al. (2008) Penprase B. E., Sargent W. L. W., Martinez I. T., Prochaska J. X., Beeler D. J., 2008, in O’Shea B. W., Heger A., eds, AIP Conf. Proc. Vol. 990, First Stars III. Am. Inst. Phys., New York, p. 499
- Pettini et al. (1990) Pettini, M., Boksenberg, A., Hunstead, R. W. 1990, ApJ, 348, 48
- Pettini et al. (1997) Pettini M., King D. L., Smith L. J., Hunstead R. W., 1997, ApJ, 478, 536
- Pettini et al. (2008) Pettini M., Zych B. J., Steidel C. C., Chaffee F. H., 2008, MNRAS, 385, 2011
- Pettini & Cooke (2012) Pettini M., Cooke, R., 2012, MNRAS, 425, 2477
- Pettini & Cooke (2013) Pettini, M., Cooke, R. 2013, Proceedings of Science, in press (arXiv:1209.4783)
- Primas et al. (2000) Primas, F., Reimers, D., Wisotzki, L., et al. 2000, in Weiss A., Abel T. G., Hill V., eds Proc. MPA/ESO, The First Stars, Copper and Zinc Abundances in Metal-Poor Stars, Springer Berlin Heidelberg, p. 51
- Prochaska et al. (2001) Prochaska J. X., et al., 2001, ApJS, 137, 21
- Pruet et al. (2005) Pruet J., Woosley S. E., Buras R., Janka H.-T., Hoffman R. D., 2005, ApJ, 623, 325
- Ryan, Norris, & Bessell (1991) Ryan S. G., Norris J. E., Bessell M. S., 1991, AJ, 102, 303
- Sobeck, Lawler, & Sneden (2007) Sobeck J. S., Lawler J. E., Sneden C., 2007, ApJ, 667, 1267
- Spitzer & Jenkins (1975) Spitzer L., Jr., Jenkins E. B., 1975, ARA&A, 13, 133
- Umeda & Nomoto (2002) Umeda H., Nomoto K., 2002, ApJ, 565, 385
- Vladilo et al. (2001) Vladilo, G., Centurión, M., Bonifacio, P., & Howk, J. C. 2001, ApJ, 557, 1007
- Vogt et al. (1994) Vogt S. S., et al., 1994, in Crawford D. L., Craine, R. R., eds., Proc. SPIE Vol. 2198, Instrumentation in Astronomy VIII. SPIE, Bellingham, p. 362
- Wolfe, Gawiser, & Prochaska (2005) Wolfe A. M., Gawiser E., Prochaska J. X., 2005, ARA&A, 43, 861
- Wolfe et al. (1986) Wolfe A. M., Turnshek D. A., Smith H. E., Cohen R. D., 1986, ApJS, 61, 249
- Woosley & Weaver (1995) Woosley S. E., Weaver T. A., 1995, ApJS, 101, 181
- Yong et al. (2012) Yong D., et al., 2013, ApJ, 762, 27