DEEP CHANDRA MONITORING OBSERVATIONS OF NGC 4649: I. CATALOG OF SOURCE PROPERTIES
Abstract
We present the X-ray source catalog for the Chandra monitoring observations of the elliptical galaxy, NGC 4649. The galaxy has been observed with Chandra ACIS-S3 in six separate pointings, reaching a total exposure of 299 ks. There are 501 X-ray sources detected in the 0.3–8.0 keV band in the merged observation or in one of the six individual observations; 399 sources are located within the D25 ellipse. The observed 0.3–8.0 keV luminosities of these 501 sources range from erg s-1 to erg s-1. The 90% detection completeness limit within the D25 ellipse is erg s-1. Based on the surface density of background active galactic nuclei (AGNs) and detection completeness, we expect background AGNs among the catalog sources ( within the D25 ellipse). There are nine sources with luminosities greater than erg s-1, which are candidates for ultraluminous X-ray sources. The nuclear source of NGC 4649 is a low-luminosity AGN, with an intrinsic 2.0–8.0 keV X-ray luminosity of erg s-1. The X-ray colors suggest that the majority of the catalog sources are low-mass X-ray binaries (LMXBs). We find that 164 of the 501 X-ray sources show long-term variability, indicating that they are accreting compact objects. We discover four transient candidates and another four potential transients. We also identify 173 X-ray sources (141 within the D25 ellipse) that are associated with globular clusters (GCs) based on Hubble Space Telescope and ground-based data; these LMXBs tend to be hosted by red GCs. Although NGC 4649 has a much larger population of X-ray sources than the structurally similar early-type galaxies, NGC 3379 and NGC 4278, yet the X-ray source properties are comparable in all three systems.
Subject headings:
galaxies: active — galaxies: individual (NGC 4649) — globular clusters: general — X-rays: binaries — X-rays: galaxies1. INTRODUCTION
Low-mass X-ray binaries (LMXBs) are binaries composed of an accreting neutron star or black hole and a low-mass late-type companion star. As a trace fossil of the old stellar populations in early-type galaxies, the origin and evolution of LMXBs have received much attention since they were first discovered in the Milky Way (e.g., Giacconi, 1974). It has been found that a significant fraction (20%–70%) of LMXBs are residing in globular clusters (GCs; e.g., Sarazin et al. 2000; Angelini et al. 2001; Blanton et al. 2001; Kundu et al. 2002; Kim et al. 2006), suggesting that GCs play an important or even exclusive role in the formation of LMXBs (e.g, Verbunt & Lewin, 2006; Kundu et al., 2007; Humphrey & Buote, 2008).
With the subarcsecond angular resolution of Chandra, we are now able to reveal the X-ray binary (XRB) populations of distant (–30 Mpc) galaxies. X-ray color–color diagrams and X-ray luminosity functions (XLFs) have been used to probe the different XRB populations, e.g., LMXBs that are associated with old stellar populations and high-mass X-ray binaries (HMXBs) that are associated with young stellar populations (see Fabbiano 2006 for a review). Chandra observations have greatly extended the LMXB samples and improved our understanding of the formation and evolution of LMXBs and the role of GCs in these processes. Deep Chandra monitoring observations have also detected LMXB populations down to limiting luminosity of a few erg s-1, well within the luminosity range of Galactic LMXBs (e..g, Brassington et al., 2008, 2009).
NGC 4649 (M60) is a giant Virgo elliptical galaxy at a distance of Mpc. It has a companion spiral galaxy, NGC 4647, that is away in projection. Independent distance measurements indicate that the two galaxies are physically close to each other and are likely gravitationally interacting (e.g., Young et al., 2006, and references therein). Early-type galaxies are ideal targets for constructing relatively clean samples of LMXBs and studying the GC-LMXB association, as they have little contamination from the young HMXB populations and are in general abundant in GCs (e.g., Ashman & Zepf, 1998). NGC 4649 has a rich GC system (Harris, 1991), and earlier studies have shown that its X-ray source population is large, with 165 sources detected in a ks Chandra observation (Randall et al., 2004). It has a remarkably large number of sources with erg s-1, thus likely black-hole binaries; such large populations of luminous X-ray sources are rarely seen in elliptical galaxies. As part of a continuing effort to obtain deep Chandra LMXB samples and to probe their formation and evolution, we acquired an additional ks Chandra exposure of NGC 4649 in the year 2011, making a total exposure of ks. Combined with our previous deep observations of the early-type galaxies NGC 3379 (Brassington et al., 2008) and NGC 4278 (Brassington et al., 2009), these data provide unprecedented LMXB samples for constraining the nature of these XRB populations (e.g., Fragos et al., 2008; Kim et al., 2009). Multiepoch observations of NGC 4649 spanning years also allow variability studies and reveal the X-ray transient population that could pose crucial constraints to the processes and evolution of accretion disks in LMXBs (e.g., Fragos et al., 2009).
In this paper, we present a detailed Chandra source catalog for NGC 4649 along with analyses of X-ray properties and source variabilities. Detailed subsequent investigations and scientific interpretation of the X-ray source sample will be presented in future papers, e.g., studies of the XLFs (D.-W. Kim et al. 2012, in prep.), the GC population (Strader et al., 2012), and ultraluminous X-ray sources (ULXs; Roberts et al. 2012). In Section 2 we describe the observations and data reduction. In Section 3 we present the source catalog and describe the method used to create this catalogs. We discuss basic X-ray properties of the detected sources, including the radial profile of the LMXB surface density, the nuclear source, hardness ratios (HRs), X-ray colors, and variabilities. We also present optical identifications and GC-LMXB associations for this galaxy. We summarize in Section 4.
2. OBSERVATIONS AND DATA REDUCTION
NGC 4649 has been covered by six Chandra observations with the S3 chip of the Advanced CCD Imaging Spectrometer (ACIS; Garmire et al. 2003), spanning 11 years. Table 1 lists the six observations along with their exposure times, ranging from 14 ks to 102 ks. We reduced and analyzed the observational data using mainly the Chandra Interactive Analysis of Observations (CIAO) tools. 111See http://cxc.harvard.edu/ciao/ for details on CIAO. We used the chandra_repro script to reprocess the data with the latest calibration. The background light curve of each observation was then inspected and background flares were removed using the deflare CIAO script, which performed an iterative 3 clipping algorithm. The flare-cleaned exposure times are also listed in Table 1; the total usable exposure is 299.4 ks.
We registered the astrometric frames of all the observations to that of observation 12976, which has the longest exposure. We created a 0.3–8.0 keV image for each observation and searched for sources using wavdetect (Freeman et al., 2002) at a false-positive probability threshold of 10-6. Using the CIAO script reproject_aspect, we compared the source list of each individual observation to the source list of observation 12976, adopting a 3 matching radius and a residual rejection limit of 0.6, and then registered the astrometric frame of the given observation to that of observation 12976. We reprojected the registered observations to the frame of observation 12976 using reproject_events, and merged all the observations to create a master event file using dmmerge. The ACIS-S3 chip has different pointings for the six observations, and the average aim point (weighted by exposure time) is , .
We created images from the merged event file using the standard ASCA grade set (ASCA grades 0, 2, 3, 4, 6) for five bands (also listed in Table 2): 0.3–8.0 keV (full band; FB), 0.3–2.0 keV (soft band; SB), 2.0–8.0 keV (hard band; HB), 0.3–1.0 keV (soft band 1; SB1), and 1.0–2.0 keV (soft band 2; SB2). For each observation, we created exposure maps in these bands following the basic procedure outlined in Section 3.2 of Hornschemeier et al. (2001), which takes into account the effects of vignetting, gaps between the CCDs, bad-column filtering, bad-pixel filtering, and the spatially dependent degradation in quantum efficiency due to contamination on the ACIS optical-blocking filters. A photon index of was assumed in creating the exposure map, which is a typical value for XRBs (e.g., Irwin et al., 2003; Brassington et al., 2010). Merged exposure maps were then created from the exposure maps of the individual observations.
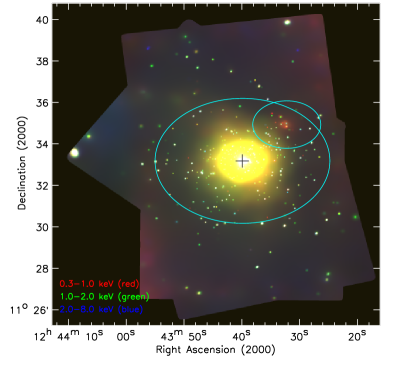
We constructed adaptively smoothed images from the raw images using the CIAO tool csmooth. Exposure-corrected smoothed images were then constructed following Section 3.3 of Baganoff et al. (2003). We show in Figure 1 a color composite of the exposure-corrected smoothed images in the SB1, SB2, and HB.
3. X-RAY SOURCE CATALOG
3.1. Source Detection and Photometry Extraction
X-ray sources in NGC 4649 were searched for in the merged FB image as well as the FB images for the six individual observations. We adopted a two-step source-detection approach. We first generated a candidate source list using wavdetect; then we utilized the acis extract (AE; Broos et al. 2010) program to remove low-significance sources (with AE binomial no-source probabilities ) from the candidate list, and composed the final catalog with the remaining sources. Such a two-step approach has been employed to create reliable Chandra source catalogs (e.g., Broos et al., 2007, 2011; Xue et al., 2011).
wavdetect was run with a “ sequence” of wavelet scales (i.e., 1, , 2, , 4, , 8, , and 16 pixels) and a false-positive probability threshold of 10-6. There were 471 X-ray sources detected in the merged observation, and 88–263 sources detected in the six individual observations. We merged the seven source lists using a matching radius of for sources within of the average aim point and for larger off-axis angles; for a source detected in multiple observations (including the merged one), we adopted its position from the observation with the longest exposure. The resulting candidate source list contains 517 X-ray sources. Given the 10-6 wavdetect threshold, we expect approximately eight false detections in the candidate list with this wavdetect approach (two from the merged observation and one from each of the six individual observations; Kim et al. 2004).
The photometry of the 517 candidate sources was extracted by AE. For each source in a given observation, AE constructed a polygonal source-count extraction region that approximates the encircled-energy fraction (EEF) contour of the point spread function (PSF) at 1.5 keV. Smaller extraction regions (as low as EEF) were used for sources in crowded regions to avoid source overlapping. Background counts were extracted by AE in an annular region around each source excluding the overlapping areas that belong to neighboring sources. The extracted source counts and background counts were summed up over all the observations, and the expected number of background counts in the source region was then calculated considering the scaling of the areas of the background and source regions. A background scaling factor of –30 was generally chosen by AE for our sources. The total numbers of extracted background counts in the merge observation range from to 250 for sources not in the galactic center (off-axis angle ), and toward the center the number increases rapidly, reaching a few thousand background counts for the innermost sources. Given the extract sources counts, background counts, and background scaling of a source, AE computed a binomial probability () of observing the source counts by chance under the assumption that there is no source at the location (all the observed counts are background). A larger value of indicates that the source has a larger chance of being a spurious detection. We adopted a threshold of to select reliable X-ray sources; 16 sources are removed this way (note that false detections are expected from the wavdetect approach). This threshold value was chosen to balance the goals of removing most of the spurious sources and of not missing too many real sources. The final catalog includes 501 X-ray sources. We note that some of the sources are not covered by all the six observations due to the different pointings and roll angles of the observations.
For each of the 501 sources, we derived its aperture-corrected net (background-subtracted) counts in the five bands (FB, SB, HB, SB1, SB2) based on the AE extraction results. AE provided EEFs at five energies (ranging from 0.28 to 8.60 keV) with the given extraction region, and thus we obtained the aperture correction for every band via interpolation. Source counts were computed in the merged observation as well as the six individual observations. For a given band and a given observation (including the merged one), we consider a source being detected if its value is smaller than 0.01 in this band and this observation; otherwise the source is flagged as undetected. All the 501 sources must have been detected in the FB in at least one of the observations based on our source-detection approach above. For detected sources, we adopted their AE-generated 1 errors (Gehrels, 1986) for the net counts, which were propagated through the errors of the extracted source and background counts following the numerical method described in Section 1.7.3 of Lyons (1991). For undetected sources, 3 upper limits on the net counts were calculated. If the extracted number of source counts is less than 10, we derived the upper limit using the Bayesian approach of Kraft et al. (1991) for the 99.87% () confidence level; otherwise, we calculated the 3 upper limit following the Poisson statistic (Gehrels, 1986). In the merged observation, the number of FB net counts has a range of –3870.
We estimated the source positional uncertainties using the empirical relation proposed by Kim et al. (2007). The positional uncertainty at the 95% confidence level is given by
| (1) |
where PU is the positional uncertainty in arcseconds, OAA is the off-axis angle in arcminutes, and NC is the number of FB source counts extracted by wavdetect.
X-ray flux and luminosity in the FB were calculated for each source in each observation, utilizing the photometric and spectral information extracted by AE. For a relatively bright source (FB net counts ), we fit the source spectrum using XSPEC (version 12.7.0; Arnaud 1996), employing an absorbed power-law model (tbabs*pow) with the Cash fitting statistic (CSTAT; Cash 1979). Both the photon index () and absorption were set as free parameters. The observed FB flux was then obtained from the best-fit model.
For the less luminous sources (FB net counts ), we did not adopt their fluxes from the spectral fitting. Instead, we converted their FB count rates to the FB fluxes using a count-rate-to-flux conversion relation that is a function of the source photon index (e.g., Luo et al., 2008; Xue et al., 2011); this conversion relation was calibrated using the count rates, fluxes, and photon indices of those more luminous sources above (FB net counts ). For a source that is faint (FB net counts ), we assumed to convert its count rate to flux. For the other sources (FB net counts in the range of 30–50), we still adopted their photon indices from the same absorbed power-law spectral fitting as above (with and absorption set free), and then converted their count rates to fluxes. In the two shortest observations, 8507 and 14328, there are not enough bright sources to constrain the count-rate-to-flux conversion, and thus we used the relation derived for the merged observation. For undetected sources, 3 upper limits on the fluxes were converted from the count-rate upper limits assuming .
FB luminosities were calculated given the FB fluxes and the distance of NGC 4649. The 1 errors of the fluxes and luminosities were propagated through the errors of the net counts.222We did not consider the flux or luminosity errors contributed by the uncertainties of the photon indices and/or the count-rate-to-flux conversion, which may be of the same order of magnitude as the errors propagated through the counts errors. Detailed spectral analyses are needed to properly determine the flux or luminosity errors, which are only possible for sources with sufficient counts. The flux or luminosities errors are not used in any scientific analyses in this work, and are only shown in some plots for illustration purposes. The luminosities have been corrected for Galactic absorption assuming (a factor of 1.055 for the FB); the corrections do not depend significantly on the photon indices and are accurate to a few percent. We did not correct for any intrinsic absorption if present; detailed spectral analyses are required to accurately determine the intrinsic luminosities. In the merged observation, the FB luminosity ranges from erg s-1 to erg s-1.
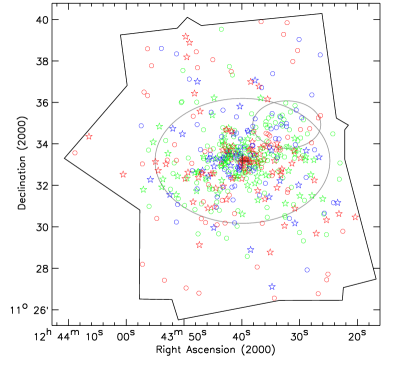
The positions of the 501 sources are indicated in Figure 2, divided into different luminosity bins. Within the Chandra field of view (D25 ellipse of NGC 4649), there are 32% (29%), 22% (22%), and 46% (49%) X-ray sources with FB luminosity erg s-1, erg s-1, and erg s-1, respectively.
3.2. Source Detection Completeness
The source detection completeness of the catalog varies across the field, mainly due to the different pointings and roll angles of the observations, the degradation of Chandra sensitivity at large off-axis angles, and the elevated background level near the galactic center originated from diffused gas emission. We performed simulations to assess the completeness of the catalog following the procedures described in Kim & Fabbiano (2004), taking into account the effects of flux detection limit and source confusion. In each simulation we added a mock X-ray sources at a random location on the event file of every observation using the MARX ray-tracing simulator,333See http://space.mit.edu/CXC/MARX/index.html. and then we applied the same image creation and source detection method as illustrated above to determine if this additional source is detectable. The input X-ray luminosity of the source was randomly drawn from a power-law XLF with in a cumulative form [], and we assumed a power-law spectrum for the source with . The position of the source was randomly selected following the law (de Vaucouleurs, 1948). We note that the adopted luminosity and position distributions here do not affect the completeness estimation significantly, as we only aimed to derive the positional-dependent detection fractions at a given luminosity. During the source filtering process (), instead of using AE to extract the source photometry, we adopted the wavdetect source and background counts, and assumed a typical background scaling factor of 16. This simplification greatly reduced the computation time and does not affect the simulation results significantly, as the chance of removing a detection is small during this step (16/517 for our source catalog above).
We performed 90,000 simulations in total, and we computed the probability of detecting a source with a given luminosity in a given region, utilizing the properties of all the simulated sources in this region. The 50% or 90% detection completeness limit in this region was then derived via interpolation. In Figure 3, we show the 50% and 90% completeness limits as a function of the galactic radius. The central 10″-radius area was excluded from the calculation as the completeness estimation is not reliable in this crowded region. The highest sensitivity is reached at a radius of , with a 50% (90%) completeness limit of () erg s-1. At larger radii, the sensitive drops due to the lower effective exposure; at smaller radii, the sensitive also drops because of the strong background level coming from diffused gas emission in the galactic center. The average 50% (90%) completeness limit of the D25 region is () erg s-1.

3.3. Radial Profile of X-ray Sources
The radial profiles of the number and density of X-ray sources are presented in Figure 4. We calculated X-ray source numbers and densities in annular regions centered on the galactic nucleus; the central 10″-radius area was excluded from the calculation. The 1 uncertainties of the surface densities were calculated based on the Poisson errors of the number of sources in each bin (Gehrels, 1986). We did not correct the source densities for detection incompleteness or background active galactic nucleus (AGN) contamination. We derived the expected background AGN numbers and densities based on the Gilli et al. (2007) AGN population-synthesis model, which was normalized to the AGN surface density observed in the Ms Chandra Deep Field-South (Xue et al., 2011). The computations of the AGN numbers and densities also took into account the detection incompleteness, by applying the positional- and luminosity-dependent detection probabilities derived in Section 3.2 above. There are background AGNs expected among the catalog sources, and background AGNs within the D25 ellipse of NGC 4649. It appears that even at large radius (), there are still some X-ray sources associated with the galaxy, although the number is limited (). There are 55 sources within the D25 ellipse of the companion galaxy, NGC 4647, which appears to be an overabundance of X-ray sources as indicated in Figure 4b and can be attributed to the sources belonging to NGC 4647. We estimate that sources belong to NGC 4649, are background AGNs, and the remaining belong to NGC 4647, given the radial profile of the source density.
There are 399 X-ray sources located within the D25 ellipse of NGC 4649, including background AGNs and NGC 4647 sources. The total number of X-ray sources in NGC 4649 is much larger than that of NGC 3379 or NGC 4278, with 98 sources within the D25 ellipse of NGC 3379 and 180 within the D25 ellipse of NGC 4278 (Brassington et al., 2008, 2009). The Chandra observations of NGC 3379 and NGC 4278 are actually deeper than those of NGC 4649 in terms of the limiting luminosity detected; the 90% completeness limit inside the D25 ellipse is erg s-1 for NGC 3379 (Kim et al., 2009), erg s-1 for NGC 4278 (Kim et al., 2009), and erg s-1 for NGC 4649. The high density of X-ray sources in NGC 4649 is probably due to the combination of its high optical/IR luminosity and high GC specific frequency (Boroson et al., 2011); it may also related the interaction with the companion galaxy, or the past interaction with the Virgo cluster members. These differences will be explored more in depth in D.-W. Kim et al. (2012, in prep.).


3.4. Nuclear Source and Ultraluminous X-Ray Sources
The nuclear X-ray source (XID 253) is 0.24″ away from the optical center of the galaxy.444This positional offset is dominated by the astrometric offset between the Chandra and optical images; see Section 3.7. There is no significant physical offset between the X-ray and optical positions. It has FB counts and an observed FB luminosity of erg s-1 in the merged observation. The nucleus of NGC 4649 was suggested to host a low-luminosity AGN powered by a radiatively inefficient accretion flow (e.g., Di Matteo & Fabian, 1997; Quataert & Narayan, 1999). A central AGN is also required to produced the observed X-ray cavities (Shurkin et al., 2008). We fit the AE-extracted spectrum of the nuclear source using XSPEC. The spectrum cannot be fit with a simple absorbed power-law model, and there is clearly a strong soft X-ray excess around 1 keV, which is typical among low-luminosity AGNs and is considered to originate from hot gas in the galactic nucleus (e.g., Ptak et al., 1999). We thus fit the spectrum with an absorbed power-law (AGN) plus thermal plasma (hot gas) model (wabs1*pow+wabs2*apec). The absorption column density for the thermal component was fixed at the Galactic value, and the plasma temperature, power-law photon index, and intrinsic absorption are free parameters. The resulting best fit is statistically acceptable (dof=0.93 and null hypothesis probability ), with temperature keV, photon index , and intrinsic absorption cm-2. The errors are at the 90% confidence level for one parameter of interest. The intrinsic 2.0–8.0 keV X-ray luminosity for the power-law component is erg s-1 after absorption correction, indicating its low-luminosity nature. This source is also variable based on the chi-square or flux variation test below (see Section 3.6). The power-law photon index of , moderate intrinsic absorption, and long-term variability confirm the nature of the nuclear source as a low-luminosity AGN (e.g., Turner et al., 1997; Risaliti et al., 2002).
There are nine sources (XIDs 73, 81, 106, 152, 171, 392, 421, 422, and 501) with ULX luminosities ( erg s-1) in the merged observation or one of the individual observations. It is probable that some of these sources are background AGNs instead of ULXs, as we expect background AGNs with ULX fluxes if placed at the distance of NGC 4649. In fact, XIDs 73 and 501 are located away from the nucleus, and thus have a higher chance of being background AGNs. Moreover, XID 152 was identified as a foreground star based on optical observations (see Section 3.7 below).
3.5. Hardness Ratios and X-Ray Colors
We calculated the HRs and X-ray colors of the sources to characterize their spectral properties. The X-ray HR is defined as HR=, and the X-ray colors are defined as SC= (soft color) and HC= (hard color), where , , , , and are the source count rates in the FB, SB, HB, SB1, and SB2, which have been corrected for Galactic absorption. The definition of the X-ray bands, HR, and colors are summarized in Table 2. To better constrain the HRs and colors and their associated errors in the low-count regime, we adopted the Bayesian approach developed by Park et al. (2006). This approach provides a rigorous statistical treatment of the Poisson nature of the detected photons as well as the non-Gaussian nature of the error propagation, and it takes directly the AE extracted source counts, background counts, and appropriate scaling factors as input parameters.
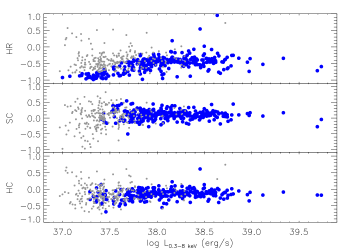
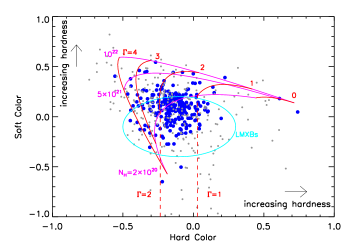
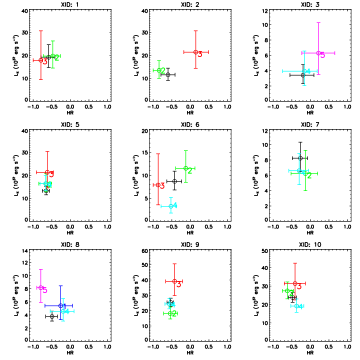
The luminosity–HR, luminosity–soft color, and luminosity–hard color plots are presented in Figure 5. There is no significant dependence of the HR or X-ray color on the X-ray luminosity. The X-ray color–color plot is shown in Figure 6. The red and magenta tracks (solid curves) show the expected X-ray colors from absorbed power-law spectra with different power-law indices and column densities. Sources outside the area enclosed by these tracks, are mostly soft-excess sources, of which the soft and hard colors cannot be simultaneously explained by an absorbed power-law spectrum. The soft excess probably originates from thermal gas emission if the source is close to the nucleus. For these soft-excess sources, we show two vertical red lines indicating the expected hard colors from unabsorbed power-law models with and (if absorption is present, the power-law index will be larger for a given hard color). The X-ray color–color plot can be used to separate the X-ray sources into groups that are likely dominated by certain source types (e.g., Colbert et al., 2004; Prestwich et al., 2003, 2009). In Figure 6, the cyan ellipse indicates the area that is likely dominated by LMXBs (Prestwich et al., 2003). A significant fraction () of the X-ray sources are located in the region dominated by LMXBs, most of which have –2.0 and no/little intrinsic absorption, as expected for the X-ray source population in an early-type galaxy (e.g., Fabbiano, 2006).
3.6. Source Variability and Transient Candidates
X-ray flux/spectral variability is a common feature among XRBs in galaxies, which is generally attributed to the change of physical properties of the accretion disks (e.g., Done et al., 2007; Brassington et al., 2010; Fabbiano et al., 2010). The six Chandra observations of NGC 4649 span years, allowing us to study the long-term variability of the X-ray sources and search for transient candidates.
We define long-term source variability using the chi-square test described in Brassington et al. (2009). For every source, we performed least squares fitting to the FB luminosities observed in the six individual observations with a flat line model. In cases where the source is not detected (but still covered by the observation), we set the luminosity to be the 1 upper limit with the same value as the errors. If the reduced chi-square value of the best-fit model is greater than 1.2 (), the source is determined to be variable; otherwise, it is non-variable. Of the 501 sources, 164 are variable, 331 are non-variable. The other six sources are covered by only one observation, and their long-term variabilities were not constrained. In Figure 7, we show the FB luminosity distributions of all the 501 sources (unshaded histogram) and the 164 variable sources (shaded histogram). We note that for sources covered by only a few observations or low-luminosity sources that have large uncertainties in the observed luminosities, the data are probably not able to reveal their variabilities. The fraction of variable sources in NGC 4649 (33%) is slightly smaller than that in NGC 3379 (42%) or NGC 4278 (44%). The difference may be partially caused by the different methods adopted to define source detections and calculate errors and upper limits, and it may be also related to the different depths probed by Chandra in these galaxies.

Besides the chi-square test, we further investigated the variation of the source fluxes by comparing the FB count rates between observations. For a source that was detected in at least one individual observation and was covered by at least two observations, we computed the maximum statistical significance of its flux variation between any two observations, defined as (e.g., Brassington et al., 2009; Sell et al., 2011):
| (2) |
where the subscripts and run over different observations, and , , , and are the count rates (or 3 upper limits if not detected) and their associated 1 errors. We consider a source to be variable if its parameter is greater than three (i.e., variation). The variation significances are list in Table 3; 49 sources are determined to be variable, all of which are also variable based on the chi-square test.
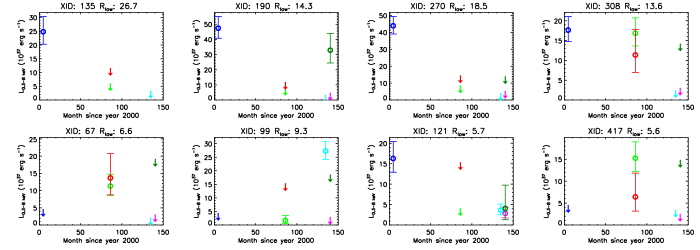
We searched for transient candidates following Brassington et al. (2009). For a source detected in one observation but not another, we calculated its 1 lower bound of the ratio between the “on-state” and “off-state” count rates, utilizing the Park et al. (2006) Bayesian approach and the AE extraction results. Such lower bounds of the ratios were calculated for all available pairs of observations. The source is considered as a transient candidate if the lowest value among all the lower bounds is greater than 10, or a potential transient candidate if the lowest value is between 5 and 10. We discovered four transient candidates (XIDs 135, 190, 270, and 308) and four potential transients (XIDs 67, 99, 121, and 417), and their light curves are displayed in Figure 8. As shown in the plot, four of these objects have a maximum luminosity erg s-1, likely being black-hole XRBs, and the other four all have a maximum luminosity erg s-1. All these eight sources are labeled as variable based on the chi-square or flux variation test. Note that strongly variable sources are not identified as transients if they are detected in all the observations. There are eight sources with (XIDs 70, 99, 152, 171, 235, 270, 421, and 486) in the catalog, six of which are not transient candidates; these six heavily variable sources are very luminous ( erg s-1).
Short-term variability for each source was examined when it has more than 20 FB counts in a single observation. We ran the Kolmogorov-Smirnov test to search for variability in the FB count rate and visually inspected the light curves of every candidate. After excluding sources showing only variability at the beginning or the end of an observation, we found one source, XID 421, that has a significant short-term variation in count rate. It is a ULX ( erg s-1) and also exhibits a significant long-term variability (=14.4). This source is discussed in more details in Roberts et al. (2012).
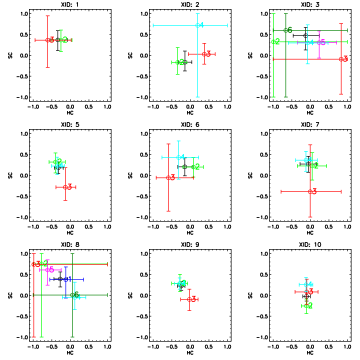
Furthermore, we explored source spectral variabilities. In Figure 9, we present the FB luminosities, HRs, and X-ray colors of each source in all six observation. In Figures 10 and 11, we show the luminosity–HR and color–color plots for each source in individual observations. It is evident that the spectral properties of the sources vary frequently beyond the 1 bounds, and both high/soft–low/hard and low/soft–high/hard spectral transitions are present, as have been observed in NGC 3379 and NGC 4278 (Brassington et al., 2008, 2009).
3.7. Optical Counterparts
We matched the X-ray sources to the GC catalog of NGC 4649 obtained via Hubble Space Telescope/Advanced Camera for Surveys (HST/ACS) observations (Strader et al., 2012). We first checked the astrometric transformation between the X-ray and optical images based on an initial list of high-probability matches between X-ray sources and GCs. We found a small but significant systematic offset ( in right ascension and in declination) between the Chandra and HST astrometry, which we corrected before matching. There was no evidence for significant higher-order terms in the astrometric transformation. Note that the source positions presented in this paper follow the Chandra astrometry.
Most putative matches were within 0.5″; we thus used 0.6″ as our limit for reliable X-ray to GC matches. There are 157 matches by this criterion. A further 4 objects have offsets between ; we consider these as possible matches.
There are X-ray sources outside of the field of view of the HST/ACS mosaic presented in Strader et al. (2012). We thus searched for matches between these sources and the ground-based photometric GC catalog of Lee et al. (2008), using the same astrometric criteria as for the HST matches. We found 12 X-ray sources that appear to be associated with these photometric GCs. All matches are with relatively luminous clusters. These are considered as reliable matches, but because these GC candidates are not resolved, it is possible that a few of them are background contaminants.
Of the X-ray sources within the HST/ACS mosaic that do not match to GCs, many are nonetheless associated with an optical source. 17 are candidate background galaxies for which the sources are likely to be AGNs. One other source (XID 144) matches an unusual dwarf galaxy that is discussed in a separate paper (J. Strader et al. 2012, in prep.). In two cases the matches are with relatively luminous point sources that appear to be foreground stars. One optical counterpart is the nucleus of NGC 4649. As discussed in Section 3.3, we expect sources belonging to the companion galaxy NGC 4647. Based on the HST/ACS and Sloan Digital Sky Survey (SDSS; York et al. 2000) images, we selected 35 X-ray sources that are located where the underlying optical light is dominated by NGC 4647 (ratio of NGC 4647 to NGC 4649 light is very high). We further identified 8 sources located where the optical light is likely dominated by NGC 4647 (these 8 sources are around the edge of the D25 ellipse of NGC 4647). These 35 plus 8 sources are the likely candidates for the expected NGC 4647 sources; they also have the chance of being associated with NGC 4649 or being a background AGN. The remaining 264 X-ray sources ( of the total) are not associated with any obvious optical source, 201 of which are within the D25 ellipse and most of these sources are likely to be LMXBs in the field of NGC 4649.
There are 173 sources in total that have a GC counterpart, and their positions are shown in Figure 2; 141 (82%) of these objects are within the D25 ellipse. Considering those X-ray sources within the D25 ellipse and outside 10″ of the galactic center, the fraction of GC-LMXBs is (140/387). This value is in between of the GC-LMXB fractions found in NGC 3379 (24%) and NGC 4278 (47%; Kim et al. 2009), likely consistent with previous findings (e.g., Juett, 2005; Kim et al., 2006, 2009) that the GC-LMXB fraction increases with increasing GC specific frequency (1.2, 6.9, and 5.2 for NGC 3379, NGC 4278, and NGC 4649, respectively; Boroson et al. 2011). We caution that the completeness limit differs among these galaxies (see Section 3.3), and thus the GC-LMXB fractions may not be directly comparable; the relation between the GC-LMXB fraction and GC specific frequency will be explored in more detail in D.-W. Kim et al. (2012, in prep.).
The GC-LMXB associations are slightly more X-ray luminous than the entire X-ray sample on average, as shown in Figure 12a (median luminosity erg s-1 vs. erg s-1). The relative lack of low-luminosity GC-LMXBs when compared with field LMXBs was previously reported and discussed in Kim et al. (2009), which may be an intrinsic feature of the LMXB populations. The fraction of variable sources among GC-LMXBs (34%) is comparable to that for the entire sample (33%).
None of the eight transient or potential transient candidates is matched to a GC. For the nine sources with ULX luminosities, one (XID 152) was identified as a foreground star, and another four (XIDs 81, 171, 392, and 421) have a secure GC counterpart. We investigated the color distribution of the GC-LMXBs, using the colors (HST F475W and F850LP filters) for the 161 GC-LMXB associations obtained from Strader et al. (2012). The color histogram is displayed in Figure 12b. The median color value is 1.44 with an interquartile range of 1.29–1.54. Therefore, the LMXBs in NGC 4649 are preferentially hosted by red GCs, consistent with previous findings of the GC-LMXB connection in other galaxies, and likely indicating the importance of metallicity in the formation of GC-LMXBs (e.g., Sarazin et al., 2003; Jordán et al., 2004; Kim et al., 2006; Paolillo et al., 2011).
3.8. Source Catalog
Photometric properties for the 501 X-ray sources are presented in Tables 3–10. The details of the Table 3 columns are listed below.
-
1.
Column 1: the X-ray source identification number (XID). Sources are listed in order of increasing right ascension.
-
2.
Column 2: the source name following the IAU convention (CXOU Jhhmmss.sddmmss).
-
3.
Columns 3 and 4: the right ascension and declination of the X-ray source, respectively.
-
4.
Column 5: the radial distance of the source to the nucleus of NGC 4649, in units of arcminutes.
-
5.
Column 6: the source positional uncertainty at the 95% confidence level, in units of arcseconds (see Section 3.1).
-
6.
Column 7: the logarithm of the observed FB luminosity, in units of erg s-1. A 3 upper limit is given if the source is not detected in the FB.
-
7.
Column 8: the long-term variability flag (see Section 3.5). The source is labeled as variable (“V”), non-variable (“N”), transient candidate (“TC”), or potential transient candidate (“PTC”). All transient candidates are variable.
-
8.
Column 9: the maximum statistical significance of the FB flux variation between any two observations (see Section 3.5). It is set to “” if the source is not covered by at least two observations or not detected in at least one observation.
-
9.
Column 10: the positional flag. The source may be located within the D25 ellipse of NGC 4649 (“1”), within the D25 ellipse of NGC 4647 (“2”), within both D25 ellipses (“3”), or outside the ellipses (“0”).
-
10.
Column 11: the note on the optical counterpart. The source may have a reliable HST GC counterpart (“1”; 157 sources), a probable HST GC counterpart (“2”; 4 sources), a ground-based GC counterpart (“3”; 12 sources), a background AGN counterpart (“4”; 17 sources), a counterpart that is an unusual dwarf galaxy (“5”; 1 source), a counterpart that is the nucleus of NGC 4649 (“6”; 1 source), a counterpart that is a foreground star (“7”; 2 sources), or it has a high chance () of being associated with the companion galaxy NGC 4647 (“8”; 35 sources), it has a less significant chance of being associated with NGC 4647 (“9”; 8 sources), or it is associated with NGC 4649 but having no counterpart (“0”; 264 sources).
-
11.
Column 12: the GC ID from Strader et al. (2012) or Lee et al. (2008; starting with the letter “L”) for the 173 X-rays sources with a GC counterpart.
In Table 4, we list source properties including the net counts in the five bands (Section 3.1), HRs (Section 3.4), and X-ray colors (Section 3.4) and their associated 1 errors in the merged observation. In Tables 5–10, we present these properties in the six individual observations. Note that a single observation does not cover all the sources.
4. Summary
We have presented a catalog and basic analyses of the X-ray sources detected in NGC 4649. The key results are summarized in the following:
-
1.
NGC 4649 has been covered by six Chandra ACIS-S3 observations, with a total cleaned exposure of 299.4 ks.
-
2.
The Chandra source catalog consists of 501 sources that were detected following a two-step source-detection approach using wavdetect and AE. First, 517 candidate sources were detected in the merged and individual FB images using wavdetect with a false-positive probability threshold of . Then we filtered out 16 less-significant candidates using the AE no-source probability parameter. The resulting source catalog is highly reliable.
-
3.
The source photometry was extracted by AE, using polygonal source-count extraction regions to approximate the shape of the PSF. In order to study source variability, photometry was derived for the merged observation as well as the six individual observations. In the merged observation, the number of FB net counts ranges from to , and the FB luminosity ranges from erg s-1 to erg s-1.
-
4.
We performed simulations to assess the source detection completeness. The average 50% (90%) completeness limit of the D25 region is () erg s-1. There are () background AGNs expected among the catalog sources (within the D25 ellipse). Of the 501 catalog sources, 399 are located within the D25 ellipse of NGC 4649, and 55 within the D25 ellipse of NGC 4647. We estimate that sources are associated with NGC 4647, given the radial profile of the source density. NGC 4649 hosts a larger population of X-ray sources compared to NGC 3379 or NGC 4278.
-
5.
The nuclear source is a low-luminosity AGN, with an intrinsic 2.0–8.0 keV X-ray luminosity of erg s-1. The spectrum also shows a thermal component from the nuclear hot-gas emission at keV. There are nine sources with ULX luminosities.
-
6.
We derived HRs and X-ray colors for the catalog sources in the merged observation and the six individual observations, adopting a Bayesian approach to deal with the Poisson nature of the detected photons as well as the non-Gaussian nature of the error propagation. In the X-ray color–color plot, a significant fraction () of the X-ray sources are located in the region dominated by LMXBs, with –2.0 and no/little intrinsic absorption.
-
7.
We investigated the long-term variability of the X-ray sources. The chi-square test revealed 164 variable sources, 49 of which have more than variation in observed fluxes. We identified four transient candidates and four potential transient candidates based on the ratio of the count rates. X-ray spectral variabilities are also present among the catalog sources.
-
8.
We identified 173 GC-LMXB associations based on HST and ground-based data. These GC-LMXBs appear to be slightly more X-ray luminous than the entire X-ray sample on average, and the fraction of variable GC-LMXBs is comparable to that for the entire sample. The GC-LMXBs tend to have red colors.


We acknowledge financial support from NASA HST grant GO-12369.01-A (BL, GF), CXC grant GO1-12110X (BL, GF), and NSF grant AST-0808099 (JPB). We acknowledge support from the CXC, which is operated by the Smithsonian Astrophysical Observatory (SAO) for and on behalf of NASA under Contract NAS8-03060. GF and TF thank the Aspen Center for Physics. TF acknowledges support from the CfA and the ITC prize fellowship programs, and JSG thanks the University of Wisconsin Graduate School and College of Letters Science for their research support. We thank the referee for carefully reviewing the manuscript and providing constructive comments.
References
- Abazajian et al. (2009) Abazajian, K. N., Adelman-McCarthy, J. K., Agüeros, M. A., et al. 2009, ApJS, 182, 543
- Angelini et al. (2001) Angelini, L., Loewenstein, M., & Mushotzky, R. F. 2001, ApJ, 557, L35
- Arnaud (1996) Arnaud, K. A. 1996, in ASP Conf. Ser., Vol. 101, Astronomical Data Analysis Software and Systems V, ed. G. H. Jacoby & J. Barnes, 17
- Ashman & Zepf (1998) Ashman, K. M., & Zepf, S. E. 1998, Globular Cluster Systems (Cambridge: Cambridge Univ. Press)
- Baganoff et al. (2003) Baganoff, F. K., Maeda, Y., Morris, M., et al. 2003, ApJ, 591, 891
- Blakeslee et al. (2009) Blakeslee, J. P., Jordán, A., Mei, S., et al. 2009, ApJ, 694, 556
- Blanton et al. (2001) Blanton, E. L., Sarazin, C. L., & Irwin, J. A. 2001, ApJ, 552, 106
- Boroson et al. (2011) Boroson, B., Kim, D.-W., & Fabbiano, G. 2011, ApJ, 729, 12
- Brassington et al. (2010) Brassington, N. J., Fabbiano, G., Blake, S., et al. 2010, ApJ, 725, 1805
- Brassington et al. (2008) Brassington, N. J., Fabbiano, G., Kim, D.-W., et al. 2008, ApJS, 179, 142
- Brassington et al. (2009) —. 2009, ApJS, 181, 605
- Broos et al. (2007) Broos, P. S., Feigelson, E. D., Townsley, L. K., et al. 2007, ApJS, 169, 353
- Broos et al. (2010) Broos, P. S., Townsley, L. K., Feigelson, E. D., et al. 2010, ApJ, 714, 1582
- Broos et al. (2011) —. 2011, ApJS, 194, 2
- Cash (1979) Cash, W. 1979, ApJ, 228, 939
- Colbert et al. (2004) Colbert, E. J. M., Heckman, T. M., Ptak, A. F., Strickland, D. K., & Weaver, K. A. 2004, ApJ, 602, 231
- de Vaucouleurs (1948) de Vaucouleurs, G. 1948, Annales d’Astrophysique, 11, 247
- de Vaucouleurs et al. (1991) de Vaucouleurs, G., de Vaucouleurs, A., Corwin, Jr., H. G., et al. 1991, Third Reference Catalogue of Bright Galaxies, ed. N. G. Roman et al. (New York: Springer)
- Di Matteo & Fabian (1997) Di Matteo, T., & Fabian, A. C. 1997, MNRAS, 286, L50
- Dickey & Lockman (1990) Dickey, J. M., & Lockman, F. J. 1990, ARA&A, 28, 215
- Done et al. (2007) Done, C., Gierliński, M., & Kubota, A. 2007, A&A Rev., 15, 1
- Fabbiano (2006) Fabbiano, G. 2006, ARA&A, 44, 323
- Fabbiano et al. (2010) Fabbiano, G., Brassington, N. J., Lentati, L., et al. 2010, ApJ, 725, 1824
- Fragos et al. (2008) Fragos, T., Kalogera, V., Belczynski, K., et al. 2008, ApJ, 683, 346
- Fragos et al. (2009) Fragos, T., Kalogera, V., Willems, B., et al. 2009, ApJ, 702, L143
- Freeman et al. (2002) Freeman, P. E., Kashyap, V., Rosner, R., & Lamb, D. Q. 2002, ApJS, 138, 185
- Garmire et al. (2003) Garmire, G. P., Bautz, M. W., Ford, P. G., Nousek, J. A., & Ricker, Jr., G. R. 2003, Proc. SPIE, 4851, 28
- Gehrels (1986) Gehrels, N. 1986, ApJ, 303, 336
- Giacconi (1974) Giacconi, R. 1974, in Astrophysics and Space Science Library, Vol. 43, X-ray Astronomy, ed. R. Giacconi & H. Gursky, 155
- Gilli et al. (2007) Gilli, R., Comastri, A., & Hasinger, G. 2007, A&A, 463, 79
- Harris (1991) Harris, W. E. 1991, ARA&A, 29, 543
- Hornschemeier et al. (2001) Hornschemeier, A. E., Brandt, W. N., Garmire, G. P., et al. 2001, ApJ, 554, 742
- Humphrey & Buote (2008) Humphrey, P. J., & Buote, D. A. 2008, ApJ, 689, 983
- Irwin et al. (2003) Irwin, J. A., Athey, A. E., & Bregman, J. N. 2003, ApJ, 587, 356
- Jordán et al. (2004) Jordán, A., Côté, P., Ferrarese, L., et al. 2004, ApJ, 613, 279
- Juett (2005) Juett, A. M. 2005, ApJ, 621, L25
- Kim et al. (2004) Kim, D., Cameron, R. A., Drake, J. J., et al. 2004, ApJS, 150, 19
- Kim & Fabbiano (2004) Kim, D.-W., & Fabbiano, G. 2004, ApJ, 611, 846
- Kim et al. (2009) Kim, D.-W., Fabbiano, G., Brassington, N. J., et al. 2009, ApJ, 703, 829
- Kim et al. (2006) Kim, E., Kim, D.-W., Fabbiano, G., et al. 2006, ApJ, 647, 276
- Kim et al. (2007) Kim, M., Kim, D.-W., Wilkes, B. J., et al. 2007, ApJS, 169, 401
- Kraft et al. (1991) Kraft, R. P., Burrows, D. N., & Nousek, J. A. 1991, ApJ, 374, 344
- Kundu et al. (2002) Kundu, A., Maccarone, T. J., & Zepf, S. E. 2002, ApJ, 574, L5
- Kundu et al. (2007) —. 2007, ApJ, 662, 525
- Lee et al. (2008) Lee, M. G., Hwang, H. S., Park, H. S., et al. 2008, ApJ, 674, 857
- Luo et al. (2008) Luo, B., Bauer, F. E., Brandt, W. N., et al. 2008, ApJS, 179, 19
- Lyons (1991) Lyons, L. 1991, Data Analysis for Physical Science Students (Cambridge: Cambridge Univ. Press)
- Paolillo et al. (2011) Paolillo, M., Puzia, T. H., Goudfrooij, P., Zepf, S. E., Maccarone, T. J., Kundu, A., Fabbiano, G., & Angelini, L. 2011, ApJ, 736, 90
- Park et al. (2006) Park, T., Kashyap, V. L., Siemiginowska, A., et al. 2006, ApJ, 652, 610
- Prestwich et al. (2003) Prestwich, A. H., Irwin, J. A., Kilgard, R. E., et al. 2003, ApJ, 595, 719
- Prestwich et al. (2009) Prestwich, A. H., Kilgard, R. E., Primini, F., McDowell, J. C., & Zezas, A. 2009, ApJ, 705, 1632
- Ptak et al. (1999) Ptak, A., Serlemitsos, P., Yaqoob, T., & Mushotzky, R. 1999, ApJS, 120, 179
- Quataert & Narayan (1999) Quataert, E., & Narayan, R. 1999, ApJ, 520, 298
- Randall et al. (2004) Randall, S. W., Sarazin, C. L., & Irwin, J. A. 2004, ApJ, 600, 729
- Risaliti et al. (2002) Risaliti, G., Elvis, M., & Nicastro, F. 2002, ApJ, 571, 234
- Roberts et al. (2012) Roberts, T. P., Fabbiano, G., Luo, B., et al. 2012, ApJ, in press
- Sarazin et al. (2000) Sarazin, C. L., Irwin, J. A., & Bregman, J. N. 2000, ApJ, 544, L101
- Sarazin et al. (2003) Sarazin, C. L., Kundu, A., Irwin, J. A., et al. 2003, ApJ, 595, 743
- Sell et al. (2011) Sell, P. H., Pooley, D., Zezas, A., et al. 2011, ApJ, 735, 26
- Shurkin et al. (2008) Shurkin, K., Dunn, R. J. H., Gentile, G., Taylor, G. B., & Allen, S. W. 2008, MNRAS, 383, 923
- Strader et al. (2012) Strader, J., Fabbiano, G., Luo, B., et al. 2012, ApJ, in press
- Turner et al. (1997) Turner, T. J., George, I. M., Nandra, K., & Mushotzky, R. F. 1997, ApJS, 113, 23
- Verbunt & Lewin (2006) Verbunt, F., & Lewin, W. H. G. 2006, Globular cluster X-ray sources, ed. W. H. G. Lewin & M. van der Klis, 341–379
- Xue et al. (2011) Xue, Y. Q., Luo, B., Brandt, W. N., et al. 2011, ApJS, 195, 10
- York et al. (2000) York, D. G., Adelman, J., Anderson, Jr., J. E., et al. 2000, AJ, 120, 1579
- Young et al. (2006) Young, L. M., Rosolowsky, E., van Gorkom, J. H., & Lamb, S. A. 2006, ApJ, 650, 166
| Obs. # | Obs. ID | Start Date | Exp (ks) | Cleaned Exp (ks) | PI |
|---|---|---|---|---|---|
| (1) | (2) | (3) | (4) | (5) | (6) |
| 1 | 785 | 2000 Apr 20 | 37.4 | 34.2 | C. L. Sarazin |
| 2 | 8182 | 2007 Jan 30 | 53.0 | 49.2 | P. Humphrey |
| 3 | 8507 | 2007 Feb 1 | 17.8 | 17.3 | P. Humphrey |
| 4 | 12976 | 2011 Feb 24 | 102.4 | 100.3 | G. Fabbiano |
| 5 | 12975 | 2011 Aug 8 | 86.1 | 84.4 | G. Fabbiano |
| 6 | 14328 | 2011 Aug 12 | 14.2 | 14.0 | G. Fabbiano |
Note. — Column 1: observation number, in order of the start date. Column 2: Chandra observation identification number. Column 3: observation start date. Column 4: nominal exposure time. Column 5: exposure time after removing background flares. Column 6: name of the Principal Investigator.
| Band | Definition |
|---|---|
| Full band (FB) | 0.3–8.0 keV |
| Soft band (SB) | 0.3–2.0 keV |
| Hard band (HB) | 2.0–8.0 keV |
| Soft band 1 (SB1) | 0.3–1.0 keV |
| Soft band 2 (SB2) | 1.0–2.0 keV |
| Hardness ratio (HR) | |
| Soft X-ray color (SC) | |
| Hard X-ray color (HC) |
Note. — , , , , and are the source count rates in the FB, SB, HB, SB1, and SB2.
| XID | CXOU Name | RA (J2000) | Dec (J2000) | Dist (’) | PU (”) | Var | Flag | Note | GCID | ||
|---|---|---|---|---|---|---|---|---|---|---|---|
| (1) | (2) | (3) | (4) | (5) | (6) | (7) | (8) | (9) | (10) | (11) | (12) |
| 1 | J124320.4113028 | 12:43:20.42 | 11:30:27.5 | 5.50 | 1.4 | 38.28 | N | 0.1 | 0 | 3 | L282 |
| 2 | J124322.6112946 | 12:43:22.57 | 11:29:46.3 | 5.45 | 1.1 | 38.06 | V | 0.9 | 0 | 0 | … |
| 3 | J124323.1113304 | 12:43:23.06 | 11:33:04.0 | 4.14 | 1.2 | 37.53 | N | 0.6 | 0 | 0 | … |
| 4 | J124323.2113217 | 12:43:23.18 | 11:32:17.1 | 4.21 | 2.1 | 37.45 | N | -1.0 | 0 | 0 | … |
| 5 | J124323.2113037 | 12:43:23.25 | 11:30:37.1 | 4.82 | 0.6 | 38.12 | N | 0.7 | 0 | 3 | L374 |
| 6 | J124323.5113109 | 12:43:23.47 | 11:31:09.0 | 4.52 | 0.9 | 37.94 | V | 2.2 | 0 | 3 | L223 |
| 7 | J124324.2113109 | 12:43:24.21 | 11:31:09.3 | 4.35 | 0.9 | 37.92 | N | 0.0 | 0 | 0 | … |
| 8 | J124324.3113428 | 12:43:24.29 | 11:34:28.3 | 4.06 | 0.7 | 37.58 | N | 1.2 | 0 | 0 | … |
Note. — Col. (1): source number. Col. (2): IAU name. Cols. (3) and (4): source right ascension and declination. Col. (5): radial distance of the source to the nucleus, in units of arcminutes. Col. (6): positional uncertainty, in units of arcseconds. Col. (7): logarithmic FB luminosity, in units of erg s-1. A 3 upper limit is given if the source is not detected in the FB. Col. (8): long-term variability flag (see Section 3.4). The source is labeled as variable (V), non-variable (N), transient candidate (TC), or possible transient candidate (PTC). Col. (9): maximum statistical significance of the FB flux variation between any two observations (see Section 3.4). It is set to “’ if this flux variation is not available. Col. (10): positional flag, outside the D25 ellipses of NGC 4649 and NGC 4647 (“0’), within the D25 ellipses of NGC 4649 only (“1’), within the D25 ellipses of NGC 4647 only (“2’), or within both D25 ellipses (“3’). Col. (11): note on the optical association; see Section 3.8 for details. Col. (12): GC ID from J. Strader et al. (2012, in prep.) or Lee et al. (2008; starting with the letter “L”); see Section 3.8 for details. (This table is available in its entirety in a machine-readable form in the online journal. A portion is shown here for guidance regarding its form and content.)
| Net Counts | |||||||||
|---|---|---|---|---|---|---|---|---|---|
| XID | FB | SB | HB | SB1 | SB2 | HR | SC | HC | |
| (1) | (2) | (3) | (4) | (5) | (6) | (7) | (8) | (9) | (10) |
| 1 | 38.28 | ||||||||
| 2 | 38.06 | ||||||||
| 3 | 37.53 | ||||||||
| 4 | 37.45 | ||||||||
| 5 | 38.12 | ||||||||
| 6 | 37.94 | ||||||||
| 7 | 37.92 | ||||||||
| 8 | 37.58 | ||||||||
Note. — Col. (1): source number. Cols. (2)–(6): source counts and the associated 1 errors in the FB, SB, HB, SB1, and SB2. A 3 upper limit is given if the source is not detected in the given band. Col. (7): hardness ratio and the associated 1 errors. Cols. (8) and (9): soft and hard X-ray colors and the associated 1 errors. Col. (10): logarithmic FB luminosity, in units of erg s-1. A 3 upper limit is given if the source is not detected in the FB. (This table is available in its entirety in a machine-readable form in the online journal. A portion is shown here for guidance regarding its form and content.)
| Net Counts | |||||||||
|---|---|---|---|---|---|---|---|---|---|
| XID | FB | SB | HB | SB1 | SB2 | HR | SC | HC | |
| (1) | (2) | (3) | (4) | (5) | (6) | (7) | (8) | (9) | (10) |
| 1 | … | … | … | … | … | … | … | … | … |
| 2 | … | … | … | … | … | … | … | … | … |
| 3 | … | … | … | … | … | … | … | … | … |
| 4 | … | … | … | … | … | … | … | … | … |
| 5 | … | … | … | … | … | … | … | … | … |
| 6 | … | … | … | … | … | … | … | … | … |
| 7 | … | … | … | … | … | … | … | … | … |
| 8 | 37.73 | ||||||||
Note. — Columns are the same as those in Table 4 but for observation 1. There are no entries for sources not covered by this observation. (This table is available in its entirety in a machine-readable form in the online journal. A portion is shown here for guidance regarding its form and content.)
| Net Counts | |||||||||
|---|---|---|---|---|---|---|---|---|---|
| XID | FB | SB | HB | SB1 | SB2 | HR | SC | HC | |
| (1) | (2) | (3) | (4) | (5) | (6) | (7) | (8) | (9) | (10) |
| 1 | 38.29 | ||||||||
| 2 | 38.13 | ||||||||
| 3 | 38.00 | ||||||||
| 4 | 37.85 | ||||||||
| 5 | 38.21 | ||||||||
| 6 | 38.06 | ||||||||
| 7 | 37.79 | ||||||||
| 8 | 38.07 | ||||||||
Note. — Columns are the same as those in Table 4 but for observation 2. There are no entries for sources not covered by this observation. (This table is available in its entirety in a machine-readable form in the online journal. A portion is shown here for guidance regarding its form and content.)
| Net Counts | |||||||||
|---|---|---|---|---|---|---|---|---|---|
| XID | FB | SB | HB | SB1 | SB2 | HR | SC | HC | |
| (1) | (2) | (3) | (4) | (5) | (6) | (7) | (8) | (9) | (10) |
| 1 | 38.25 | ||||||||
| 2 | 38.33 | ||||||||
| 3 | 38.41 | ||||||||
| 4 | 38.14 | ||||||||
| 5 | 38.33 | ||||||||
| 6 | 37.90 | ||||||||
| 7 | 38.35 | ||||||||
| 8 | 38.55 | ||||||||
Note. — Columns are the same as those in Table 4 but for observation 3. There are no entries for sources not covered by this observation. (This table is available in its entirety in a machine-readable form in the online journal. A portion is shown here for guidance regarding its form and content.)
| Net Counts | |||||||||
|---|---|---|---|---|---|---|---|---|---|
| XID | FB | SB | HB | SB1 | SB2 | HR | SC | HC | |
| (1) | (2) | (3) | (4) | (5) | (6) | (7) | (8) | (9) | (10) |
| 1 | … | … | … | … | … | … | … | … | … |
| 2 | 38.21 | ||||||||
| 3 | 37.59 | ||||||||
| 4 | 37.58 | ||||||||
| 5 | 38.21 | ||||||||
| 6 | 37.51 | ||||||||
| 7 | 37.82 | ||||||||
| 8 | 37.66 | ||||||||
Note. — Columns are the same as those in Table 4 but for observation 4. There are no entries for sources not covered by this observation. (This table is available in its entirety in a machine-readable form in the online journal. A portion is shown here for guidance regarding its form and content.)
| Net Counts | |||||||||
|---|---|---|---|---|---|---|---|---|---|
| XID | FB | SB | HB | SB1 | SB2 | HR | SC | HC | |
| (1) | (2) | (3) | (4) | (5) | (6) | (7) | (8) | (9) | (10) |
| 1 | … | … | … | … | … | … | … | … | … |
| 2 | … | … | … | … | … | … | … | … | … |
| 3 | 37.80 | ||||||||
| 4 | 37.52 | ||||||||
| 5 | … | … | … | … | … | … | … | … | … |
| 6 | … | … | … | … | … | … | … | … | … |
| 7 | … | … | … | … | … | … | … | … | … |
| 8 | 37.91 | ||||||||
Note. — Columns are the same as those in Table 4 but for observation 5. There are no entries for sources not covered by this observation. (This table is available in its entirety in a machine-readable form in the online journal. A portion is shown here for guidance regarding its form and content.)
| Net Counts | |||||||||
|---|---|---|---|---|---|---|---|---|---|
| XID | FB | SB | HB | SB1 | SB2 | HR | SC | HC | |
| (1) | (2) | (3) | (4) | (5) | (6) | (7) | (8) | (9) | (10) |
| 1 | … | … | … | … | … | … | … | … | … |
| 2 | … | … | … | … | … | … | … | … | … |
| 3 | 38.75 | ||||||||
| 4 | 38.40 | ||||||||
| 5 | … | … | … | … | … | … | … | … | … |
| 6 | … | … | … | … | … | … | … | … | … |
| 7 | … | … | … | … | … | … | … | … | … |
| 8 | 38.34 | ||||||||
Note. — Columns are the same as those in Table 4 but for observation 6. There are no entries for sources not covered by this observation. (This table is available in its entirety in a machine-readable form in the online journal. A portion is shown here for guidance regarding its form and content.)