Attention Competition with Advertisement
Abstract
In the new digital age, information is available in large quantities. Since information consumes primarily the attention of its recipients, the scarcity of attention is becoming the main limiting factor. In this study, we investigate the impact of advertisement pressure on a cultural market where consumers have a limited attention capacity. A model of competition for attention is developed and investigated analytically and by simulation. Advertisement is found to be much more effective when attention capacity of agents is extremely scarce. We have observed that the market share of the advertised item improves if dummy items are introduced to the market while the strength of the advertisement is kept constant.
I Markets
Traditionally every product or service has a price tag. In order to get it, one has to pay the price. Nowadays, the price of items in some markets becomes so low, even to the point of free-of-charge, that this concept of “pay-to-get” is challenged, especially in the era of Internet. It is quite a common fact that one can get many products and services paying absolutely nothing. Among these are internet search (Google, Yahoo), email (Gmail, Hotmail), storage (DropBox, Google, Yahoo), social networks (Facebook, Twitter, LinkedIn), movie storage (Youtube), communication (Skype, WhatsApp), document formats (PDF, RTF, HTML), various software platforms (Linux, LaTeX, eclipse, Java) and recent trend in education (open course materials and massive open online courses (MOOC)).
Companies providing services, where their users pay no money at all, is difficult to explain in Economics. Even if these products are free to its user, there is still a sound business plan behind them. To obtain a large market share is the key in their business plan as in the cases of Google, Facebook, LinkedIn, or Skype. Once they become widely used, the company starts to use its customer base to create money.
I.1 New market concepts
In order to understand such markets new concepts such as two-sided markets and attention economy are developed. In a two-sided market, a company acts as a bridge between two different type of consumers Parker2005MS . It provides two products: one is free and the other with a price. Free products are used to capture the attention. Products with price are used to monetize this attention. A set of very interesting examples of two-sided markets including credit cards, operating systems, computer games, stock exchanges, can be found in ref Parker2005MS .
Suppose there are many competing products at the free side of a two-sided market. In theory, a customer can get all the products available. In practice, this is hardly the case. Abundance of immediately available products can easily exceed customers capacity to consume them. One way to look at this phenomenon is that products compete for the attention of the users, which is referred as attention economy in the literature Davenport2002IBJ ; Weng2012SF ; Wu2007PNAS .
Attention scarcity due to the vast amount of immediately available products is also the case for cultural markets. In a cultural market, it is assumed to have an infinite supply for cultural products and it is assumed that individual consumption behaviour is not independent of other’s consumption decisions Salganik10022006 ; Herdagdelen2008IJMPC .
I.2 Compulsive markets
We focus on markets, that are slightly different, where customer compulsively purchases the item once he is aware of it. Clearly, this kind of compulsive buying behavior cannot happen for high priced items such as cars or houses. On the other hand, it could be the case for relatively low priced items such as movie DVDs or music CDs. This pattern of “compulsive purchasing” behavior becomes clearly acceptable, if the items become free as in the case of web sites, video clips, music files, and free softwares, especially free mobile applications. There are a number of services that provide such items including Youtube, Sourceforge, AppStore.
We will call such markets as compulsive markets and we consider the dynamics of the consumers rather then the economics of it. These new kind of markets call for new models. In this work, the Simple Recommendation Model of ref Bingol2008PRE ; Bingol2005 is extended to such a model. We use the extended model to answer the following questions: Under which conditions advertisement mechanism outperforms the recommendation process? How much advertisement is enough to obtain certain market share? We first present our analytic approach and then compare it with simulation results.
II Background
A compulsive buyer becomes aware of a product in two ways: (i) By local interactions within his social network, i.e. by means of word-of-mouth. (ii) By global interactions, i.e. by means of advertisement.
Word-of-mouth recommendations by friends make products socially contagious. Research on social contagion can provide answers to the question of how things become popular. Gladwell states, ”Ideas, products, messages and behaviors spread like viruses do” Gladwell2000Book . He claims that the best way to understand the emergence of fashion trends is to think of them as epidemics. Infectious disease modeling is also useful for understanding opinion formation dynamics. Specifically, the transmission of ideas within a population is treated as if it were the transmission of an infectious disease. Various models have been proposed to examine this relationship Bass1969MS ; Rogers2003Book ; Goldenberg2001ML ; Dodds2005JTB ; Herdagdelen2008IJMPC ; PastorSatorras2001PRL ; Bingol2008PRE . There exist recent works whose essential assumption is the fact that an old idea is never repeated once abandoned Bornholdt2011PRL ; Kondratiuk2012PRE . In other words, agents become immune to older ideas like in the susceptible-infected-recovered (SIR) model. However, behaviors, trends, etc, can occur many times over and over again. In this case it can be modeled as susceptible-infected-susceptible (SIS) model. In completely different context, limited attention and its relation to income distribution is investigated Banerjee2008 .
II.1 Epidemic spreading
The study of how ideas spread is often referred to as social contagion EasleyKleinberg2010Book . Opinions can spread from one person to another like diseases. An agent is called infected iff it has the virus. It is called susceptible iff it does not have the virus.
Using the SIS model of epidemics, the system can be modeled as a Markov chain. Consider a population of agents. Let be the state in which the number of infected agents is . The state space is composed of states, with and being the reflecting boundaries. The system starts with the state where nobody is infected.
Let be the transition matrix of the Markov chain where is the transition probability from state to state . As a result of a single recommendation, there are three possible state transitions: The number of infected agents can increase or decrease by one or stay unchanged. Such a system is called birth death process Ross2009Book . Hence, is a tridiagonal matrix with entries given as
where and are the transition probabilities.
Then the stationary distribution of the Markov chain can be obtained from its transition matrix Ross2009Book which satisfies
| (1) |
II.2 Simple Recommendation Model
The Simple Recommendation Model (SRM) reveals the relation between the fame and the memory size of the agents Bingol2008PRE ; Bingol2005 . The SRM investigates how individuals become popular among agents with limited memory size and analyzes the word-of-mouth effect in its simplest form. The SRM differs from many previous models by its emphasis on the scarcity of memory. In the SRM, agents, that have a strictly constant memory size , learn each other solely via recommendations.
A giver agent selects an agent, that he knows, and recommends to a taker agent. Since memory space is restricted to , the taker forgets an agent to make space for the recommended one. This dynamics is called a recommendation which is given more formally in Sec. III.3. Note that (i) The selections have no sophisticated mechanisms. All selections are made uniformly at random. (ii) Any agent can recommend to any other agent. Therefore underlining network of interactions is a complete graph. (iii) Taker has to accept the recommended, that is, he has no options to reject.
In the SRM, no agent initially is different than the other. So the initial fames of agents are set to be the same where fame of an agent is defined as the ratio of the population that knows the agent. Recommendations break the symmetry of equal fames. As recommendations proceed, a few agents get very high fames while the majority of the agents get extremely low fames, even to the level of no fame at all. Once an agent’s fame becomes , that is, completely forgotten, there is no way for it to come back. In the limit, the system reaches an absorbing state where exactly agents are known by every one, i.e. fame of , and the rest becomes completely forgotten, i.e. fame of . The SRM offers many possibilities for extension. It is applied to minority communities living in a majority Delipinar2009 . A recent work extends forgetting mechanism by introducing familiarity Yi-Ling2013 .
III Proposed Model
In SRM, (i) the spread of information through out the system is managed by recommendation only and (ii) the results are obtained by simulations Bingol2005 ; Bingol2008PRE . In this article, we propose Simple Recommendation Model with Advertisement (SRMwA) that extends SRM in the following ways: (i) In addition to recommendation, advertisement pressure as new dynamic is introduced. (ii) Moreover, an analytical approach is developed as well as simulations. Distinctively, by SRMwA, we investigate the conditions under which social manipulation by advertisement overcomes pure recommendation.
III.1 New interpretation for SRM
In the original model of SRM, agents recommend other agents and the term of memory size is used for the number of agents one can remember Bingol2005 ; Bingol2008PRE . As one agent is known more and more by other agents, his fame increases. In the extended model of SRMwA, agents recommend items rather than agents. Since items consume the limited attention of agents, there is a competition among items for attention. For these reasons, we prefer to use the term of “attention capacity” in spite of the term memory size for the number of information an agent can handle. The focus of the work is no longer the fame of the agents but the attention competition among items.
Note that the proposed model allows us to consider items in a wider sense. Rather than a unique object such as Mona Lisa of Leonardo, we consider items that are easily reproduced so that there are enough of them for everybody to have, if they wanted to. Therefore items are not only products and services but also as political ideas, fashion trends, or cultural products as in the case of ref Herdagdelen2008IJMPC .
III.2 Advertisement
We extend the SRM to answer the following question: What happens if some items are deliberately promoted? Suppose a new item, denoted by , is advertised to the over-all population. At each recommendation, the taker has to select between the recommended item and the advertised one . The item that is selected by the taker is called the purchased item, denoted by .
III.3 Model
Adapting the terminology of SRM Bingol2008PRE to SRMwA, a giver agent recommends an item, that she already owns, to an individual. The item and the individual are called the recommended and the taker , respectively. The taker pays attention to, that is, purchases, either the recommended or the advertised item. When the attention capacity becomes exhausted, in order to get space for the purchased item, an item that is already owned by the taker is discarded. The market share of an item is defined to be the ratio of population that owns the item.
The SRMwA is formally defined as follows. Let and be the sets of agents and items, respectively. Let and represent the giver and the taker agents, the recommended, the discarded and the purchased items, respectively.
The attention “stock” of an agent , denoted by , is the set of distinct items that owns. We say agent owns item iff . For the sake of simplicity, we assume that all agents have the same attention capacity , that is, for all . The attention capacity of an agent is limited in the sense that no one can pay attention to the entire set of items but to a small fraction of it, that is, . Instead of directly using , we relate to by means of attention capacity ratio, defined as . Since , we have .
The recommendation and advertisement dynamics compete. The taker agent select either the recommended or the advertised item as the purchased one. Let the advertisement pressure, , be the probability of selecting the advertised item as the purchased item.
The modified recommendation is composed of the following steps:
-
i)
is selected.
-
ii)
is selected.
-
iii)
is selected by for recommendation.
-
iv)
selects where is set to with probability , and to with probability .
-
v)
The recommendation stops if is already owned by .
-
vi)
Otherwise, is selected by for discarding and is put to the space emptied by .
Note that all selections are uniformly at random. With these changes, the SRMwA becomes a model for compulsive markets with advertisement.
III.4 Some special cases
In general, one expects that the market share of the advertised item increases as advertisement get stronger. Depending the strength of advertisement, there are a number of special cases, the dynamics of which can be explained without any further investigation.
-
i)
No advertisement. Note that in the case of no advertisement, the original SRM is obtained since the purchased item is always the recommended item, i.e. . In this case, the advertised item has no chance and its the market share is .
-
ii)
Pure advertisement. When the taker has no choice but get the advertised one, i.e. , recommendation has no effect. In this cases after every agent becomes a taker once, the market share of the advertised is . Note that in this case the system will stop evolving any further. Interestingly, this is a different state than the absorbing states of the SRM.
-
iii)
Strong advertisement. In the case of very strong advertisement, the taker almost always select the advertised item. Once all agents have the advertised item, the market share of the advertised item is and the system becomes the SRM but with attention capacity of .
IV Analytical Approach
Note that SRMwA resembles epidemic spreading. We explore epidemic spreading to explain SRMwA as far as we can. Consider the advertised item as a virus. Agent is called infected iff it has the advertised item in its attention stock, that is, otherwise It is called susceptible that is . Then the stationary distribution provides the probability of the number of agents owning the advertised item when the system operates infinitely long durations. Hence, the mean value of the stationary distribution reveals our prediction for the number of infected agents. In other words, the expected number of agents that adopted the advertised item is the mean value of this distribution. That is, using Eq. 1, one obtains
Hence, the expected market share of the advertised item becomes
where is the market share of the advertised item.
IV.1 Calculation of transition probabilities

In order to obtain the expected market share of the advertised item, we need to figure out the stationary distribution , which, in turn, calls for transition probabilities and .
Suppose the system is in and follow the steps of recommendation process given in Sec. III.3. The possible selections can be represented by a tree given in Fig. 1. A path starting from the root to a leaf in the tree corresponds to a recommendation. The paths that increase the number of infected agents are marked by a sign at the leaf. Similarly, recommendations resulting a transition of are marked by a . The remaining paths that correspond to no state change are marked by a .
Note that there three and two paths. Note also that the correspondence between the levels in the tree and the steps of recommendation given in Sec. III.3. At each level one particular selection is made and the corresponding probability is assigned.
-
i)
level. The first level branching in Fig. 1 corresponds to the selection of infected or susceptible giver. There are possible agents to be selected as . If system is in state , then the probability of selecting an infected giver is .
-
ii)
level. The second level branching is due to the selection of infected or susceptible taker. Once is selected, there are candidates left for . The probability of selecting an infected taker depends on whether the selected giver is infected or not. For example, in the right most path, is infected. So, the probability of selecting an infected taker for this case is as .
-
iii)
level. Now consider what the giver recommends. Depending on the path, the giver could be infected and could recommend the advertised item. Then the probability of an infected giver recommending is , since there are items in its stock.
-
iv)
level. The fourth level illustrates the taker’s purchase decision. The taker agent either follows the advertisement with probability or he accepts the recommended item with probability .
-
v)
level. Let be the probability of being already owned by the taker agent. In this case, the taker agent does not do any changes in her stock.
-
vi)
level. It is possible that can be chosen to be the forgotten.
The transition probabilities can be obtained from Fig. 1 as
| (2) | |||||
| (3) | |||||
| (4) |
Note that (i) These equations satisfy the expected boundary conditions , and . (ii) for all . (iii) for all when or . Therefore, for or , the system drifts to and stays there forever.
IV.2 Discussion on the value of
The stationary distribution can be obtained by means of Eq. 1, Eq. 2 and Eq. 3. The only unknown in these equations is , which is introduced in the fifth step of recommendation given in Sec. III.3. is defined as the probability of recommended item to be already owned by the taker agent. Unfortunately, cannot be obtained analytically except for the extreme case of . Therefore, we should find ways to approximate its value.
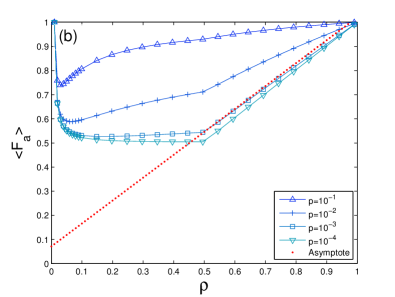
A first order estimate for could be , since taker owns item out of in total. is close to 1, when is in the range of , since every agent owns almost all the items. The situation is quite different for . Since every item initially has the same market share, starts with a small value at the beginning. As recommendations proceeds, we know that some items becomes completely forgotten Bingol2008PRE . Therefore increases as the number of recommendations increase and becomes when the systems reaches one of its absorbing state. In this respect, can be interpreted as the degree of closeness to an absorbing state. In order to investigate near absorbing state behavior, we set in our analytic results given in Fig. 2 (b) where is arbitrarily selected.
IV.3 Extremely scarce attention capacity
For the extremely scarce attention capacity of , can be evaluated. Consider the paths in Fig. 1. For , the paths which contain a edge become paths with zero probabilities. The only non-zero probability path, involving , is the one terminating at the left leaf. In this path the giver does not know the advertised item, , while the taker does, . Since attention capacity is limited to , the giver and the taker do own different items. Therefore, the recommended item by the giver cannot be owned by the taker. Hence, .
For and , the equations Eq. 2 and Eq. 3 lead to
for For , . That means for even very small positive advertisement, the system inevitably drifts to the state and once is reached, the system stays there forever since . Note that , which corresponds to the state where all agents own the advertised item, is the unique absorbing state for this particular case.
V Simulation Approach
In order to simulate the model, a number of decision have to be made. The simulations start in such configurations that all items have the same market share and no agent knows the advertised item. So that system is initially symmetric with respect to non-advertised items. When to terminate the simulation is a critical issue. We set the average number of interactions . Since there are pairwise interactions among agents in both directions, the total number of recommendations is set to be .
(i) We run our simulation for a population size of and an item size of .
(ii) The behavior of the system strongly depends on the attention capacity ratio . We take as a model parameter and run simulation for various values of .
(iii) The advertisement pressure is another model parameter. We use and for .
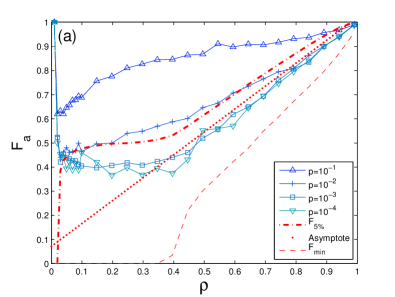
VI Observations and Discussion
We investigate the effect of the advertisement pressure and the capacity ratio to market share of the advertised item. In order to make a quantitative comparison of the simulation results, being in the top percent is arbitrarily set as our criteria. Let denote the lowest market share for an item to be in the top percent. Then, the advertised item is in the top 5 percent whenever . Let be the minimum market share among all the items.
In Fig. 2, the simulation results of , averaged over 20 realizations and versus the analytical results of can be seen for each value of as functions of . A number of observations can be made:
(i) The analytic results given in Fig. 2 (b) are in agreement with the simulation results in Fig. 2 (a). Model predictions on can quantitatively reproduce the simulation results of although we use an approximated value for . We observe that for larger , the similarity between analytical and simulation results gets even better.
(ii) The curves of in Fig. 2 (a) resemble that of in ref Bingol2008PRE , although advertisement is not the case for the latter. Line , which is given as an asymptote for for large values of in ref Bingol2008PRE , is also plotted in Fig. 2 (a) for comparison purposes.
(iii) Note that for , all curves approaches to 1 and becomes 0. This is due to finite size effect. At an absorbing state, there would be exactly the same items purchased by all the agents and the remaining items are completely forgotten. For , means that . That is, there is no space left for the fifth item. Hence, in near absorbing state, the market share of the fifth item, , approaches to . On the other hand, any promotion, i.e. , is enough to push the advertised item into the top items.
(iv) The minimum market share becomes , when at least one item is completely forgotten. This occurs for in Fig. 2 (a) which is consistent with ref Bingol2008PRE . We also observe that for larger , the advertised item leaves smaller share of attention to others, that forces the zero crossing of to occur at an higher level of .
(v) As expected, a strong advertisement, i.e. , easily gets the advertised item into the top percent since curve for is always higher than that of in Fig. 2 (a) while a weak promotion such as or cannot. The case of for is interesting. For small and moderate values of , i.e. , the advertised item is in the top 5 percent except for one point. For the large values of , this is not the case.
(vi) How agents allocate their attention, when the attention capacity becomes a limiting factor? This is the critical question for markets of attention economy. Consider the extreme case of attention capacity , which corresponds to in Fig. 2 . In this case, surprisingly, even a very small positive value of is enough for the entire population to get the advertised item, i.e. , when . This observation is analytically investigated in Sec. IV.3.
VI.1 Item size effect
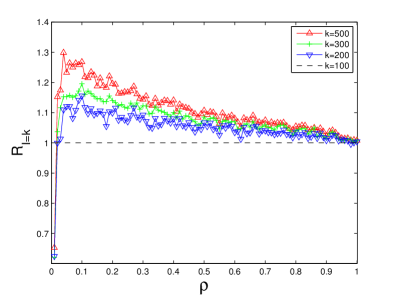
We run new simulations with different item sizes of when is fixed to . Let denote the market share of the advertised item when . Then we accept as the reference market share and define relative market share with respect to as follows
In Fig. 3, we observe that for all , when is fixed to except for . The case of corresponds to for . As explained in Sec. IV.3, gets its maximum value of 1, for . That is why, for .
We have observed that the market share of the advertised item improves while the number of items are increased even if the advertisement pressure is kept constant. In order to push market share up, increasing the advertisement pressure, is not usully an option in practical life. This can be an interesting interpretation. If one cannot increase the intensity of advertisement, i.e , it is better to have higher number of items, i.e. . When that happens, the advertised item have better chances to get into the top 5 percent. In order to obtain this operating point, one may purposefully introduce some dummy items. This unexpected prediction of the model needs to be further investigated.
VI.2 Closeness to the absorbing state
The system gets closer to one of its absorbing states as the number of recommendations increases which is controlled by simulation parameter . Let be the market share of the advertised item after recommendations. We define relative market share at with respect to as
The relative market share at is given in Fig. 4 for different values of when .
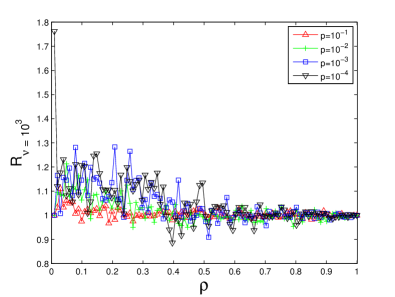
We consider the system stationary if becomes , that is, the system stops changing with . We observe in Fig. 4 that as the attention capacity or the advertisement pressure gets higher, model becomes closer to the stationarity. More advertisement pressure is not so different than increasing the number of iterations. Both are favorable for the market share of the advertised item.
VII Conclusions
The SRM as a model for pure word-of-mouth marketing is studied in ref Bingol2005 ; Bingol2008PRE . We extend the SRM to attention markets with advertisement. This model constructs a theoretical framework for not only items but studying the propagation of any phenomena such as ideas or trends under limited attention.
The model is investigated analytically and by simulation. The analytical results agree with the simulations. As expected, strong advertisement forces every one to get the advertised item in all conditions.
Interestingly, when the attention capacity is small compared to the number of items, even a very weak advertisement can do the job. This behavior is analytically shown for the case of and observed in the results of both simulations and analytic calculations as approaches to . This can be interpreted as when individuals have limited attention capacity, they tend to adopt what is promoted globally rather than recommended locally. We have also found that introducing more standard items to the market, is good for the market share of the advertised item. This observation may lead to interesting political consequences in terms of public attention and political administration. For example, public opinion can be kept under control by means of increasing the number of issues, possibly by means of artificial ones, so that the promoted idea is easily accepted by large audiences. This prediction calls for further investigation.
In this current work, there is a unique advertised item. The model can be extended to cover more than one promoted items. All selections are uniformly at random. One may investigate the effects of some other selection mechanism as in the case of ref Yi-Ling2013 . We have a complete graph as the graph of interactions. One can investigate other graphs of interactions such as Scale-Free, Small-World, regular or random graphs. The structure of interactions can also be improved by introducing a radius of influence. One may extend the model by introducing the concept of quality for items or letting agents prefer some items intrinsically as in ref Herdagdelen2008IJMPC .
Acknowledgements.
Authors would like to thank to Gulsun Akin for pointing at the two-sided markets. This work was partially supported by Bogazici University Research Fund (BAP-2008-08A105), by the Turkish State Planning Organization (DPT) TAM Project (2007K120610), by TUBITAK (108E218) and by COST action MP0801.References
- (1) G. G. Parker and M. W. Van Alstyne, “Two-Sided Network Effects: A Theory of Information Product Design,” Management Science, vol. 51, no. 10, pp. 1494–1504, 2005.
- (2) T. H. Davenport and J. C. Beck, “The strategy and structure of firms in the attention economy,” Ivey Business Journal, vol. 66, no. 4, pp. 49–54, 2002.
- (3) L. Weng, A. Flammini, A. Vespignani, and F. Menczer, “Competition among memes in a world with limited attention.,” Scientific Reports, vol. 2, p. 335, 2012.
- (4) F. Wu and B. A. Huberman, “Novelty and collective attention.,” Proceedings of the National Academy of Sciences of the United States of America, vol. 104, no. 45, pp. 17599–17601, 2007.
- (5) M. J. Salganik, P. S. Dodds, and D. J. Watts, “Experimental study of inequality and unpredictability in an artificial cultural market,” Science, vol. 311, no. 5762, pp. 854–856, 2006.
- (6) A. Herdagdelen and H. Bingol, “A Cultural Market Model,” International Journal of Modern Physics C, vol. 19, no. 02, p. 271, 2008.
- (7) H. Bingol, “Fame emerges as a result of small memory,” Physical Review E, vol. 77, no. 3, p. 036118, 2008.
- (8) H. Bingol, “Fame as an Effect of the Memory Size,” Lecture Notes in Computer Science, vol. 3733, pp. 294–303, 2005.
- (9) M. Gladwell, The Tipping Point: How little things can make a big difference. Little Brown and Company, Boston, 2000.
- (10) F. M. Bass, “A New Product Growth for Model Consumer Durables,” Management Science, vol. 15, no. 5, pp. 215–227, 1969.
- (11) E. M. Rogers, Diffusion of Innovations. Free Press, 5 ed., 2003.
- (12) J. Goldenberg, B. Libai, and E. Muller, “Talk of the network: A complex systems look at the underlying process of word-of-mouth,” Marketing Letters, vol. 12, no. 3, pp. 211–223, 2001.
- (13) P. S. Dodds and D. J. Watts, “A generalized model of social and biological contagion.,” Journal of Theoretical Biology, vol. 232, no. 4, pp. 587–604, 2005.
- (14) R. Pastor-Satorras and A. Vespignani, “Epidemic Spreading in Scale-Free Networks,” Physical Review Letters, vol. 86, no. 14, pp. 3200–3203, 2001.
- (15) S. Bornholdt, M. Jensen, and K. Sneppen, “Emergence and Decline of Scientific Paradigms,” Physical Review Letters, vol. 106, no. 5, p. 058701, 2011.
- (16) P. Kondratiuk, G. Siudem, and J. Hołyst, “Analytical approach to the model of scientific revolutions,” Physical Review E, vol. 85, no. 6, p. 066126, 2012.
- (17) A. Banerjee and S. Mullainathan, “Limited attention and income distribution,” The American Economic Review, vol. 98, no. 2, 2008.
- (18) D. Easley and J. Kleinberg, Networks, Crowds, and Markets: Reasoning about a highly connected world. Cambridge University Press, 2010.
- (19) S. Ross, Introduction to Probability Models. Academic Press, 10 ed., 2009.
- (20) S. Delipinar and H. Bingol, “Application of SRM to Diverse Populations,” Complex Sciences, vol. 4, pp. 1063–1071, 2009.
- (21) W. Yi-Ling and Z. Gui-Qing, “Optimal convergence in fame game with familiarity,” Chaos, Solitons & Fractals, vol. 56, pp. 222–226, 2013.