Cold Accretion In Early Galaxy Formation And Its Signatures
Abstract
The emission has played an important role in detecting high-redshift galaxies, including recently distant ones at redshift . It may also contain important information on the origin of these galaxies. Here, we investigate the formation of a typical galaxy and its observational signatures at the earliest stage, by combining a cosmological hydrodynamic simulation with three-dimensional radiative transfer calculations using the newly improved code. Our cosmological simulation uses the Aquila initial condition which zooms in onto a Milky Way-like halo with high resolutions, and our radiative transfer couples multi-wavelength continuum, line, and ionization of hydrogen. We find that the modeled galaxy starts to form at redshift through efficient accretion of cold gas, which produces a strong line with a luminosity of as early as . The emission appears to trace the cold, dense gas. The lines exhibit asymmetric, single-peak profiles, and are shifted to the blue wing, a characteristic feature of gas inflow. Moreover, the contribution to the total luminosity by excitation cooling increases with redshift, and it becomes dominant at . We predict that galaxies such as the modeled one may be detected at by JWST and ALMA with a reasonable integration time. Beyond redshift 12, however, only line may be observable by spectroscopic surveys. Our results suggest that line is one of the most powerful tools to detect the first generation of galaxies, and to decipher their formation mechanism.
Subject headings:
galaxies: formation – galaxies: evolution – galaxies: high-redshift – radiative transfer – line: profiles – hydrodynamics – cosmology: computation1. Introduction
The quest for the first galaxies formed at the cosmic dawn is a major frontier in both observational and theoretical cosmology (Bromm & Yoshida, 2011). Over the past few years, significant progress has been made in detecting galaxies at redshift , using either broad-band colors (e.g., Bouwens et al., 2004; Bouwens & Illingworth, 2006; Bouwens et al., 2010, 2011), or narrow-band emission line (e.g., Malhotra & Rhoads, 2004; Iye et al., 2006; Stark et al., 2007; Hu et al., 2010; Lehnert et al., 2010; Vanzella et al., 2011; Stark et al., 2011; Ono et al., 2012; Kashikawa et al., 2011; Shibuya et al., 2012; FInkelstein et al., 2013). In particular, the line has played an important role in identifying and confirming distant galaxies, the so-called emitters (LAEs), including currently the record holder at (Lehnert et al., 2010). These remarkable observations indicate that galaxies formed less than a few hundred million years after the Big Bang.
Despite the rapidly increasing number of detections, the origin and nature of these distant galaxies, however, remain open questions (Bromm et al., 2009). Recently, a number of state-of-the-art simulations have started to address this issue (e.g., Wise & Abel, 2007; Wise et al., 2008; Wise & Abel, 2008; Greif et al., 2010; Wise et al., 2012; Jeon et al., 2012). These studies focused on a halo in a small volume (1 Mpc) with high resolutions, and suggested that the formation of the first galaxies is closely tied to the formation of the first stars (so-called Pop III stars) and the feedback from them, and that these galaxies likely consist of second- or third generation of stars formed from enriched gas, similar to the present-day stars.
In this work, we explore the physical conditions of early galaxy formation on a larger scale. In particular, we focus on the gas properties and the emission from it. Recent simulations have revealed that a large amount of gas penetrate deep inside dark matter halos as cold, filamentary streams (Katz et al., 2003; Birnboim & Dekel, 2003; Kereš et al., 2005, 2009; Dekel & Birnboim, 2006; Ocvirk et al., 2008; Brooks et al., 2009; Dekel et al., 2009), and Dekel et al. (2009) showed that massive galaxies at can actively form stars from inflow of cold gas. More recently, Di Matteo et al. (2011) suggested that massive galaxies at can grow by cold accretion and evolve with black holes. Such streams of cold gas may produce a large number of photons via excitation cooling process, and give rise to the emission detected in the early galaxies (Dijkstra & Loeb, 2009; Faucher-Giguère et al., 2010; Latif et al., 2011; Yajima et al., 2012a, b).
We combine a multi-scale cosmological hydrodynamic simulation with multi-wavelength radiative transfer (RT) calculations. The simulation uses the Aquila initial condition and follows the formation and evolution of a Milky Way-size galaxy (Wadepuhl & Springel, 2011; Scannapieco et al., 2012). It covers a large dynamical range from a box down to a zoom-in region, which is ideal to study the gas inflow on a large scale. The RT calculations uses the three-dimensional Monte Carlo RT code by Li et al. (2008); Yajima et al. (2012a). The code couples multi-wavelength continuum, line, and ionization of hydrogen, which is critical to study the and multi-band properties of the early galaxies.
The paper is organized as follows. We describe our cosmological simulation in §2, and the RT calculations in §3. In §4, we present the results, which include the properties, and detectability by upcoming missions James Webb Space Telescope (JWST) and Atacama Large Millimeter Array (ALMA). We discuss the implications and limitations of our model in §5, and summarize in §6.
2. Model & Methodology
We carry out a cosmological simulation with the Aquila initial condition which can reproduce a Milky Way-like galaxy at (Springel et al., 2008; Scannapieco et al., 2012). The whole simulation box is on each side with a zoom-in region of a size of . The spatial resolution in the zoom-in region is pc and the mass resolution is for dark matter particles, for gas, and for star particles. The cosmological parameters used in the simulation are , , and , consistent with the five-year results of the WMAP (Komatsu et al., 2009). The simulation was performed using the N-body/Smoothed Particle Hydrodynamics (SPH) code GADGET-3 (Springel et al., 2001; Springel, 2005). The specifics of the simulation were described in Zhu et al. (2012), and we refer the readers to that paper for more details.
In this work, we use the 3D Monte Carlo RT code, All-wavelength Radiative Transfer with Adaptive Refinement Tree () to study the multi-wavelength properties of the model galaxies. The code includes continuum photons from X-ray to radio, line, and ionization structure in the adaptive refinement grids. The detailed prescriptions of the code were presented in Li et al. (2008) and Yajima et al. (2012a). The emission comes from the recombination and de-excitation process,
| (1) |
where is the case B recombination coefficient, and is the average number of photons produced per case B recombination. The derived in Hui & Gnedin (1997) is used. Due to the small dependence of to temperature, we assume at everywhere (Osterbrock & Ferland, 2006). The is the collisional excitation coefficient, (Osterbrock & Ferland, 2006). The emissivity and opacity highly depend on the ionization structure in the galaxies. We at first calculate the ionization structure due to internal stellar sources, then simulate the RT. We cast photon packets for each ionizing, , and non-ionizing components, which showed good convergence (Yajima et al., 2012a, b). In addition, interstellar dust is included to consider the dust extinction of and continuum photons, and to simulate the dust thermal emission (see also Yajima et al., 2012a). The intrinsic spectral energy distributions (SEDs) of stars are calculated by GALAXEV (Bruzual & Charlot, 2003) with the assumption of Salpeter IMF. For the SED of AGNs, the broken power law is used (Li et al., 2008). For the intrinsic SEDs, we do not include line as nebula emission. This is because we here calculate the radiative transfer of ionizing photons and ionization structure. Some fraction of ionizing photons are absorbed in situ, and converted to photons via the recombination process. Therefore, the nebula emission at line is included in the post-processing calculations.
3. Results
In our previous work, we have presented the formation history of a MW galaxy in Zhu et al. (2010), and have applied to the Aquila simulation to study the multi-band properties of the MW progenitors (Yajima et al., 2012a), and the escape of and continuum photons (Yajima et al., 2012b). In this paper, we focus on the earliest evolutionary stage of the MW and the properties from .
3.1. The Accretion of Cold Gas
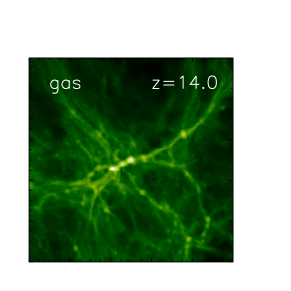
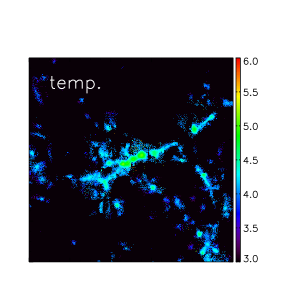
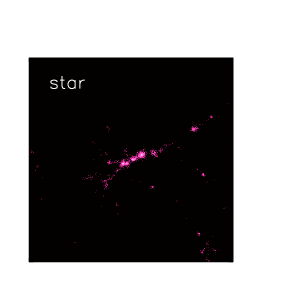
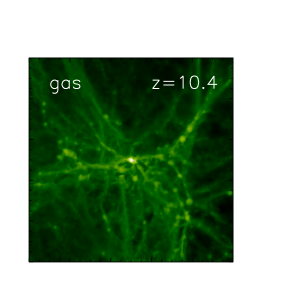
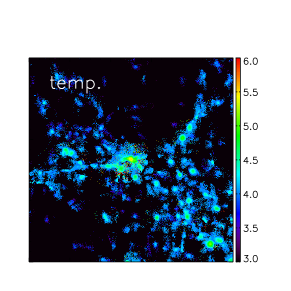
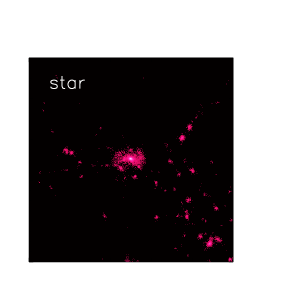
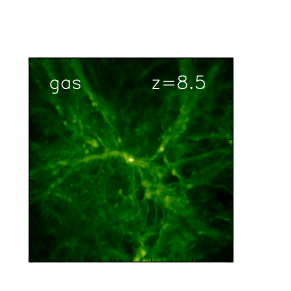
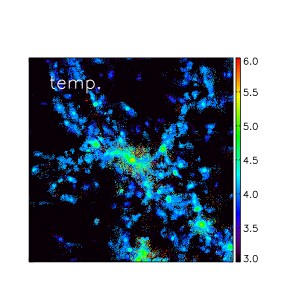
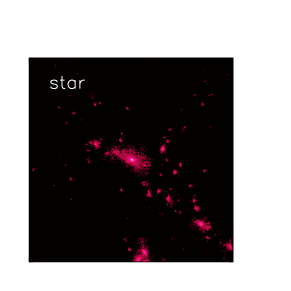
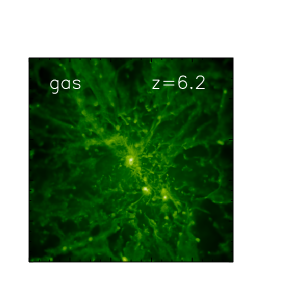
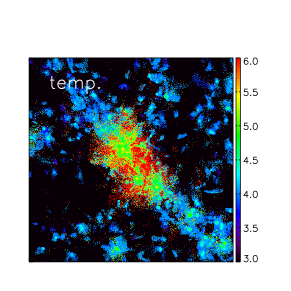
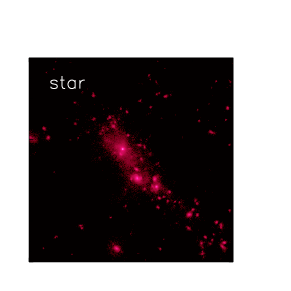

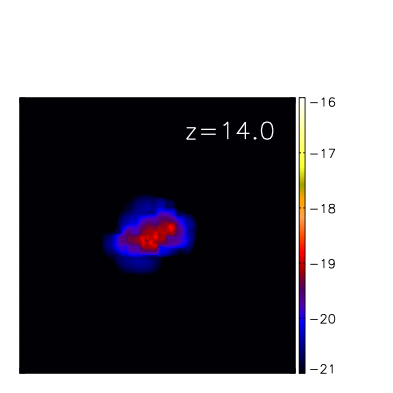
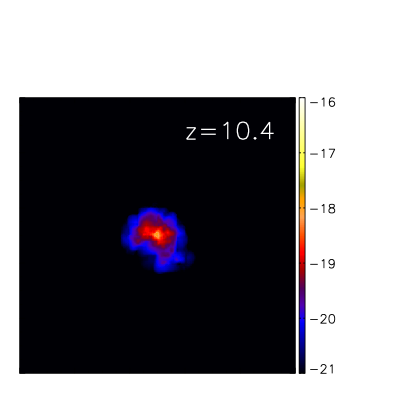
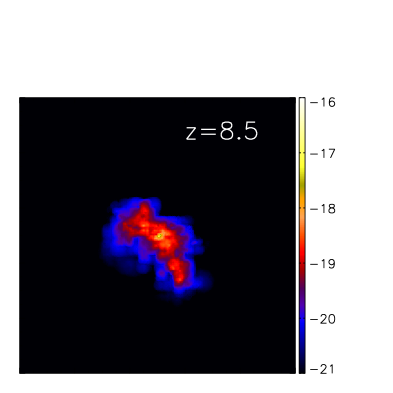
The modeled MW galaxy starts to form at . Figure 1 shows the distribution of gas density, gas temperature, and stellar density of the MW main progenitor from redshift to . The gas follows the distribution of dark matter and exhibits filamentary structures. At , the gas is predominantly cold, with a mean temperature of K. Stars form out of such cold gas, so they also distribute along the filaments.
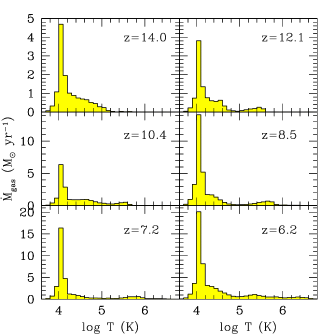
The star formation at is fueled by efficient accretion of cold gas, as demonstrated in Figure 2. The gas accretion rate is defined as the inflow rate of gas within the virial radius of the modeled galaxy. It peaks around K in all cases. At a later time, feedback from both stars and accreting BHs heats up the gas. Also, the gas can be heated by gravitational shocks during the infall. Therefore the accretion includes hot gas as well. The inflow gas falls along the filaments toward the intersection, the highest density peak where the first galaxy in the simulated volume forms.
Figure 3 shows the star formation history of the MW. The star formation rate (SFR) increases steadily from at to at , and it peaks at at , due to the merging processes of gas-rich galaxies. The galaxy mass increases rapidly during this cold accretion phase. By , it reaches a total mass of , and a stellar mass of .
3.2. The Properties
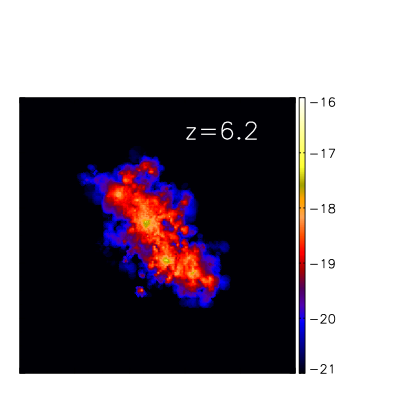

The emission traces the gas distribution, as shown in Figure 4. The surface brightness rises above at . At high redshift , the galaxy is small, and the emission is faint and confined to the central high-density region. The emission increases with the mass and size of the galaxy, and it becomes stronger and more extended and irregular due to mergers and gas infall along the filaments of the main halo.
Figure 5 shows the properties of the MW galaxy at from to , including the emergent luminosity (), equivalent width of line in rest frame, and photon escape fraction of and UV continuum (1300 - 1600 ). For comparison with the star formation activity, the SFR of the galaxy at corresponding redshift is also shown.
During this early growth phase, the SFR of the galaxy increases from at to at , owing to abundant supply of cold gas from infall and merging of gas-rich mini halos. The resulting emergent luminosity shows a similar trend, increasing from at to at . If we consider only the recombination process with the assumption of (in which the is a tracer of star formation), the the intrinsic luminosity should be linearly proportional to SFR, (Kennicutt, 1998). However, the evolution of in Figure 5 differs from the SFR history. This is due to the contribution from excitation cooling to the emission as we will discuss later, and dust absorption of the photons. In particular, at , the increases with redshift, in opposite direction from the SFR, as a result of high collisional excitation and high .
The lower-left panel of Figure 5 shows the photon escape fraction of , , and the UV continuum , where is calculated at . The of the modeled galaxy falls in the range of , and it increases with redshift. In our model, the dust is produced by type-II supernovae (Li et al., 2008). The dust amount increases as star formation rises from to , and hence it efficiently absorbs the and UV continuum photons, resulting decreasing escape fraction. However even at , about of photons are absorbed by dust. This is due to the fact that, in the early phase, galaxies are gas rich and compact, the gas and dust are highly concentrated in the galaxies, resulting in effective absorption of the the and UV photons by the dust.
The resulting equivalent width (EW) is shown in the lower-right panel of Figure 5. The EW is estimated from the flux divided by the UV flux density at . The modeled galaxy has at these redshifts, and is therefore classified as a emitter (LAE) (e.g., Gronwall et al., 2007). The EW increases with redshift, from at to at . Such trend is similar to that reported in recent observations which showed that galaxies at higher redshift have higher EWs than their lower-redshift counterparts (e.g., Gronwall et al., 2007; Ouchi et al., 2008). This is because the contribution from excitation cooling becomes large with increasing redshift, as shown in Figure 6 in the next section, which boosts the EW significantly (Yajima et al., 2012a, b).
The currently most distant LAE at , z8_GND_5296, has a luminosity of (FInkelstein et al., 2013). Our model shows the similar luminosity at the redshift, and hence may be reproducing the observed LAE. However, there are additional uncertainties which may reduce the flux of our calculation as we explain at the below and Section 3.4.
Next generation telescopes will have very high-angular resolution, for example, that of JWST will get to . Some extended fainter parts as seen in Figure 4 can be lost in observation with such the resolution. As a result, observed flux is likely to be lower than that galaxies are actually emitting. In practice, for Figure 4, if we count up only fluxes of pixels brighter than , which is the detection threshold of recent observation of extended source with a narrow-band filter (e.g., Matsuda et al., 2012), the fluxes are reduced by factor at and at . Open triangles and squares in the Figure 5 show the properties by considering the detection thresholds of the surface brightness with and , respectively. luminosity and of our model galaxies can be significantly reduced in the mock observation with the threshold of . In particular, the galaxies at become too faint to be detected in the current observation. On the other hand, if the surface brightness threshold is , we detect per cent of the flux for and per cent for . However, the narrow-band filter imaging by F164N on JWST will require very long exposure time hours to achieve the detection threshold for detection. Therefore, although galaxies have complex distribution reflecting gas and stellar distribution, most of them can be lost in observation. Due to the lost of faint extended parts, the high- galaxies can be faint at band or undetectable with current (or future) observations, although they are intrinsically bright.
3.3. Contribution of Excitation Cooling to Emission

As mentioned in § 2, the emission is generally produced by the recombination of ionizing photons and the collisional excitation of hydrogen gas. In our cosmological simulation, galaxy evolution is accompanied by cold, filamentary gas streams with temperature , which penetrate deep inside the dark matter halos (Zhu et al. in prep, Yajima et al., 2012b), which was also shown by previous theoretical works (Katz et al., 2003; Kereš et al., 2005, 2009; Birnboim & Dekel, 2003; Dekel & Birnboim, 2006; Ocvirk et al., 2008; Brooks et al., 2009; Dekel et al., 2009). The emissivity due to collisional excitation is sensitive to gas temperature, and has the peak in the efficiency at (Faucher-Giguère et al., 2009). Hence, much excitation cooling photons can be emitted from such cold accreted gas (Dijkstra & Loeb, 2009; Faucher-Giguère et al., 2009; Goerdt et al., 2010). At higher redshift, galaxies experience more merging events and accrete more cold gas efficiently, which results in stronger emission from excitation cooling, and higher EWs (Yajima et al., 2012a, b).
As shown in Figure 6, the fraction of intrinsic excitation cooling to the total intrinsic luminosity increases from at to at . Such extremely high excitation cooling produces the extremely high EWs seen in Figure 5.
The luminosity of our model, which is mainly contributed by the excitation cooling, is higher than the model at in Faucher-Giguère et al. (2010). For example, they showed at the halo mass . On the other hand, when our model galaxy has similar mass at , it shows without dust extinction. This may be due to the difference of the conversion efficiency from gravitational energy to cooling. Faucher-Giguère et al. (2010) used 0.3 as the conversion efficiency (see also Dijkstra & Loeb, 2009). In addition, recently Rosdahl & Blaizot (2012) showed the conversion efficiency is by radiative-hydrodynamics simulations. However, this conversion efficiency depends sensitively on the detailed gas structure in and around galaxies (Rosdahl & Blaizot, 2012). In some situations, cold-accreted gas is disturbed by interstellar gas and heated up (Rosdahl & Blaizot, 2012). In our model, galaxies are compact and high-density (Yajima et al., 2012c), hence a large fraction of accreted gas might be heated due to friction with interstellar medium. Then, since the temperature of the cold accretion gas is , most of the thermal energy can be converted to photons (Thoul & Weinberg, 1996). In addition, luminosity by the excitation cooling can increases with redshift, because the emissivity is proportional to square of gas density (Equation 1) and mean gas density of galaxies increases with redshift (e.g., Bryan & Norman, 1998). In practice, Goerdt et al. (2010) showed that by their cosmological hydrodynamics simulations with a simple dust absorption model. The luminosities of our model galaxies are consistent with their estimation. Note that, the cooling rate balances heating rate and it is sensitive to temperature. The heating rate may not simply increase with redshift while the mean gas density does. If gas temperature is higher than , the thermal energy can be released by different cooling radiation, e.g., recombination, free-free emission (Thoul & Weinberg, 1996). In addition, the luminosity by the excitation cooling in our simulations at , which is at , is close to that in Faucher-Giguère et al. (2010). Thus, the luminosity of our model at can be higher than the analytical model of Faucher-Giguère et al. (2010) at by some factors.
The current our code does not distinguish excitation and recombination photons in the RT calculations. However, the fraction of excitation cooling rate may not change significantly for mock observations with the different thresholds of surface brightness. This is because, as shown in Yajima et al. (2012b), photons are mostly emitted at galactic centers, and travel with many scatterings in inter-stellar medium, resulting in the faint extended parts. Therefore, the mock observation with the different thresholds of surface brightness can miss the both excitation and recombination photons at the faint parts.
3.4. The Line Profile
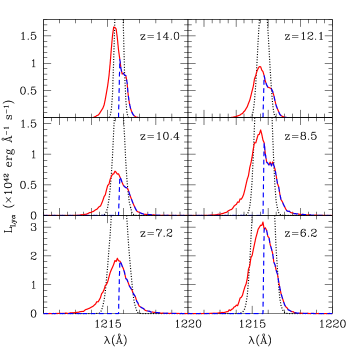
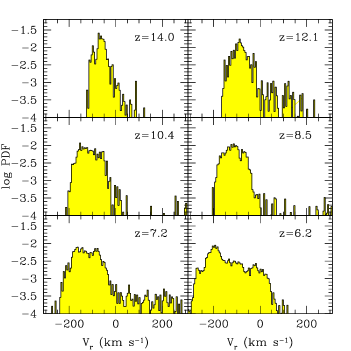
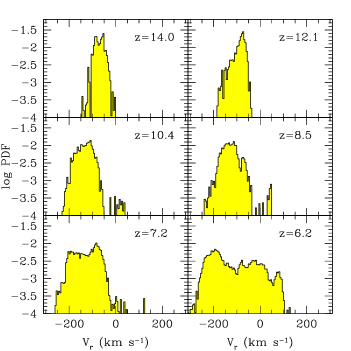
The resulting line profiles of the modeled MW galaxy from to are shown in Figure 7. We randomly sample the frequency of the intrinsic photon from a Maxwellian distribution with the gas temperature at the emission location. All sources show asymmetric profiles with a single peak or weak double peaks. More interestingly, most profiles are shifted to the shorter (bluer) wavelengths. This is a characteristic feature of gas inflow (Zheng & Miralda-Escudé, 2002). Indeed, as shown in Figure 8, a significant fraction of the gas shows a large infalling velocity to , even though our simulation includes feedback of stellar wind similar to that of Springel et al. (2005). In particular, the gas in the galaxy from is dominated by inflow motion, which explains the significant blue shift of the profiles in Figure 7 (top panel). At redshift , the gas exhibits outflow as well, and has a larger velocity distribution , which results in an extended profile to both blue and red wings. While asymmetric line profiles with an extended red wing are commonly seen in high-redshift LAEs, there appears to be some profiles in the observations that have complex features including double peaks and extended blue wing, similar to what we see here (e.g., Ouchi et al., 2010; Hu et al., 2010; Kashikawa et al., 2011). The observed line of z8_GND_5296, the most distant LAE at , is not resolved well and thus has a Gaussian profile (FInkelstein et al., 2013). More observations of high-resolution line profiles of high-redshift LAEs are needed to test our model and verify our predictions.
We note that the line profile may be suppressed and changed by the intergalactic medium (IGM) (e.g., Santos, 2004; Dijkstra et al., 2007; Zheng et al., 2010; Laursen et al., 2011), because the IGM effectively scatters the photons at the line center and at shorter wavelengths by the Hubble flow (e.g., Laursen et al., 2011). As a result, the inflow feature in our profiles may disappear and the shape may become an asymmetric single peak with only photons at red wing. Laursen et al. (2011) showed that a large fraction of flux from galaxies at could be lost by scattering in IGM despite most of IGM were ionized. As a simple test, we show the line profiles without photons at the shorter wavelength as shown in the blue dash lines in the figure. As a result, about 0.59 (0.54) of flux from the galaxies at (6.2) are lost. The inflow feature completely disappears, and the asymmetric profiles with the red wings may be recognized as the galaxies have gas outflow. In addition, if IGM is highly neutral, even flux at red wing is highly suppressed. For neutral IGM, the IGM optical depth is estimated by (Dijkstra & Wyithe, 2010), where is the velocity shift from the line center. More than 0.99 of fluxes from our model galaxies are lost for the neutral IGM. Therefore, if IGM is highly neutral, flux from our model galaxies cannot be observed.
3.5. Detectability of Progenitors of Local Galaxies

The emergent multi-wavelength SEDs of the MW galaxy at different redshifts are shown in Figure 9. The shape of the SEDs evolves with redshift due to the change of intrinsic stellar radiation, absorption of continuum photons by gas and dust, and thermal emission by dust. In all cases, the strong lines emerge, and at the UV continuum at in rest frame is deeply declined due to strong absorption because of dense neutral hydrogen gas around star forming region.
A major science goal of the two forthcoming telescopes, ALMA and JWST, is to detect the first galaxies. In order to predict the detectability of the infancy of a local galaxy, we contrast the SEDs with some detection limits of these two facilities in Figure 9. Our calculations show that the flux at in the observed frame of the model galaxy ranges from mJy at to mJy at . With an array of 50 antennas and an integration of 10 hours, ALMA may be able to detect such galaxies at with a 3 significance. However, since galaxies do not have a lot of young stars and much dust at , observations in continuum by ALMA becomes more difficult, and it would need tens of hours of integration time. In contrast, JWST appears to be more powerful to detect the earliest galaxies as the one we model here, because it can detect the UV continuum in rest frame up to . The emission is strong even at , which may be observable by Near-Infrared Spectrograph (NIRSpec) on JWST. The NIRSpec will have the detection threshold of with and by exposure time of seconds.
We note that in the above estimation, IGM absorption and transmission were not taken into account. The IGM can significantly suppress the flux, and the transmission highly depends on viewing angle (e.g., Laursen et al., 2011) by inhomogeneous ionization structure in IGM (e.g., Abel et al., 2007; Yoshida et al., 2007; Jeeson-Daniel et al., 2012), which make the detection more difficult. Of course, the galaxies we present here represent progenitor of a local galaxy such as the Milky Way. Galaxies formed in highly overdense regions are likely much more massive (Li et al., 2007), and may be more easily detected by both ALMA and JWST (Li et al, in preparation).
4. Discussions
The gas inflow feature is present in our simulation with outflow from stellar feedback. In order to probe the effect of stellar wind on the gas inflow, we also performed the simulation with a pure thermal feedback model, in which the feedback from supernovae is only in thermal energy. In such a model, some fraction of thermal energy can quickly escape as cooling radiation before conversion to kinetic energy. As a result, gas outflow does not occur efficiently.
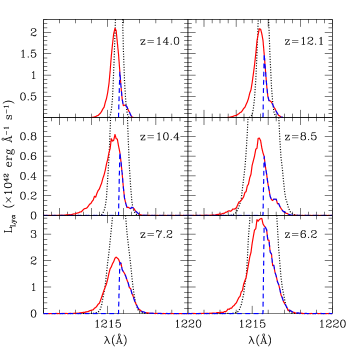
The resulting line profiles and the probability distribution function of the neutral gas mass are shown in Figure 10 and Figure 11, respectively. Without a strong outflow, the line profiles show more pronounced blue wing. However, due to the IGM transmission, flux at the blue wing can be suppressed significantly. If photons at shorter wavelength than the line center are suppressed, 0.69 (0.44) of flux from the galaxies at is lost (see the blue dash lines in Figure 10).
The galaxy in our simulation resides in a low overdensity region and it represents those that would evolve into present-day galaxies such as the MW, so it may not be the very first one formed in the universe. It is believed that the most massive halos in the highly overdense regions collapse first, in which the first stars form (e.g., Abel et al., 2002; Bromm & Larson, 2004; Gao et al., 2007; Yoshida et al., 2008). These may also be the formation sites of the very first galaxies, owing to feedback and chemical enrichment from the PopIII stars, as well as abundant gas supply (Li et al., 2007; Bromm et al., 2009).
One of the major limitations of our model is that the cosmological simulation does not have sufficient resolutions to follow the formation and evolution of individual stars. Instead, star formation is modeled using a “sub-grid” recipe based on the observed Schmidt-Kennicutt Law (Kennicutt, 1998). Gas particles are converted into stars once it is cooled below K and the density is above a threshold (Springel & Hernquist, 2003). Although this treatment is rather simplistic, it nevertheless gives a global star formation history close to what is believed of the MW galaxy.
Another major limitation is that our current RT calculations do not include the propagation and scattering of and ionizing photons in the IGM. We make the prediction that galaxies with inflow of cold gas would result in asymmetric, blue-shifted line profiles. However, as discussed earlier, the absorption by IGM may change the the profile to one with extended red wing. We will study this issue in more detail in future work that includes the radiative transfer of and ionizing photons in the IGM.
5. Summary
In this work, we have investigated the formation of a typical, nearby galaxy such as the MW, and its properties at the earliest evolutionary stage. We combine a cosmological hydrodynamic simulation, which uses the Aquila initial condition and focuses on a MW-like galaxy, with three-dimensional radiative transfer calculations using the improved code, which couples multi-wavelength continuum, line, and ionization of hydrogen.
We find that the modeled MW galaxy forms from efficient accretion of cold gas early on, which sustains a high star formation rate from . The cold accretion produces strong emission via collisional excitation, which has a luminosity from at to at . The escape fraction of photons increases from at to at , due to less dust content at higher redshift. The EWs of the lines increases with redshift, from at to at . Such high EWs may be due to significant contribution to emission by excitation cooling, which dominates at high redshift. The resulting lines exhibit asymmetric, mostly single-peak profiles shifted to the blue wing, a characteristic feature of inflow.
Furthermore, we demonstrate that progenitors of local galaxies such as the modeled one may be detected at by JWST and ALMA with a reasonable integration time. At higher redshift , however, only line may be observable by spectroscopic surveys with similar detection limit as JWST.
Our results suggest that line may be used to probe the formation and evolution, and gas properties of distant galaxies. It is perhaps one of the most powerful tools to detect the first generation of galaxies in the coming decade.
References
- Abel et al. (2002) Abel, T., Bryan, G. L., & Norman, M. L. 2002, Science, 295, 93
- Abel et al. (2007) Abel, T., Wise, J. H., & Bryan, G. L. 2007, ApJ, 659, L87
- Beichman et al. (2012) Beichman, C. A. and Rieke, M. and Eisenstein, D., et al. 2012, Proceedings of the SPIE, Space Telescopes and Instrumentation 2012: Optical, Infrared, and Millimeter Wave., Volume 8442
- Birnboim & Dekel (2003) Birnboim, Y. & Dekel, A. 2003, MNRAS, 345, 349
- Bouwens & Illingworth (2006) Bouwens, R. J. & Illingworth, G. D. 2006, Nature, 443, 189
- Bouwens et al. (2011) Bouwens, R. J., Illingworth, G. D., Labbe, I., et al. 2011, Nature, 469, 504
- Bouwens et al. (2010) Bouwens, R. J., Illingworth, G. D., Oesch, P. A., et al. 2010, ApJ, 709, L133
- Bouwens et al. (2004) Bouwens, R. J., Thompson, R. I., Illingworth, G. D., et al. 2004, ApJ, 616, L79
- Bromm & Larson (2004) Bromm, V. & Larson, R. B. 2004, ARA&A, 42, 79
- Bromm & Yoshida (2011) Bromm, V. & Yoshida, N. 2011, ARA&A, 49, 373
- Bromm et al. (2009) Bromm, V., Yoshida, N., Hernquist, L., & McKee, C. F. 2009, Nature, 459, 49
- Brooks et al. (2009) Brooks, A. M., Governato, F., Quinn, T., Brook, C. B., & Wadsley, J. 2009, ApJ, 694, 396
- Bruzual & Charlot (2003) Bruzual, G. & Charlot, S. 2003, MNRAS, 344, 1000
- Bryan & Norman (1998) Bryan G. L., Norman M. L., 1998, AJ, 495, 80
- Davé et al. (1999) Davé, R., Hernquist, L., Katz, N., & Weinberg, D. H. 1999, ApJ, 511, 521
- Dekel & Birnboim (2006) Dekel, A. & Birnboim, Y. 2006, MNRAS, 368, 2
- Dekel et al. (2009) Dekel, A., Birnboim, Y., Engel, G., et al. 2009, Nature, 457, 451
- Di Matteo et al. (2011) Di Matteo, T., Khandai, N., DeGraf, C., et al. 2012, ApJ, 745, L29
- Dijkstra et al. (2007) Dijkstra, M., Lidz, A., & Wyithe, J. S. B. 2007, MNRAS, 377, 1175
- Dijkstra & Loeb (2009) Dijkstra, M. & Loeb, A. 2009, MNRAS, 400, 1109
- Dijkstra & Wyithe (2010) Dijkstra, M. & Wyithe, J. S. B. 2010, MNRAS, 408, 352
- Faucher-Giguère et al. (2010) Faucher-Giguère, C., Kereš, D., Dijkstra, M., Hernquist, L., & Zaldarriaga, M. 2010, ApJ, 725, 633
- Faucher-Giguère et al. (2009) Faucher-Giguère, C., Lidz, A., Zaldarriaga, M., & Hernquist, L. 2009, ApJ, 703, 1416
- FInkelstein et al. (2013) Finkelstein, S. L., Papovich, C., Dickinson, M., et al. 2013, Nature, 502, 524
- Gao et al. (2007) Gao, L., Yoshida, N., Abel, T., et al. 2007, MNRAS, 378, 449
- Goerdt et al. (2010) Goerdt, T., Dekel, A., Sternberg, A., et al. 2010, MNRAS, 407, 613
- Greif et al. (2010) Greif, T. H., Glover, S. C. O., Bromm, V., & Klessen, R. S. 2010, ApJ, 716, 510
- Gronwall et al. (2007) Gronwall, C., Ciardullo, R., Hickey, T., et al. 2007, ApJ, 667, 79
- Haardt & Madau (1996) Haardt, F. & Madau, P. 1996, ApJ, 461, 20
- Hernquist & Katz (1989) Hernquist, L. & Katz, N. 1989, ApJS, 70, 419
- Hasegawa & Semelin (2013) Hasegawa, K., & Semelin, B. 2013, MNRAS, 428, 154
- Hu et al. (2010) Hu, E. M., Cowie, L. L., Barger, A. J., et al. 2010, ApJ, 725, 394
- Hui & Gnedin (1997) Hui, L. & Gnedin, N. Y. 1997, MNRAS, 292, 27
- Iye et al. (2006) Iye, M., Ota, K., Kashikawa, N., et al. 2006, Nature, 443, 186
- Jeeson-Daniel et al. (2012) Jeeson-Daniel, A., Ciardi, B., Maio, U., et al. 2012, MNRAS, 424, 2193
- Jeon et al. (2012) Jeon, M., Pawlik, A. H., Greif, T. H., et al. 2012, ApJ, 754, 34
- Kashikawa et al. (2011) Kashikawa, N., Shimasaku, K., Matsuda, Y., et al. 2011, ApJ, 734, 119
- Katz et al. (2003) Katz, N., Keres, D., Dave, R., & Weinberg, D. H. 2003, in Astrophysics and Space Science Library, Vol. 281, The IGM/Galaxy Connection. The Distribution of Baryons at z=0, ed. J. L. Rosenberg & M. E. Putman, 185–+
- Katz et al. (1996) Katz, N., Weinberg, D. H., Hernquist, L., & Miralda-Escude, J. 1996, ApJ, 457, L57+
- Kennicutt (1998) Kennicutt, Jr., R. C. 1998, ARA&A, 36, 189
- Kereš et al. (2009) Kereš, D., Katz, N., Fardal, M., Davé, R., & Weinberg, D. H. 2009, MNRAS, 395, 160
- Kereš et al. (2005) Kereš, D., Katz, N., Weinberg, D. H., & Davé, R. 2005, MNRAS, 363, 2
- Komatsu et al. (2009) Komatsu, E., Dunkley, J., Nolta, M. R., et al. 2009, ApJS, 180, 330
- Latif et al. (2011) Latif, M. A., Zaroubi, S., & Spaans, M. 2011, MNRAS, 411, 1659
- Laursen et al. (2011) Laursen, P., Sommer-Larsen, J., & Razoumov, A. O. 2011, ApJ, 728, 52
- Lehnert et al. (2010) Lehnert, M. D., Nesvadba, N. P. H., Cuby, J., et al. 2010, Nature, 467, 940
- Li et al. (2007) Li, Y., Hernquist, L., Robertson, B., et al. 2007, ApJ, 665, 187
- Li et al. (2008) Li, Y., Hopkins, P. F., Hernquist, L., et al. 2008, ApJ, 678, 41
- Malhotra & Rhoads (2004) Malhotra, S. & Rhoads, J. E. 2004, ApJ, 617, L5
- Matsuda et al. (2012) Matsuda, Y., Yamada, T., Hayashino, T., et al. 2012, MNRAS, 425, 878
- Ocvirk et al. (2008) Ocvirk, P., Pichon, C., & Teyssier, R. 2008, MNRAS, 390, 1326
- Ono et al. (2012) Ono, Y., Ouchi, M., Mobasher, B., et al. 2012, ApJ, 744, 83
- Osterbrock & Ferland (2006) Osterbrock, D. E. & Ferland, G. J. 2006, Astrophysics of gaseous nebulae and active galactic nuclei, ed. Osterbrock, D. E. & Ferland, G. J., Astrophysics of gaseous nebulae and active galactic nuclei
- Ouchi et al. (2008) Ouchi, M., Shimasaku, K., Akiyama, M., et al. 2008, ApJS, 176, 301
- Ouchi et al. (2010) Ouchi, M., Shimasaku, K., Furusawa, H., et al. 2010, ApJ, 723, 869
- Rosdahl & Blaizot (2012) Rosdahl, J., & Blaizot, J. 2012, MNRAS, 423, 344
- Salpeter (1955) Salpeter, E. E. 1955, ApJ, 121, 161
- Santos (2004) Santos, M. R. 2004, MNRAS, 349, 1137
- Scannapieco et al. (2012) Scannapieco, C., Wadepuhl, M., Parry, O. H., et al. 2012, MNRAS, 423, 1726
- Schmidt (1959) Schmidt, M. 1959, ApJ, 129, 243
- Shibuya et al. (2012) Shibuya, T., Kashikawa, N., Ota, K., et al. 2012, ApJ, 752, 114
- Springel (2005) Springel, V. 2005, MNRAS, 364, 1105
- Springel et al. (2005) Springel, V., Di Matteo, T., & Hernquist, L. 2005, MNRAS, 361, 776
- Springel & Hernquist (2002) Springel, V. & Hernquist, L. 2002, MNRAS, 333, 649
- Springel & Hernquist (2003) —. 2003, MNRAS, 339, 289
- Springel et al. (2008) Springel, V., Wang, J., Vogelsberger, M., et al. 2008, MNRAS, 391, 1685
- Springel et al. (2001) Springel, V., Yoshida, N., & White, S. D. M. 2001, New Astronomy, 6, 79
- Stark et al. (2011) Stark, D. P., Ellis, R. S., & Ouchi, M. 2011, ApJ, 728, L2
- Stark et al. (2007) Stark, D. P., Ellis, R. S., Richard, J., et al. 2007, ApJ, 663, 10
- Thoul & Weinberg (1996) Thoul, A. A., & Weinberg, D. H. 1996, ApJ, 465, 608
- Vanzella et al. (2011) Vanzella, E., Pentericci, L., Fontana, A., et al. 2011, ApJ, 730, L35
- Wadepuhl & Springel (2011) Wadepuhl, M. & Springel, V. 2011, MNRAS, 410, 1975
- Wise & Abel (2007) Wise, J. H. & Abel, T. 2007, ApJ, 665, 899
- Wise & Abel (2008) —. 2008, ApJ, 685, 40
- Wise et al. (2008) Wise, J. H., Turk, M. J., & Abel, T. 2008, ApJ, 682, 745
- Wise et al. (2012) Wise, J. H., Turk, M. J., Norman, M. L., & Abel, T. 2012, ApJ, 745, 50
- Yajima et al. (2012a) Yajima, H., Li, Y., Zhu, Q., & Abel, T. 2012a, MNRAS, 424, 884
- Yajima et al. (2012b) Yajima, H., Li, Y., Zhu, Q., et al. 2012b, ApJ, 754, 118
- Yajima et al. (2012c) Yajima, H., Li, Y., Zhu, Q., et al. 2012c, submitted to MNRAS, arXiv: 1209.5842
- Yoshida et al. (2007) Yoshida, N., Oh, S. P., Kitayama, T., & Hernquist, L. 2007, ApJ, 663, 687
- Yoshida et al. (2008) Yoshida, N., Omukai, K., & Hernquist, L. 2008, Science, 321, 669
- Zheng et al. (2010) Zheng, Z., Cen, R., Trac, H., & Miralda-Escudé, J. 2010, ApJ, 716, 574
- Zheng & Miralda-Escudé (2002) Zheng, Z. & Miralda-Escudé, J. 2002, ApJ, 578, 33
- Zhu et al. (2010) Zhu, Q. and Li, Y. and Sherman, S. 2012, submitted to ApJ, arXiv: 1211.0013