The Spatial Distribution of Dust and Stellar Emission of the Magellanic Clouds
Abstract
We study the emission by dust and stars in the Large and Small Magellanic Clouds, a pair of low-metallicity nearby galaxies, as traced by their spatially resolved spectral energy distributions (SEDs). This project combines Herschel Space Observatory PACS and SPIRE far-infrared photometry181818 The data were obtained as part of the HERschel Inventory of The Agents of Galaxy Evolution survey (HERITAGE; P.I., M. Meixner). with other data at infrared and optical wavelengths. We build maps of dust and stellar luminosity and mass of both Magellanic Clouds, and analyze the spatial distribution of dust/stellar luminosity and mass ratios. These ratios vary considerably throughout the galaxies, generally between the range and . We observe that the dust/stellar ratios depend on the interstellar medium (ISM) environment, such as the distance from currently or previously star-forming regions, and on the intensity of the interstellar radiation field (ISRF). In addition, we construct star formation rate (SFR) maps, and find that the SFR is correlated with the dust/stellar luminosity and dust temperature in both galaxies, demonstrating the relation between star formation, dust emission and heating, though these correlations exhibit substantial scatter.
Subject headings:
galaxies: general - infrared: galaxies - galaxies: ISM - dust, extinction - galaxies: evolution - Magellanic Clouds1. Introduction
Among the nearby galaxies, the Small Magellanic Cloud (SMC) and Large Magellanic Cloud (LMC) represent unique astrophysical laboratories for studies of the lifecycle of the interstellar medium (ISM), because of their proximity ( and for the LMC and SMC, respectively; Ngeow & Kanbur 2008; Szewczyk et al. 2009), low metallicity ( and ; Dufour et al. 1982; Russell & Dopita 1992), and favorable viewing angle ( for the LMC; Nikolaev et al. 2004). The SMC and LMC (MCs) are well-suited for detailed studies of galaxy evolution processes, either as whole galaxies or on the scales of individual star-forming regions or resolved stellar populations. In particular, these galaxies are suited for studies of the ISM phases, interstellar dust properties, and star formation rates as a function of metallicity and radiative environment (i.e., the intensity and hardness of the radiation field).
The MCs are also unusual as relatively bright ‘satellite’ galaxies (compared to other satellites) very close to the Milky Way (MW). The luminosity distributions of satellite galaxies in groups have been the subject of many statistical studies (e.g., Skibba et al. 2007; van den Bosch et al. 2007), and some recent studies have focused on MW-like galaxies with MC-like satellites in the Sloan Digital Sky Survey, Galaxy And Mass Assembly, and in models and simulations (e.g, Liu et al. 2011; Tollerud et al. 2011; Sales et al. 2011; Busha et al. 2011; Robotham et al. 2012). In addition, analyses of the MCs’ star formation, structures, and velocities have yielded evidence for tidal interactions between the LMC and SMC: the Magellanic Bridge and SMC Wing appear to consist of tidally stripped material; there is tidally triggered star formation within the MCs and the Magellanic Bridge; and the LMC’s offset and warped bar are arguably due to a previous collision with the SMC (Yoshizawa & Noguchi 2003; Mastropietro et al. 2005; Harris 2007; D’Onghia & Lake 2008; Gordon et al. 2009, 2011; Bekki 2011; Besla et al. 2012; Cignoni et al. 2012).
Nearly half of the bolometric luminosity of the Universe is channeled through the mid- and far-infrared (IR) emission of galaxies (e.g., Hauser & Dwek 2001). Therefore, in order to develop a more complete picture of galaxy evolution, it is necessary to study the IR emission that is reprocessed by dust in galaxies. We seek to understand the physical processes that regulate galaxy evolution, including the formation of stars and the interstellar radiation field (ISRF), and the return of radiant energy from these stars into the ISM.
IR observations of galaxies have yielded insight into the nature and spatial distribution of their dust content, including its extinction and emission properties (e.g., dust temperature), as well as its composition, grain size distribution, and abundance (e.g., dust mass). A variety of studies have investigated these issues in the MCs, often utilizing mid- and far-IR observations, in order to constrain their dust properties (e.g., Weingartner & Draine 2001; Bot et al. 2004, 2010; Sakon et al. 2006; Bernard et al. 2008; Paradis et al. 2009, 2011; Gordon et al. 2010; Sandstrom et al. 2010; Galliano et al. 2011; Planck Collaboration 2011). By combining IR and other data, some studies have also explored how dust production, destruction, and heating are related to atomic and molecular gas content, star formation, and the interstellar radiation field. For example, constraints on the dust and gas content are sufficient to estimate gas-to-dust ratios and deviations from its expected metallicity dependence (Stanimirović et al. 2000; Gordon et al. 2003; Leroy et al. 2007; Galliano et al. 2011).
In general, analyses of the spectral energy distributions (SEDs) of galaxies yield information about the relation and balance between dust and stellar emission, by exploiting multi-wavelength observations (e.g., Draine et al. 2007; Dale et al. 2007; da Cunha et al. 2010; Skibba et al. 2011). The spatial distribution of dust vis-à-vis stellar luminosity and mass is the main focus of this paper. The distribution of dust/stellar ratios within galaxies, and its connection to star formation and dust heating, has important implications about the energy conversion from stellar to dust emission.
It is now possible, with data from IRAS, Spitzer, and Herschel, to constrain the radial distributions of dust and stars within galaxies (Sauvage et al. 1990; Zaritsky 1999; Muñoz-Mateos et al. 2009; Mattsson & Andersen 2012), and to analyze the spatial distribution of dust, gas, and starlight in the MW (Paradis et al. 2012), M31 (Smith et al. 2012), M33 (Boquien et al. 2011), and M83 (Foyle et al. 2012), and other nearby galaxies (Aniano et al. 2012; Galametz et al. 2012). Others have added optical, , and UV observations to constrain the evolution and environmental dependence of star formation in the LMC and SMC (Bell et al. 2002; Harris & Zaritsky 2004, 2009; Blair et al. 2009; Lawton et al. 2010), and clustering analyses have demonstrated the hierarchical formation of star clusters and dust clumps (Bonatto & Bica 2010; Kim et al. 2010).
We build upon this work by examining the resolved spatial distribution of dust and stellar emission within the MCs, using new far-IR and submillimeter (submm) photometry from the HERITAGE survey (Meixner et al. 2010; Meixner et al., in prep.), near-IR photometry from the Spitzer Surveying the Agents of Galaxy Evolution (SAGE, Meixner et al. 2006; SAGE-SMC, Gordon et al. 2011) surveys, and the Southern Sky Survey Atlas (SHASSA, Gaustad et al. 2001). Our goal is to explore the energy balance and abundance of dust and stars throughout the LMC and SMC, and their implications for galaxy evolution.
This paper is organized as follows. We describe the data and their processing in the next section, and in Section 3, we describe the dust and stellar properties that we analyze in the paper. In Sections 4, 5, and 6, we present our main results: we construct and interpret maps of dust luminosity, dust/stellar luminosity and mass, and SFR, for the LMC and SMC. We focus on the relation between dust/stellar ratios and other properties, especially dust heating and star formation. We conclude with a summary and discussion of our results.
2. Data
We briefly describe below the data used in this paper. We refer the reader to Meixner et al. (2010; Meixner et al., in prep.) for details about the observations using the Herschel Space Observatory (Pilbratt et al. 2010) and data reductions.
HERITAGE is a uniform survey of the LMC, SMC, and Magellanic Bridge with the Spectral and Photometric Imaging Receiver (SPIRE) at 250, 350 and 500 m (Griffin et al. 2010) and the Photodetector Array Camera and Spectrometer (PACS) at 100 and 160 m (Poglitsch et al. 2010). The SPIRE beam sizes are approximately 18, 25, and at 250, 350, and 500 m, and the flux calibration uncertainties are at most . The PACS beam sizes are 7 and at 100 and 160 m, and the calibration uncertainties are at most . The data were processed using the HIPE 7.0 data reduction software (Ott 2010). The images were converted from Jy/pixel (PACS) and Jy/beam (SPIRE) to MJy/sr.
To these we add ancillary data, including imaging from the MIPS (Rieke et al. 2004; 24, 70, and 160 m) and IRAC (Fazio et al. 2004; 3.6, 4.5, 5.8, and 8 m) instruments on board Spitzer Space Telescope (Meixner et al. 2006; Gordon et al. 2011), and imaging from the SHASSA (Gaustad et al. 2001) survey.
The LMC and SMC multi-wavelength photometry are at different resolutions. In order to use these data together, it is necessary to convolve them to a common resolution (that of SPIRE m) to generate images with a common point spread function (PSF). We use the convolution kernels of Aniano et al. (2011), which use techniques similar to those of Gordon et al. (2008). We then subtract a constant background from the images, by fitting Gaussian distributions to the flux densities beyond the galaxies; data within of the background are not used. We subsequently crop the images and align them with each other, yielding image arrays of the same dimensions, with pixel size (3.4 and 4.1 pc linear size for the LMC and SMC). These are the images that we use for computing dust and stellar luminosities and masses in the following sections.
3. Description of Galaxy Properties
In this section, we describe the dust and stellar properties of the Magellanic Clouds that we will use throughout the paper. Our goal is to analyze the relations between these dust and stellar properties within the MCs. All of the properties are inferred from the resolved SEDs, except for the SFR, which includes data.
3.1. Dust Properties
3.1.1 Dust Luminosity
The ‘dust luminosity’ is a useful quantity because it can be directly inferred from the IR fluxes, and because it can be used as a proxy for the obscured star formation as well as the temperature of dust grains (e.g., Dale & Helou 2002; Draine & Li 2007).
Following Skibba et al. (2011; hereafter S11), we measure the dust luminosity as follows:
| (1) |
where is the distance to the galaxy, is the flux density at wavelength , and the integration is performed between . The resolved SED is interpolated between the bands over this range, and pixels with noisy or missing far-IR data are not included. Unlike in S11, we have not subtracted the stellar emission from the mid-IR bands before performing the integration, as they found that the level of contamination was negligible for dwarf and late-type galaxies (less than a few per cent); the contamination by starlight is negligible throughout the LMC and SMC as well. We also do not extrapolate beyond 500m, as this contribution is negligible as well (less than ). is usually dominated by the fluxes between .
The luminosities are converted from erg/s/sr to erg/s/, and then we normalize by the solar luminosity . By summing over the pixels of these surface density maps, we obtain total luminosities of for the SMC and for the LMC. These values appear to be consistent with the SED analyses of Israel et al. (2010) and Meixner et al. (in prep.), though a direct comparison is not possible.
3.1.2 Dust Temperature
The dust temperatures and masses are estimated from fitting the PACS and SPIRE far-IR and submm (100–500 m) SED with a single-temperature blackbody (i.e., a blackbody of temperature ) modified by an emissivity law of :
| (2) |
where is the Planck function. The emissivity exponent at m is taken to be . At longer wavelengths, the emissivity law is allowed to vary so as to fit the surface brightnesses measured in the SPIRE 350 and 500 m bands, and typically varies between throughout the galaxies. These values of the emissivity index are consistent with previous studies (Sakon et al. 2006; Paradis et al. 2011; Planck Collaboration 2011). This model has been developed to produce small fractional residuals and to be consistent with constraints from gas-to-dust ratios (see also Galliano et al. 2011). We use preliminary dust temperature (and mass) maps from Gordon et al. (in prep.), and we refer the reader to that paper and Gordon et al. (2010) for details. The approach here is similar to that of Engelbracht et al. (2010) and S11.
We note that the dust temperature and the emissivity index are not independent; indeed, an inverse correlation between and has been observed, which some have argued is due to physical properties of the dust grains (Dupac et al. 2003; Paradis et al. 2011; Juvela & Ysard 2012) or to noise (Shetty et al. 2009; Kelly et al. 2012).
The modified-blackbody approach closely reproduces the 100–500 m PACS and SPIRE photometry, but underpredicts the MIPS 70 m photometry. The ‘70 m excess’ (i.e. the excess of the 70 m flux densities measured by MIPS over that predicted from the single-temperature modified-blackbody fitting) is briefly discussed in Appendix B as arising from stochastically heated small grains, or from the fact that the single-temperature assumption is not realistic.
3.1.3 Dust Mass
With (and ) determined from Eqn. (2), we obtain the dust mass from :
| (3) |
where is the mass absorption coefficient at wavelength . This is modeled as a single component with an average temperature. A model including a second, cold dust component also yields good fits, though recent analyses of far-IR SEDs with Herschel data have shown that assuming a cold dust component yields dust masses that are too large based on metallicity constraints (e.g., Bot et al. 2010; De Looze et al. 2012; Aniano et al. 2012; Galametz et al. 2012).
To compute in Eqn. (3), for spherical grains of radius , , where is the absorption efficiency and is the mass density of the dust. For submicron-sized silicate grains () , we obtain (Laor & Draine 1993; Li & Draine 2001). The masses are computed at m, in order to minimize the dependence on temperature and emissivity variations, as well as flux uncertainties (Gordon et al., in prep.). In contrast, S11 used 500 m as the reference wavelength; however, the relative spatial distribution is not strongly dependent on this choice. The absolute values of the masses may be affected by up to by the adopted reference wavelength (see S11), though for low-mass irregular galaxies with significant ‘submm excesses’ (e.g., Bot et al. 2010; Galametz et al. 2011) it is accurate to use m.
By summing over the pixels of these dust mass (surface density) maps, we obtain total masses of for the LMC and for the SMC. The LMC mass estimate is consistent with the value of obtained by Bernard et al. (2008) and Galliano et al. (2011), and the SMC mass is approximately consistent with obtained by Leroy et al. (2007). The spatial resolution here is sufficient to yield unbiased total masses (see also Galliano et al. 2011; Aniano et al. 2012); based on the results of Galliano et al., the mass values may be affected by up to 10%.
3.2. Stellar Properties
3.2.1 Stellar Luminosity
We will use the 3.6 m and 4.5 m photometry as an indicator of stellar luminosity and mass in this section and the next section. Emission at these wavelengths is strongly correlated with the spatial distribution of stellar light and mass, especially that of old stars, but using these wavelengths alone could be contaminated by nonstellar contributions (Mentuch et al. 2010; Zibetti & Groves 2011; Meidt et al. 2012). For example, hot dust and the 3.3 m PAH (polycyclic aromatic hydrocarbon) emission can cause appreciable contamination, contributing of the integrated light at 3.6 m in star-forming regions (Meidt et al. 2012). The near-IR -band luminosity would be a superior tracer of stellar light and mass (Zibetti et al. 2009), for example, but such measurements with resolution and relative sensitivity similar to the other data used here do not yet exist.
Here we will attempt to infer a ‘bolometric’ stellar luminosity , comparable to the dust luminosity (Eqn. 1). For most of the nearby galaxies in S11, was essentially estimated from UV to 5 m wavelengths, allowing us to constrain the distribution of as a function of and for galaxies similar to the LMC and SMC, with similar morphologies and masses. We can also estimate similar global quantities for the MCs, using the published SEDs (Israel et al. 2010; Gordon et al. 2011). The LMC and SMC have and 130, respectively, which are slightly lower values than the comparable galaxies in S11 (which had ), but their ratios are similar. At fixed m luminosity, it is unclear whether or to what extent is significantly correlated with , so we choose not to include a correction based on this.
For simplicity, we adopt , where is a proportionality constant based on the global stellar SEDs of the LMC and SMC (i.e., the factor of 80 or 130), while acknowledging that this approximation introduces an uncertainty of , based on the distribution of of the comparable nearby galaxies in S11. In addition, from the 3.6 m residual (point-source subtracted) images (Meixner et al. 2006; Gordon et al. 2011, we estimate that our values are affected up to from contamination by non-stellar sources. The resulting maps have uncertainties of dex.
3.2.2 Stellar Mass
To estimate the MCs’ stellar mass, we will use the calibration of Eskew et al. (2012). This calibration converts from the 3.6 and 4.5 m flux densities ( and ) to stellar mass , and it is based on a detailed analysis of the LMC, for which they find a scatter of approximately 30% in mass around the mean relationship:
| (4) |
where the flux densities and are in Jy and the distance is in Mpc.
As discussed above, using these wavelengths rather than near-IR (e.g., -band) fluxes yields a potentially biased indicator of stellar mass, and may in some regions be affected by hot dust and PAH emission (e.g., Zibetti & Groves 2011). In particular, Eskew et al. (2012) note that regions that deviate significantly from their calibration often have young stellar populations ( Myr old) and high 8 m flux. They also acknowledge that the calibration could depend on metallicity, but they were unable to explore this issue because there is little variation in metallicity in the LMC (Pagel et al. 1978); however, constraining any metallicity dependence of the calibration is beyond the scope of this paper. Note that Eskew et al. adopt a Salpeter initial mass function (IMF), and argue that their inferred stellar mass-to-light ratios moderately disfavor a bottom-light IMF. The reader should bear these caveats in mind.
The resulting stellar mass () maps have typical values of approximately and in the LMC and SMC, respectively. (The dust masses in Section 3.1.3 are lower, having typical values of approximately and in the LMC and SMC, respectively.) By integrating over the stellar mass (surface density) maps, we obtain total masses of for the LMC and for the SMC, consistent with Harris & Zaritsky (2004, 2009).
3.2.3 Star Formation Rate
We now use the combination m as a star formation rate indicator, in order to account for both obscured and unobscured star formation (e.g., Calzetti et al. 2007; Kennicutt et al. 2009; Leroy et al. 2012).
We use data from the SHASSA survey (Gaustad et al. 2001). We did not attempt to remove contamination by [NII] emission lines, which could contribute more than 20% relative to for some objects (Gaustad et al. 2001), but is of order 10% or less for faint dwarf and late-type galaxies like the MCs (Kennicutt et al. 2008) and is not expected to significantly affect the resulting SFRs.
The SHASSA images are not very deep, and their beam size is larger than that of SPIRE 500 m (). SHASSA uses a filter centered at 6563Å with a 32Å bandwidth. The LMC and SMC are in fields 013 and 510, respectively, and for the analysis presented here, the SHASSA continuum-subtracted map has been used. Since the SHASSA images are at poorer resolution than that of SPIRE 500 m, we fit a Gaussian PSF to the continuum images, constructed a convolution kernel, and convolved the 24 m images to this resolution, using the code designed by Gordon et al. (2008). A common resolution is necessary to combine and m luminosities in the SFR calibration. The SHASSA images are in units of deci-Rayleighs, which are converted to our flux density units ( at Å).
We compute SFRs of the MCs on a pixel-by-pixel basis, using the calibration proposed by Calzetti et al. (2010), which is calibrated for normal galaxies and H ii regions:
| (5) |
where the luminosities are in units of , and . The coefficients , and , are tuned to recover the dust-obscured SFR, as opposed to emission due to transiently heated dust grains (Calzetti et al. 2007). This calibration has a scatter of less than 0.2 dex, and it assumes a Kroupa IMF (converting from a Kroupa to Salpeter implies SFRs larger by a factor of ). Note that our SFR maps may be inaccurate in regions with diffuse ‘IR cirrus’ dust emission, were the dust may be only partially heated by young stars (see Kennicutt et al. 2009).
Our approach differs from the one recently proposed by Leroy et al. (2012), which applies detailed dust models to the far-IR SED to account for emission due to the ‘cirrus’ radiation field, rather than simply using the and 24 m luminosities. In addition, their star formation surface density is averaged over larger areas ( resolution) than our analysis of the Magellanic Clouds. The 24 m contribution can result in up to 0.2 dex uncertainty in the total m SFR; however, in both the LMC and SMC, we find that the 24 m contribution is rather small: in Eqn. 5, 80% and 92% of the pixels in the LMC and SMC, respectively, have .
The integrated properties of the LMC and SMC are summarized in Table 1.
4. Distribution of Dust Luminosity and Mass
We begin by analyzing the distribution of dust luminosity. As stated in Section 3.1.1, these utilize Herschel data, integrating the luminosity at .
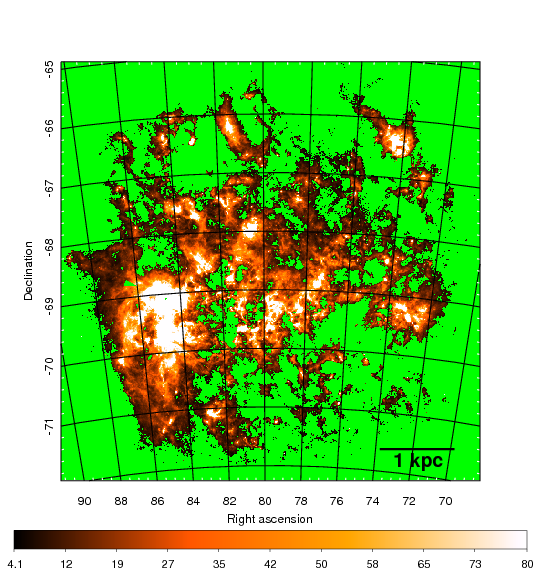
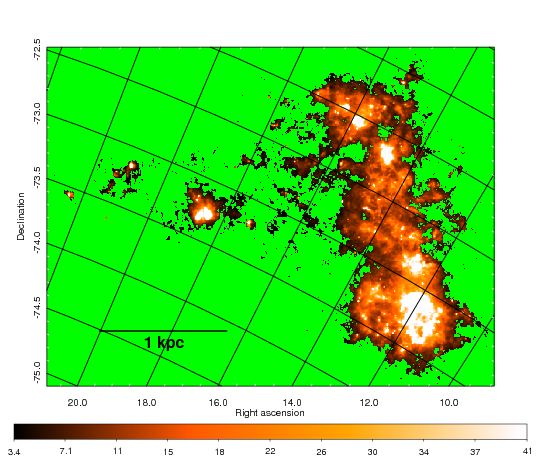
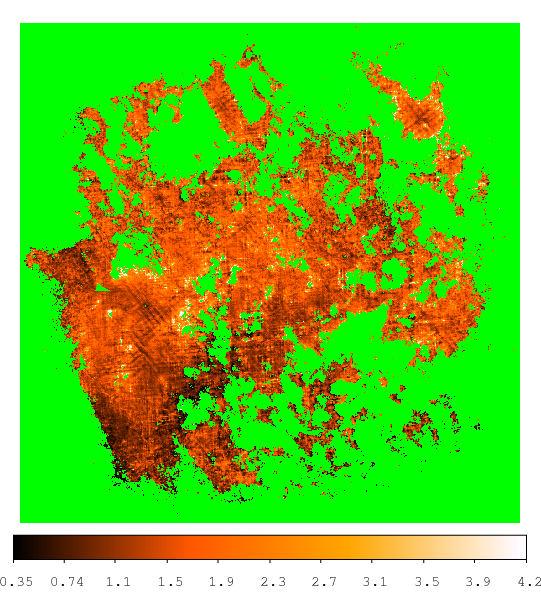
In Figure 1, we show the dust luminosity maps of the LMC and SMC. Here and throughout the paper, we apply a far-IR signal-to-noise cut, following Gordon et al. (in prep.). The dust luminosity is typically in the range of within the LMC and within the SMC, with the distributions broadly peaking at and , respectively. The distributions of the MCs have “tails” at the bright end, as can be seen in the bright regions in the figure, and the distributions are not affected by the signal/noise threshold used to make the masks, as pixels with noisy data and poor S/N have been masked out. In Appendix A, we compare this dust luminosity to the total IR luminosity inferred from shorter wavelengths (m), and show that they have only small differences.
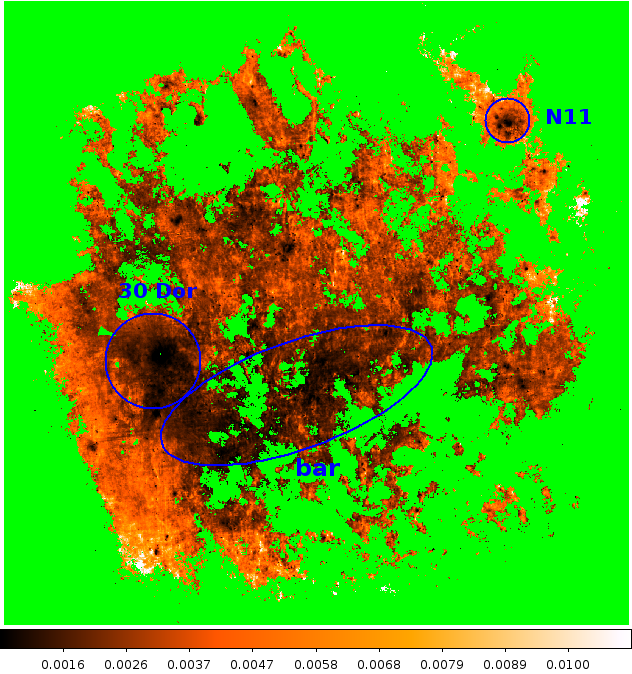
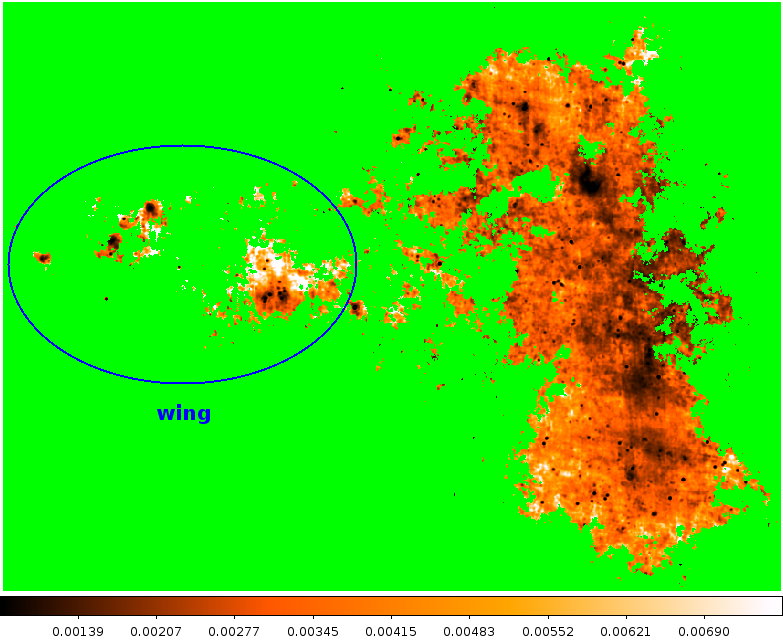
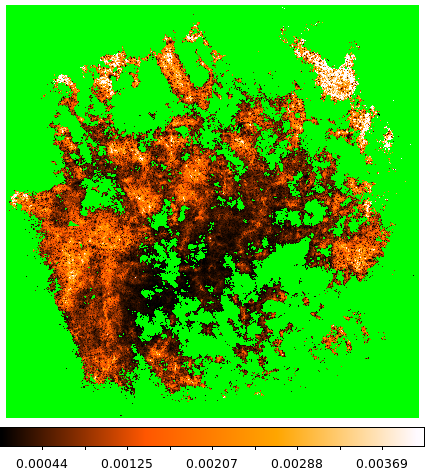
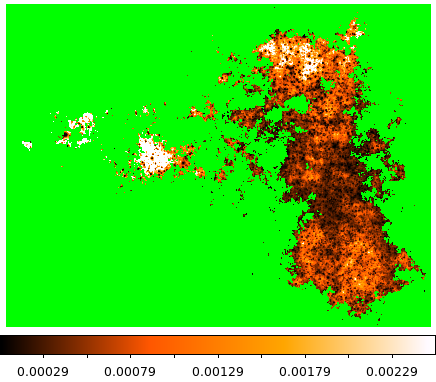
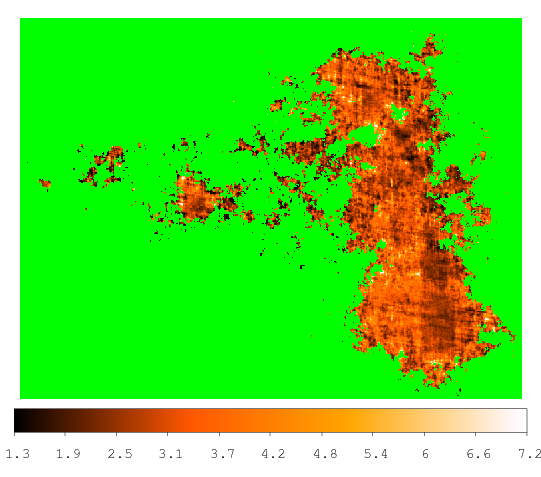
We now can compare the dust mass to dust luminosity, using the ratio, which is shown for the LMC and SMC in Figure 2. typically ranges from 0.001 to in both MCs, with a mean of .
The ratio has an inverted distribution with respect to that of , such that it tends to be low in regions where is high, such as within and near the bar of the LMC.
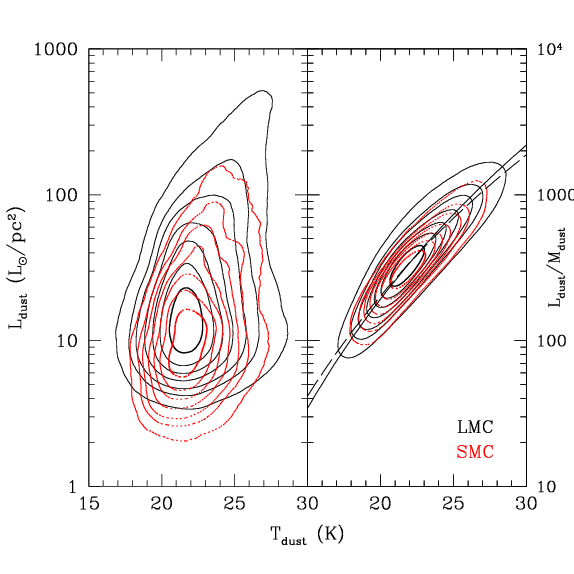
We show this explicitly in Figure 3, plotting the and distributions of pixels in the LMC and SMC. Approximately 1,000,000 and 110,000 pixels were used for the LMC and SMC, respectively. We also plot versus in the right panel of Figure 3. It clearly shows that the correlation between them is much stronger than the – correlation: the former has Spearman rank correlation coefficients of and 0.92 for the SMC and LMC, respectively, while the latter has much weaker values of 0.26 and 0.22.191919The Spearman rank correlation coefficient may have a value between and 1. A positive (negative) value indicates an (anti)correlation, and a value of 0 indicates no correlation. It is simply due to the fact that (as shown by the solid lines in Fig. 3), while the – correlation involves the dust column distribution. For example, there are some regions, such as the southern edge of the LMC bar, that have warm temperatures but not extremely high luminosities; by normalizing with , one effectively removes the dependence on dust column. Furthermore, note that the slope of the SMC’s correlation in the right panel is slightly shallower than the LMC’s, which implies a slightly lower emissivity index in the SMC.
Because of the expected spatial variation of dust column, one would not expect a one-to-one correspondence between and . This explains the tail towards bright in the distribution in the left panel of Figure 3. This can be understood such that bright regions () are mostly coincident with dusty star-forming regions, because is an indicator of obscured star formation (see Sec. 3.2.3), while the fainter regions generally probe the diffuse ISM.
5. Dust vs Stellar Distribution
In this section, we show and analyze the spatial distribution of the LMC and SMC’s dust/stellar luminosity and mass ratios, using the quantities defined in Section 3, inferred from the resolved SEDs. Galaxy SEDs, and dust/stellar ratios in particular, are related to other properties indicative of a galaxy’s evolution, such as metallicity, stellar mass, starlight intensity, and morphology (e.g., Fontanot et al. 2009; da Cunha et al. 2010). The dust/stellar luminosity ratio can be physically interpreted as the amount of emission being reprocessed by dust (both small and large grains) relative to the unobscured emission from (young and old) stars, while the dust/stellar mass ratio can be interpreted as the relative amounts of stellar mass growth and dust production. As shown by S11, dust/stellar luminosity and mass ratios are not equivalent, and have substantial scatter between them for dwarf and late-type galaxies.
5.1. Spatial Distribution of Dust/Stellar Luminosity
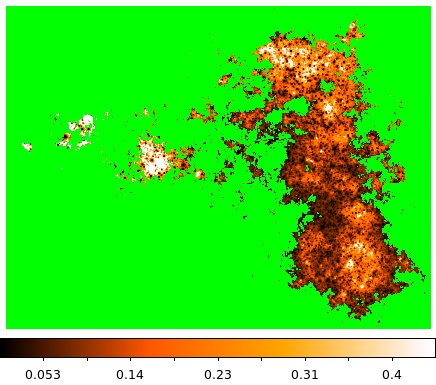
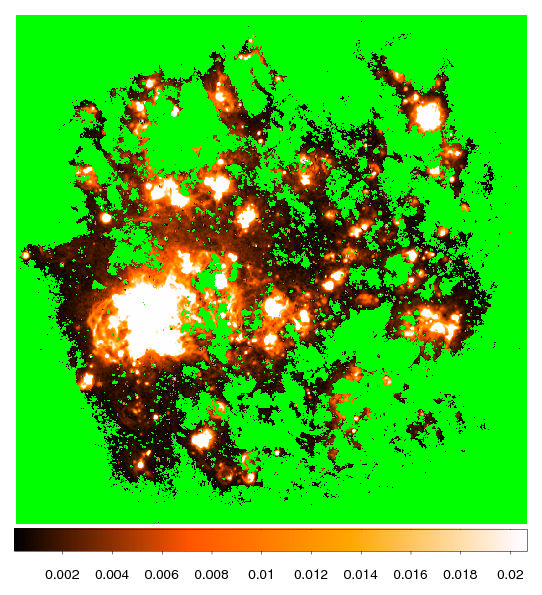
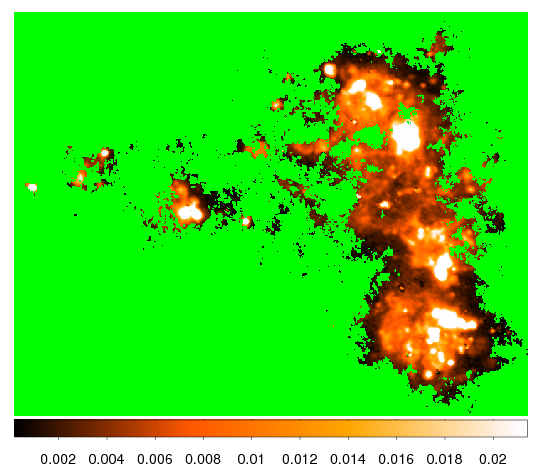
We present maps of the luminosity ratios of the LMC and SMC in Figure 4. The dust/stellar luminosity ratios exhibit substantial spatial variation within both galaxies.
The values of typically range from 0.01-0.2 and 0.01-0.6 throughout the SMC and LMC, respectively. These are comparable to the global values estimated by S11, who obtained for nearby metal-poor () dwarf galaxies.
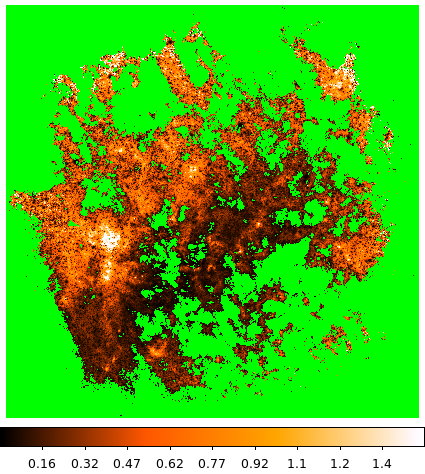
Many regions of the MCs that have bright dust luminosities or large dust mass, such as 30 Dor and the SMC “bar”, not surprisingly also have high ratios. In contrast, some regions have particularly low ratios, such as the LMC bar (see Figs. 1 and 4), which has a relatively large stellar flux density (Harris & Zaritsky 2009). Here, dark spots can be seen, and are attributed to regions with stars and star clusters (which are resolved in spite of the fact that the maps are degraded to SPIRE m resolution), lacking significant far-IR emission from dust.
It is important to keep in mind that stars are discrete objects, while dust grains have a more continuous spatial distribution. In addition, most dust is heated by starlight in the diffuse radiation field, while dust near compact star-forming regions are heated more intensely (e.g., Aniano et al. 2012; Foyle et al. 2012). It is beyond the scope of this paper to investigate emission from individual stars (see e.g. Harris & Zaritsky 2004, 2009), though such an approach is complementary to ours. In any case, our dust/stellar ratios are not very sensitive to the smoothing scale, and in Section 6 we examine star formation activity using smoother luminosity maps.
One might expect that the dust luminosity is roughly proportional to the total dust mass multiplied by the stellar luminosity (i.e., ), based on the energy balance of the dust between the absorption of starlight (which is proportional to ) and the emission of IR photons (which is essentially ). To first order, the spatial variation of roughly reflects the spatial variation of , as shown by the weak correlation in Figure 5 (cf. Fig. 4 of S11, for whole galaxies). However, this is complicated by the dependence on the radiative environment, due to the fact that the heating of the dust by starlight is determined by the intensity and spectral distribution of the starlight (e.g., depending on the dust’s proximity to star-forming regions or whether it is heated by old stars or the diffuse ISRF) and by the intrinsic absorption and emission properties of the dust (which is determined by its composition and size distribution). It is important to keep in mind that the stellar emission is due to a variety of stellar populations with different ages, and the dust emission is due to dust grains of different compositions and sizes.
In addition, as we have defined , it is more sensitive to light due to older rather than younger stellar populations. The highest ratios in Figure 4 often occur near major H ii region complexes, and may be caused by dust directly heated by OB stars and generally hotter than elsewhere, but may also reflect a poor recovery of the stellar luminosity of the luminous OB star clusters exciting these regions (i.e., underestimating ) by using only 3.6 and 4.5 m emission (see Sec. 3.2.1).
5.2. Spatial Distribution of Dust/Stellar Mass
We now show maps of the mass ratio in Figure 6. These are qualitatively similar to the maps of dust/stellar luminosity (Fig. 4), implying that the mass and luminosity distributions are similar. Note that 30 Dor has a that is larger than average, but its is particularly large.
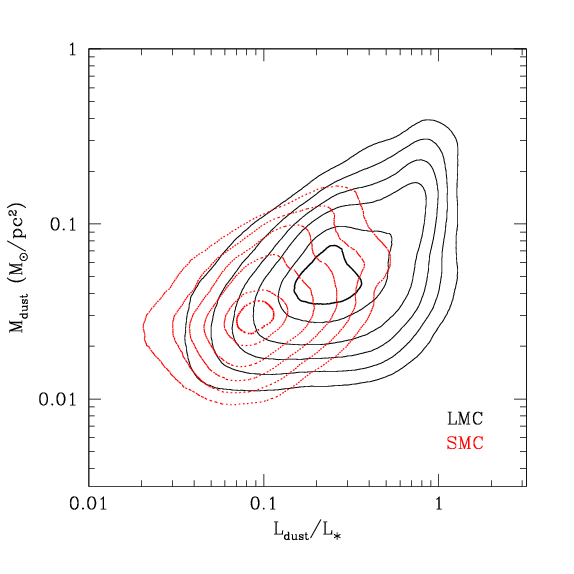
Most regions in the MCs have though some regions in the LMC and SMC have ratios up to approximately 0.004 and 0.002, respectively. (The gradient at the northern edge of the LMC is an artifact, due to the different background-subtraction performed by Gordon et al., in prep.) We find that the distribution peaks at medians of approximately and for the LMC and SMC, respectively, while peaks at values of 0.14 and 0.07. This is consistent with S11, who observed that is slightly more metallicity-dependent than in nearby late-type and dwarf galaxies.
The integrated dust/stellar mass ratio for the whole LMC and SMC are and , respectively202020To be clear, note that these are ratios of sums, , which are not equivalent to the average ratios, , of the pixels.. We will discuss these ratios in the context of star formation and gas in the next section.
We can compare the LMC and SMC’s to results for other galaxies (Dunne et al. 2011; S11; Cortese et al. 2012). Most galaxies have , though the precise values depend on the assumptions involved in both mass estimates. For example, Cortese et al. (2012) estimate their stellar masses from optical rather than near-IR luminosities and colors, and assume a Chabrier IMF, resulting in lower stellar masses and hence higher . Nonetheless, the LMC and especially the SMC are on the low end of the dust/stellar mass ratios in these studies: only three (th) of the dwarf/irregular galaxies in S11 (Holberg II, NGC 5408, and NGC 3077) have similarly low ratios, though like the MCs, NGC 3077 is tidally interacting with its neighbors, and a significant amount of dust has been stripped (Walter et al. 2011). On average, the SMC’s dust/stellar ratio is nearly a factor of ten lower than that of low-mass dwarfs, while the LMC (which is a one-armed spiral) has a lower ratio compared to similar late-type and Magellanic spirals. Dunne et al. (2011), S11, and Cortese et al. (2012) show that dwarf and late-type galaxies that are not gas-deficient tend to have higher ratios, as do galaxies with higher specific star formation rates; however, no strong dependence on metallicity is observed. The MCs are consistent with the dependence on gas content: they have slightly low (by a factor of two) dust/gas mass ratios compared to galaxies with similar metallicities (Draine et al. 2007; Herrera-Camus et al. 2012) consistent with their relatively low dust/stellar masses.
6. Star Formation and Dust Heating
We present SFR maps of the MCs in Figure 7. They provide an empirical description of the spatial distribution of star formation in the Magellanic Clouds, related to the recent work by Bolatto et al. (2011) and Jameson et al. (in prep.), and constraints on the galaxies’ star formation histories (Harris & Zaritsky 2004, 2009). These SFR maps are also in approximate agreement with the spatial distribution of young stellar objects (YSOs; Carlson et al. 2012). In Section 6.1, we will show how SFR is related to dust heating and emission.
By integrating over these SFR (surface density) maps, and by accounting for the different pixel sizes in order to conserve the total fluxes, we obtain total SFRs: for the LMC and for the SMC. The MCs’ very different SFRs are not surprising considering their stellar masses, which differ by a factor of five; moreover, the LMC appears to lie on the ‘star-forming sequence’ of disk-dominated galaxies (e.g., Brinchmann et al. 2004; Schiminovich et al. 2007). Note that, if one were to integrate and and then apply the SFR calibration, the upper expression of Eqn. 5 (calibrated to normal galaxies) yields SFRs approximately lower, while the lower expression (calibrated to star-forming regions) yields SFRs more similar to the above values.
These global SFRs are within a factor of two of other estimates in the literature, using different methods, such as YSO counts, stellar population modeling, and far-IR emission. Our LMC SFR is larger than that of other estimates (Whitney et al. 2008; Harris & Zaritsky 2009; Lawton et al. 2010; Sewiło et al., in prep.), who obtained -. On the other hand, our SMC SFR is lower than that of Bolatto et al. (2011) and Wilke et al. (2004), who obtained and , respectively.
Finally, note that SFR (Kennicutt 1998), yields much lower values: 0.006 and 0.08 , for the SMC and LMC, consistent with the metallicity dependence observed by Domínguez Sánchez et al. (2012). These low-metallicity galaxies are dominated by unobscured star formation: in ‘normal’ regions (upper expression in Eqn. 5), unobscured star formation accounts for all of the SFR in both galaxies, though in ‘H ii regions’ (lower expression, with higher ), obscured star formation accounts for 97% and 89% in the LMC and SMC, respectively. For a more detailed study of the SFR within the MCs, we refer the reader to Jameson et al. (in prep.).
The SFRs can be compared to the star formation history maps inferred from optical photometry by Harris & Zaritsky (2004, 2009) and atomic and molecular gas maps (e.g., Bernard et al. 2008; Bolatto et al. 2011). It is clear that the SFR is coincident with known H ii regions and regions with high gas column densities, and by comparing to previous results in this paper, we see that in some regions the SFR is coincident with dust emission (Fig. 1) and warm dust (Fig. 2) as well.
6.1. SFR Correlations
We now examine these correlations directly, by using the SFRs of individual () pixels. SFR versus the dust/stellar luminosity () and dust temperature is shown in Figure 8. Because the images have a large number of pixels, we indicate their distributions with contours.
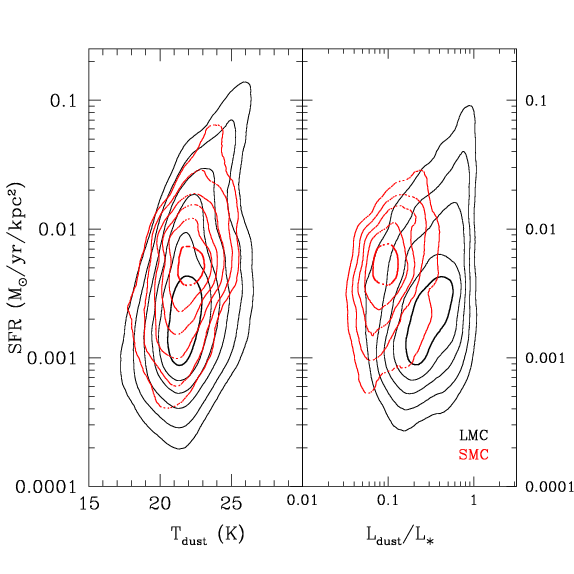
Firstly, it is clear that the SMC’s median SFR density is a factor of two larger than the LMC’s, despite the fact that its total SFR is considerably lower. This is partly due to a projection effect, because the SMC is more inclined (Groenewegen et al. 2000) than the LMC. It may also be due to the different properties of star clusters and H ii regions in the SMC and LMC (e.g., Lawton et al. 2010; Werchan & Zaritsky 2011), and to a selection effect, as low-SFR pixels are easier to detect in the LMC.
Secondly, a correlation between SFR and dust/stellar luminosity or mass has been seen for whole galaxies (da Cunha et al. 2010; S11), and we see a similar, though weaker, correlation within the Magellanic Clouds. A weak correlation with dust temperature is observed as well (consistent with Bernard et al. 2008; Planck Collaboration 2011). The correlation with has a Spearman rank of and 0.36 for the SMC and LMC, respectively, and the correlation with has 0.32 and 0.33. It is interesting that there is a pronounced ‘tail’ in these distributions, with stronger correlations at high SFR, , and in the LMC, but it has long been known that dust grains may be heated by stars, contributing to far-IR emission (e.g., Calzetti et al. 1995; Kennicutt 1998; Walter et al. 2007). The substantial scatter around these correlations demonstrates the complex relations between star formation and the wavelength dependence of dust heating and emission.
There are some regions with high that are not rapidly forming stars, especially in the LMC, but they generally appear to be in the outskirts of star-forming regions. The larger spatial extent of the dust emission may simply be due to the fact that the mean free path of photons that can heat dust is larger. In addition, the southern edge of the LMC’s bar, for example, has high but less star formation, which is likely an indication of a diffuse ‘IR cirrus’ component of dust emission.
6.2. Star Formation Efficiencies
We measured dust/stellar mass ratios in Section 5.2. By inverting the ratios, this implies stellar/dust mass ratios of approximately 1620 and 3350 for the LMC and SMC, respectively. These values can be compared to the galaxies’ gas/dust ratios, though these have large uncertainties as well, and there is not yet a consensus in the literature on their values. We will take the (atomic plus molecular) gas/dust ratios to be for the LMC (Bernard et al. 2008; Galliano et al. 2011; see also Meixner et al. 2010; Roman-Duval et al. 2010) and for the SMC (Bot et al. 2010b; see also Gordon et al. 2009; Leroy et al. 2011)212121Note that the gas masses used for these gas/dust ratios include a factor of 1.36 to account for the mass of helium (Leroy et al. 2011; Galliano et al. 2011)., with approximate uncertainties based on the range of the gas/dust estimates in these papers. These yield star/gas mass ratios of and for the LMC and SMC, respectively. (In contrast, the MW’s star/gas ratio is approximately 10.)
If we were to define a mass-based ‘star formation efficiency’, , as the mass ratio of stars/(stars+gas), which is a common definition on the scale of molecular clouds (Krumholz & Tan 2007), then we would have and .
Furthermore, the LMC has a lower gas mass fraction: , versus for the SMC (though not as low as in the MW). This is consistent with the fact that more massive galaxies tend to have lower gas fractions (Catinella et al. 2010; Masters et al. 2012). Another definition of star formation efficiency of galaxies is , whose inverse is the gas consumption time-scale; this SFE only weakly correlates with stellar mass (Bothwell et al. 2009; Huang et al. 2012; or with dark matter halo mass, in Davé et al. 2012). By this definition, we have and . can be interpreted as the rate at which available gas is converted into stars, while quantifies the relative amount of gas converted. Interestingly, the LMC again appears to have a relatively large for its mass, compared to other low-redshift late-type and dwarf galaxies (Huang et al. 2012), while the SMC’s is more typical (see also Bolatto et al. 2011). In addition, from its star formation history, the LMC’s SFR has been increasing more rapidly with time than the SMC’s, on average (Harris & Zaritsky 2009).
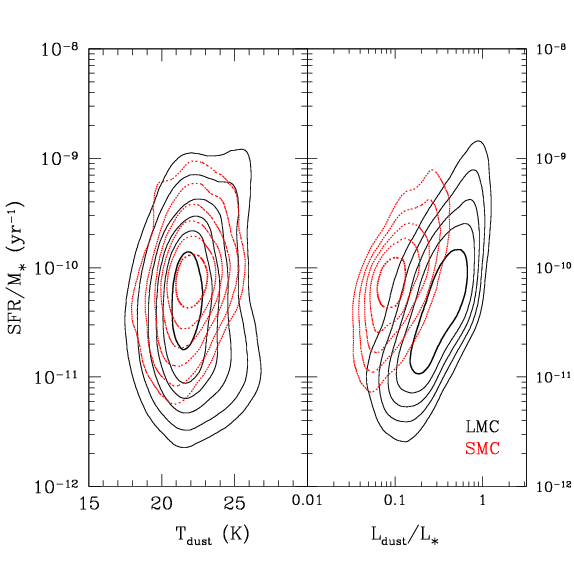
We end by discussing the specific SFR, defined as . The sSFR is a useful physical quantity, because by normalizing by the stellar mass, relations with star formation activity can appear clearer. In Figure 9, we show the distribution of sSFR versus dust temperature and the dust/stellar luminosity ratio for pixels in the LMC and SMC, analogous to Figure 8 (and to Fig. 7 in S11, for whole galaxies). We see that the LMC has a wider range of sSFRs than the SMC, and that the weak correlation between SFR and disappears when accounting for . However, the correlation between sSFR and is strong for both galaxies, consistent with S11: regions with larger dust/stellar ratios tend to have higher sSFRs. In addition, the sSFR defines a characteristic time-scale for star formation: (Brinchmann et al. 2004). This implies that dusty star-forming regions, such as 30 Dor and the SMC wing (see Fig. 4), have short star formation time-scales, on the order of a Gyr.
7. Summary and Discussion
We now summarize our main conclusions:
-
•
Utilizing the entire dust SED, including Spitzer (SAGE) and Herschel (HERITAGE) observations, we have spatially resolved dust luminosities throughout the LMC and SMC. Some regions with bright coincide with known star-forming regions.
-
•
Dust temperature is more strongly correlated with than alone. In addition, we detect a significant 70 m excess (with respect to modified-blackbody fits at longer wavelengths) in both galaxies, especially the SMC, indicating the presence of stochastically heated dust and/or that the dust is heated to a range of temperatures because of a range of starlight intensities.
-
•
Dust/stellar luminosity and mass ratios exhibit substantial variation throughout both the LMC and SMC. Bright star-forming regions (with concomitant dust emission) have bright , while regions with many stars, especially the LMC bar, have low dust/stellar ratios.
-
•
We probe the spatial distribution of star formation in the LMC and SMC, using emission, and find that regions with high SFR correlate with those with warm dust temperature and bright .
-
•
We compare ‘global’ properties of the LMC and SMC to other galaxies (e.g., Skibba et al. 2011). The dust/stellar mass ratios, especially of the SMC, are lower than that of similar metal-poor dwarf and late-type galaxies. The LMC approximately lies on the stellar mass-SFR relation of disk galaxies, but it has a particularly large star formation efficiency (quantified by or ) compared to other galaxies.
The LMC and SMC appear to be a pair of interacting and infalling satellite galaxies (perhaps on their first passage through the MW halo), which is a relatively rare phenomenon (Liu et al. 2011; Besla et al. 2012). It is an interesting question to ask, to what extent these environmental processes (interaction and infall) are connected with the galaxies’ evolution, especially their dust production/destruction and star formation histories. It is well known that tidal encounters or ‘harassment’ between close pairs of galaxies can modify their morphologies and induce bursts of star formation (Moore et al. 1996; Barton et al. 2000), but the LMC and SMC allow a close examination of the effects of these processes, including the indirect effects on dust heating and emission (both in star-forming regions and the diffuse ISM). For example, the LMC has essentially become a one-armed spiral galaxy, in which the arm has ongoing star formation and substantial dust emission; its off-center bar has limited star formation with a relatively warm dust temperature.
Finally, our results for the global, and especially resolved, galaxy properties of the Magellanic Clouds can potentially be used to constrain models, simulations, and SED templates. Semi-analytic models of galaxy formation make assumptions about the energy balance and spatial distribution of stars and dust (e.g., Lacey et al. 2008; Somerville et al. 2012), while our results constrain the strength and scatter in the correlations between dust luminosity (or ) and dust temperature and SFR (Sections 5 and 6). Furthermore, radiative transfer models have already been compared to the SEDs of nearby galaxies (e.g., Misselt et al. 2001; Jonsson et al. 2010; Silva et al. 2011) and could benefit from the additional constraints on dust properties provided by Herschel (see Section 4), such as the distributions of dust luminosity, temperature, and mass.
7.1. Differences between the Magellanic Clouds
Though the Magellanic Clouds are often studied together, they have many differences. The SMC is more dwarf-like than the LMC, which is classified as a barred one-armed spiral galaxy (de Vaucouleurs & Freeman 1972), and has a much lower metallicity than the LMC (Russel & Dopita 1992). The MCs also have different gas/dust ratios (Gordon et al. 2003; Leroy et al. 2011), submillimeter excesses (Bot et al. 2010; Israel et al. 2010), 70 m excesses (Appendix B), dust production from evolved stars (Srinivasan et al. 2009; Boyer et al. 2012; Riebel et al. 2012), star formation histories (Harris & Zaritsky 2004, 2009), and proper motions (Kallivayalil et al. 2006).
In Section 5, we found that the SMC has a slightly lower dust/stellar luminosity and mass ratio than the LMC, on average. The SMC’s stellar and dust masses are five and ten times lower than the LMC’s, respectively. The SMC also has a much lower SFR and a lower star formation efficiency (SFE) than the LMC.
Many of these different properties of the galaxies could be simply explained by the fact that the SMC is considerably less massive and more metal-poor than the LMC. For example, less massive galaxies are expected to have lower SFRs than more massive ones, and metal-poor galaxies are expected to have higher gas/dust mass ratios. Nonetheless, the SMC’s higher SFR density (Fig. 8) and the LMC’s relatively high SFE, may be the result of these galaxies’ unique formation histories, including tidal stripping and triggered star formation.
7.2. Selected Regions in the MCs
We now discuss a few selected regions: the bar and two well-known star-forming regions, 30 Dor and N11, in the LMC, and the SMC wing. (These regions are labeled in Fig. 2.)
The LMC’s bar has a large stellar luminosity and mass, indicated by bright near-IR luminosities. It has a large fraction of old stars, with ages (Harris & Zaritsky 2009). In addition, its dust mass/luminosity ratio is relatively low (Fig. 2) and dust temperature is relatively high; considering its limited recent star formation, this suggests that the dust is heated by the ISRF. Interestingly, the LMC’s photometric center, which is centered on the bar, is offset by from the stellar and H i kinematic center (Cole et al. 2005). Unlike some barred spiral galaxies (see the evolving bar fraction in Sheth et al. 2008), the LMC’s bar has been an integral part of the galaxy for most of its history (Harris & Zaritsky 2009), and this asymmetry in the bar appears to have been the result of a recent collision with the SMC (Bekki & Chiba 2007).
There are large H ii region complexes near the LMC’s bar, such as 30 Dor and N44 as well as others further away, such as N11 in the northwest. These regions have substantial stellar emission as well as dust emission, though this is not accompanied by a particularly large dust mass (i.e., they have low ; see Fig. 2). This suggests that these regions have a relative underabundance of dust grains, possibly due to dust destruction by stellar winds or shocks (Jones et al. 1994; Paradis et al. 2009); however, these star-forming regions, especially 30 Dor, have enhanced dust/gas ratios (Paradis et al. 2011), indicating that most of their gas has been consumed.
As discussed above, the SMC wing and bridge appear to be tidally stripped and their star formation tidally triggered (Harris 2007; Gordon et al. 2009, 2011). In addition, the wing has a high gas/dust mass ratio, possibly due to dust destruction by a harder radiation field and shocks during the tidal interaction (Gordon et al. 2009). We find that the wing also has high dust/stellar ratios (Figs. 4 and 6), but these are likely due to star formation, not to a significant dust abundance, making the wing somewhat similar to H ii regions within the MCs.
Acknowledgments
RAS acknowledges financial support from the NASA Herschel Science Center, JPL contract #1350371. We also acknowledge support from the NASA Herschel Science Center, JPL contracts #1381522 and #1381650. AL is supported in part by NSF AST-1109039. MR acknowledges support from CONICYT through FONDECT grant No. 1080335. We thank the anonymous referee for insightful comments that helped to improve the quality of the paper. We thank the contributions and support from the European Space Agency (ESA), the PACS and SPIRE teams, the Herschel Science Center, and the NASA Herschel Science Center (esp. A. Barbar and K. Xu) and the PACS and SPIRE instrument control centers, without which none of this work would be possible.
References
- Aniano et al. (2011) Aniano G., Draine B. T., Gordon K. D., Sandstrom K., 2011, PASP, 123, 1218
- Aniano et al. (2012) Aniano G., Draine B. T., et al., 2012, ApJ, 756, 138
- Barton et al. (2000) Barton E. J., Geller M. J., Kenyon S. J., 2000, ApJ, 530, 660
- Bekki & Chiba (2007) Bekki K., Chiba M., 2007, PASA, 24, 21
- Bekki (2011) Bekki K., 2011, MNRAS, 416, 2359
- Bell et al. (2002) Bell E. F., Gordon K. D., Kennicutt R. C., Zaritsky D., 2002, ApJ, 565, 994
- Bendo et al. (2003) Bendo G. J., et al., 2003, AJ, 125, 2361
- Bernard et al. (2008) Bernard J.-P., et al., 2008, AJ, 136, 919
- Bernard et al. (2011) Planck Collaboration, et al., 2011, A&A, 536, A17
- Besla et al. (2012) Besla G., Kallivayalil N., Hernquist L., van der Marel R. P., Cox T.J., Kereš D., 2012, MNRAS, 421, 2109
- Blair et al. (2009) Blair W. P., Oliveira C., LaMassa S., Gutman S., Danforth C. W., Fullerton A. W., Sankrit R., Gruendl R., 2009, PASP, 121, 634
- Bolatto et al. (2011) Bolatto A. D., et al., 2011, ApJ, 741, 12
- Bonatto & Bica (2010) Bonatto C., Bica E., 2010, MNRAS, 403, 996
- Boquien et al. (2011) Boquien M., et al., 2011, AJ, 142, 111
- Bot et al. (2004) Bot C., Boulanger F., Lagache G., Cambrésy L., Egret D., 2004, A&A, 423, 567
- Bot et al. (2010) Bot C., Ysard N., Paradis D., Bernard J.-P., Lagache G., Israel F. P., Wall W. F., 2010a, A&A, 523, A20
- Bot et al. (2010b) Bot C., et al., 2010b, A&A, 524, A52
- Bothwell et al. (2009) Bothwell M. S., Kennicutt R. C., Lee J. C., 2009, MNRAS, 400, 154
- Boyer et al. (2012) Boyer M. L., et al., 2012, ApJ, 748, 40
- Brinchmann et al. (2004) Brinchmann J., Charlot S., White S. D. M., Tremonti C., Kauffmann G., Heckman T., Brinkmann J., 2004, MNRAS, 351, 1151
- Busha et al. (2011b) Busha M. T., Wechsler R. H., Behroozi P. S., Gerke B. F., Klypin A. A., Primack J. R., 2011, ApJ, 743, 117
- Calzetti et al. (1995) Calzetti D., Bohlin R. C., Kinney A. L., Storchi-Bergmann T., Heckman T. M., 1995, ApJ, 443, 136
- Calzetti et al. (2007) Calzetti D., et al., 2007, ApJ, 666, 870
- Calzetti et al. (2010) Calzetti D., et al., 2010, ApJ, 714, 1256
- Carlson et al. (2012) Carlson L. R., Sewiło M., Meixner M., Romita K. A., Lawton B., 2012, A&A, 542, A66
- Catinella et al. (2010) Catinella B., et al., 2010, MNRAS, 403, 683
- Cignoni et al. (2012) Cignoni M., Cole A. A., Tosi M., Gallagher J. S., Sabbi E., Anderson J., Grebel E. K., Nota A., 2012, ApJ, 754, 130
- Cole et al. (2005) Cole A. A., Tolstoy E., Gallagher J. S. III, Smecker-Hane T. A., 2005, AJ, 129, 1465
- Cortese et al. (2012) Cortese L., et al., 2012, A&A, 540, A52
- da Cunha et al. (2010) da Cunha E., Eminian C., Charlot S., Blaizot J., 2010, MNRAS, 403, 1894
- Dale & Helou (2002) Dale D. A., Helou G., 2002, ApJ, 576, 159
- Dale et al. (2007) Dale D. A., et al., 2007, ApJ, 655, 863
- Davé et al. (2012) Davé R., Finlator K., Oppenheimer B. D., 2012, MNRAS, 421, 98
- De Looze et al. (2012) De Looze I., et al., 2012, MNRAS, 423, 2359
- de Vaucouleurs & Freeman (1972) de Vaucouleurs G., Freeman K. C., 1972, VA, 14, 163
- Domínguez et al. (2012) Domínguez Sánchez H., et al., 2012, MNRAS, 426, 330
- D’Onghia & Lake (2008) D’Onghia E., Lake G., 2008, ApJ, 686, L61
- Draine & Li (2007) Draine B. T., Li A., 2007, ApJ, 657, 810
- Draine et al. (2007) Draine B. T., et al., 2007, ApJ, 663, 866
- Dufour et al. (1982) Dufour R. J., Shields G. A., Talbot R. J. Jr., 1982, ApJ, 252, 461
- Dunne et al. (2011) Dunne L., et al., 2011, MNRAS, 417, 1510
- Dupac et al. (2003) Dupac X., et al., 2003, A&A, 404, L11
- Engelbracht et al. (2008) Engelbracht C. W., Rieke G. H., Gordon K. D., Smith J.-D. T., Werner M. W., Moustakas J., Willmer C. N. A., Vanzi L., 2008, ApJ, 678, 804
- Engelbracht et al. (2010) Engelbracht C. W., et al. 2010, A&A, 518, L56
- Eskew et al. (2012) Eskew M., Zaritsky D., Meidt S., 2012, AJ, 143, 139
- Fazio et al. (2004) Fazio G. G., et al., 2004, ApJS, 154, 10
- Fontanot et al. (2009) Fontanot F., Somerville R. S., Silva L., Monaco P., Skibba R., 2009, MNRAS, 392, 553
- Foyle et al. (2012) Foyle K., et al., 2012, MNRAS, 421, 2917
- Galametz et al. (2009) Galametz M., et al., 2009, A&A, 508, 645
- Galametz et al. (2011) Galametz M., Madden S. C., Galliano F., Hony S., Bendo G. J., Sauvage M., 2011, A&A, 532, A56
- Galametz et al. (2012) Galametz M., et al., 2012, MNRAS, 425, 763
- Galliano et al. (2011) Galliano F., et al., 2011, A&A, 536, A88
- Gaustad et al. (2001) Gaustad J. E., et al., 2001, PASP, 113, 1326
- Gordon et al. (2003) Gordon K. D., Clayton G. C., Misselt K. A., Landolt A. U., Wolff M. J., 2003, ApJ, 594, 279
- Gordon et al. (2008) Gordon K. D., Engelbracht C. W., Rieke G. H., Misselt K. A., Smith J., Kennicutt R. C., 2008, ApJ, 682, 336
- Gordon et al. (2009) Gordon K. D., et al., 2009, ApJ, 690, L76
- Gordon et al. (2010) Gordon K. D., et al., 2010, A&A, 518, L89
- Gordon et al. (2011) Gordon K. D., et al., 2011, AJ, 142, 102
- Griffin et al. (2010) Griffin M. J., et al., 2010, A&A, 518, L3
- Groenewegen (2000) Groenewegen M. A. T., 2000, A&A, 363, 901
- Harris (2007) Harris J., 2007, ApJ, 658, 345
- Harris & Zaritsky (2004) Harris J., Zaritsky D., 2004, AJ, 127, 1531
- Harris & Zaritsky (2009) Harris J., Zaritsky D., 2009, AJ, 138, 1243
- Herrera-Camus et al. (2012) Herrera-Camus R., et al., 2012, ApJ, 752, 112
- Huang et al. (2012) Huang S., Haynes M. P., Giovanelli R., Brinchmann J., Stierwalt S., Neff S. G., 2012, AJ, 143, 133
- Israel et al. (2010) Israel F. P., Wall W. F., Raban D., Reach W. T., Bot C., Oonk J. B. R., Ysard N., Bernard J. P., 2010, A&A, 519, A67
- Jones et al. (1994) Jones A.P., Tielens A.G.G.M., Hollenbach D.J., McKee C.F., 1994, ApJ, 433, 797
- Jonsson et al. (2010) Jonsson P., Groves B. A., Cox T. J., 2010, MNRAS, 403, 17
- Juvela & Ysard (2012) Juvela M., Ysard N., 2012, A&A, 539, A71
- Kallivayalil et al. (2006) Kallivayalil N., van der Marel R. P., Alcock C., Axelrod T., Cook K. H., Drake A. J., Geha M., 2006, ApJ, 638, 772
- Kelly et al. (2012) Kelly B. C., Shetty R., Stutz A. M., Kauffmann J., Goodman A. A., Launhardt R., 2012, ApJ, 752, 55
- Kennicutt (1998) Kennicutt R. C., 1998, ARA&A, 36, 189
- Kennicutt et al. (2008) Kennicutt R. C., Lee J. C., Funes J. G., Sakai S., Akiyama S., 2008, ApJS, 178, 247
- Kennicutt et al. (2009) Kennicutt R. C., et al., 2009, ApJ, 703, 1672
- Kim et al. (2010) Kim S., et al., 2010, A&A, 518, L75
- Kroupa (2001) Kroupa P., 2001, MNRAS, 322, 231
- Krumholz & Tan (2007) Krumholz M. R., Tan J. C., 2007, ApJ, 654, 304
- Lacey et al. (2008) Lacey C. G., Baugh C. M., Frenk C. S., Silva L., Granato G. L., Bressan A., 2008, MNRAS, 385, 1155
- Laor & Draine (1993) Laor A., Draine B. T., 1993, ApJ, 402, 441
- Lawton et al. (2010) Lawton B., et al., 2010, ApJ, 716, 453
- Leroy et al. (2007) Leroy A., Bolatto A., Stanimirović S., Mizuno N., Israel F., Bot C., 2007, ApJ, 658, 1027
- Leroy et al. (2011) Leroy A., et al., 2011, ApJ, 737, 12
- Leroy et al. (2012) Leroy A. K., et al., 2012, AJ, 144, 3
- Li & Draine (2001) Li A., Draine B. T., 2001, ApJ, 554, 778
- Liu et al. (2011) Liu L., Gerke B. F., Wechsler R. H., Behroozi P. S., Busha M. T., 2011, ApJ, 733, 62
- Masters et al. (2012) Masters K. L., et al., 2012, MNRAS, 424, 2180
- Mastropietro et al. (2005) Mastropietro C., Moore B., Mayer L., Wadsley J., Stadel J., 2005, MNRAS, 363, 509
- Mattsson & Andersen (2012) Mattsson L., Andersen A. C., 2012, MNRAS, 423, 38
- Meidt et al. (2011) Meidt S. E., et al., 2012, ApJ, 744, 17
- Meixner et al. (2006) Meixner M., et al., 2006, AJ, 132, 2268
- Meixner et al. (2010) Meixner M., et al., 2010, A&A, 518, L71
- Mentuch et al. (2010) Mentuch E., Abraham R. G., Zibetti S., 2010, ApJ, 725, 1971
- Misselt et al. (2001) Misselt K. A., Gordon K. D., Clayton G. C., Wolff M. J., 2001, ApJ, 551, 277
- Moore et al. (1996) Moore B., Katz N., Lake G., Dressler A., Oemler A., 1996, Nat, 379, 613
- Muñoz-Mateos et al. (2009) Muñoz-Mateos J. C., et al., 2009, ApJ, 701, 1965
- Ngeow & Kanbur (2008) Ngeow C., Kanbur S. M., 2008, ApJ, 679, 76
- Nikolaev et al. (2008) Nikolaev S., et al., 2004, ApJ, 601, 260
- Pagel et al. (1978) Pagel B. E. J., Edmunds M. G., Fosbury R. A. E., Webster B. L., 1978, MNRAS, 184, 569
- Paradis et al. (2009) Paradis D., et al., 2009, AJ, 138 196
- Paradis et al. (2011a) Paradis D., et al., 2011, AJ, 141, 43
- Paradis et al. (2011b) Paradis D., et al., 2012, A&A, 537, 113
- Pilbratt et al. (2010) Pilbratt G. L., et al., 2010, A&A, 518, L1
- Poglitsch et al. (2010) Poglitsch A., et al., 2010, A&A, 518, L2
- Rieke et al. (2004) Rieke G. H., et al., 2004, ApJS, 154, 25
- Robotham et al. (2012) Robotham A. S. G., et al., 2012, MNRAS, 424, 1448
- Roman-Duval et al. (2010) Roman-Duval J., et al., 2010, A&A, 518, L74
- Russell & Dopita (1992) Russel S. C., Dopita M. A., 1992, ApJ, 384, 508
- Sakon et al. (2006) Sakon I., et al., 2006, ApJ, 651, 174
- Sales et al. (2011) Sales L. V., Navarro J. F., Cooper A. P., White S. D. M., Frenk C. S., Helmi A., 2011, MNRAS, 418, 648
- Sandstrom et al. (2010) Sandstrom K. M., Bolatto A. D., Draine B. T., Bot C., Stanimirović S., 2010, ApJ, 715, 701
- Sauvage et al. (1990) Sauvage M., Vigroux L., Thuan T. X., 1990, A&A, 237, 296
- Schiminovich et al. (2007) Schiminovich D., et al., 2007, ApJS, 173, 315
- Sheth et al. (2008) Sheth K., et al., 2008, ApJ, 675, 1141
- Shetty et al. (2009a) Shetty R., Kauffmann J., Schnee S., Goodman A. A., 2009, ApJ, 696, 676
- Silva et al. (2011) Silva L., et al., 2011, MNRAS, 410, 2043
- Simon et al. (2007) Simon J. D., et al., 2007, ApJ, 669, 327
- Skibba et al. (2007) Skibba R. A., Sheth R. K., Martino M. C., 2007, MNRAS, 382, 1940
- Skibba et al. (2011) Skibba R. A., Engelbracht C. W., et al., 2011, ApJ, 738, 89
- Smith et al. (2012) Smith M. W. L, et al., 2012, ApJ, 756, 40
- Somerville et al. (2012) Somerville R. S., Gilmore R. C., Primack J. R., Domínguez A., 2012, MNRAS, 423, 1992
- Srinivasan et al. (2009) Srinivasan S., et al., 2009, AJ, 137, 4810
- Stanimirovic et al. (2000) Stanimirović S., Staveley-Smith L., van der Hulst J. M., Bontekoe Tj. R., Kester D. J. M., Jones P. A., 2000, MNRAS, 315, 791
- Szewczyk et al. (2009) Szewczyk O., et al., 2009, AJ, 138, 1661
- Tollerud et al. (2011) Tollerud E. J., Boylan-Kolchin M., Barton E. J., Bullock J. S., Trinh C. Q., 2011, ApJ, 738, 102
- van den Bergh (1999) van den Bergh S., 1999, A&AR, 9, 273
- van den Bosch et al. (2007) van den Bosch F. C., et al., 2007, MNRAS, 376, 841
- van Loon et al. (2010) van Loon J. Th., Oliveira J. M., Gordon K. D., Sloan G. C., Engelbracht C. W., 2010, AJ, 139, 1553
- Walborn & Parker (1992) Walborn N. R., Parker J. W., 1992, ApJ, 399, L87
- Walter et al. (2007) Walter F., et al., 2007, ApJ, 661, 102
- Walter et al. (2011) Walter F., et al., 2011, ApJ, 726, L11
- Weingartner & Draine (2001) Weingartner J. C., Draine B. T., 2001, ApJ, 548, 296
- Werchan & Zaritsky (2011) Werchan F., Zaritsky D., 2011, AJ, 142, 48
- Whitney et al. (2008) Whitney B. A., et al., 2008, AJ, 136, 18
- Wilke et al. (2004) Wilke K., Klaas U., Lemke D., et al., 2004, A&A, 414, 69
- Yoshizawa & Noguchi (2003) Yoshizawa A. M., Noguchi M., 2003, MNRAS, 339, 1135
- Zaritsky (1999) Zaritsky D, 1999, AJ, 118, 2824
- Zibetti et al. (2009) Zibetti S., Charlot S., Rix H.-W., 2009, MNRAS, 400, 1181
- Zibetti & Groves (2011) Zibetti S., Groves B., 2011, MNRAS, 417, 812
Appendix A Total Infrared Luminosity
We follow Draine & Li (2007), and use a common calibration of the total IR luminosity of dust, inferred from 8, 24, 70, and 160 m photometry:
| (A1) |
where . We have also tested the Dale & Helou (2002) formula, which uses only the MIPS bands, and have obtained very similar results. Note that with this definition, is inferred from wavelengths of m, in contrast with (Eqn. 1), which is summed over the entire dust SED.
We show the ratio of the dust luminosity , which includes longer wavelength data, to this in Figure A1.
It is interesting that the and maps are similar, but not identical. Their ratio is not uniformly unity; for example, it varies in the SE region of the LMC, and is relatively large in the bright star-forming region 30 Dor. This is consistent with ongoing work (Galametz et al., in prep.), showing some differences between IR luminosities inferred from Spitzer bands (m) and Herschel bands in regions with very high or low surface brightnesses, though in general the submm contribution is relatively small in low-metallicity galaxies. The ratio of the pixels in the maps has a mean of (with standard deviation ) in the LMC and (with ) in the SMC. The luminosity inferred from shorter wavelengths is approximately accurate, but estimates based on these wavelengths alone could be slightly biased by different grain size distributions or emissivities. By utilizing the entire dust SED, more accurately accounts for the spatial variations of emission from small and large dust grains.
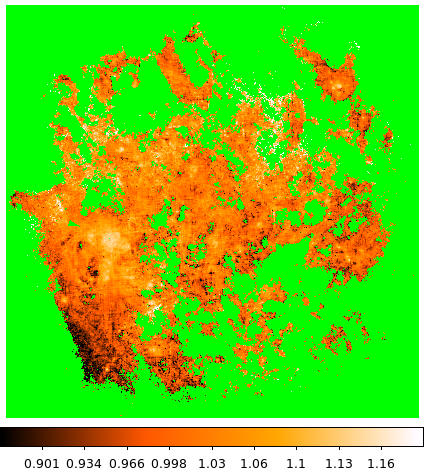
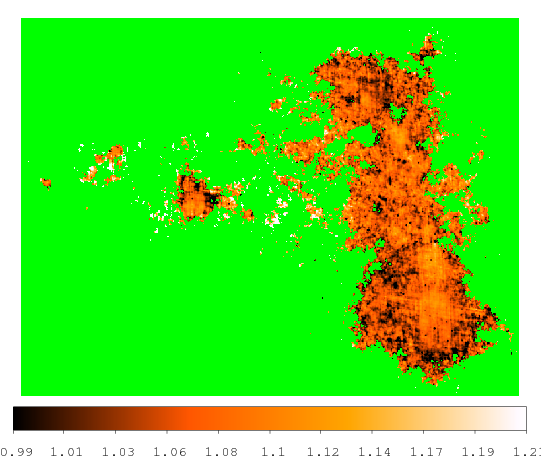
Appendix B 70 micron Excess
Using the single-temperature modified blackbody fits to the 100-500 m dust SEDs, we can compare the 70 m flux predicted from this to the observed MIPS 70 m flux. This ratio is an indicator of the spatial distribution of stochastically heated small dust grains (Draine & Li 2001; Galliano et al. 2003), and/or the fact that the dust grains of different sizes are heated to a range of temperatures (rather than a single ) by a range of starlight intensities. We show maps of it for the LMC and SMC in Figure B1. A ratio (observed/predicted) of greater than unity is evidence for a 70 m ‘excess’ (Bot et al. 2004; Bernard et al. 2008). We find that most of both MCs have a significant excess, with the LMC and SMC having mean excesses of approximately 1.4 (rms 0.6) and 2.8 (rms 1.0), respectively. The result in the left panel of Figure B1 is not in disagreement with Bernard et al. (2008), who employed a different definition of the 70 m excess, with respect to a model that includes very small grain emission, and found a strong excess in the LMC in regions to the east and south of 30 Doradus.
Since we observe ratios with a significant excess of unity, this implies that a significant fraction of small dust grains are stochastically heated by photon absorption. The larger ratios within the SMC is expected because the SMC has a steeper UV extinction law, which likely means that the grains in the SMC are generally smaller than those in the LMC.