Thermal conductivity of MgO, MgSiO3 perovskite and post-perovskite in the Earth’s deep mantle
Abstract
We report lattice thermal conductivities of MgO and MgSiO3 in the perovskite and post-perovskite structures at conditions of the Earth’s lower mantle, obtained from equilibrium molecular dynamics simulations. Using an advanced ionic interaction potential, the full conductivity tensor was calculated by means of the Green-Kubo method, and the conductivity of MgSiO3 post-perovskite was found to be significantly anisotropic. The thermal conductivities of all three phases were parameterized as a function of density and temperature. Assuming a Fe-free lower-mantle composition with mole fractions and , the conductivity of the two-phase aggregate was calculated along a model geotherm. It was found to vary considerably with depth, rising from 9.5 W/(mK) at the top of the lower mantle to 20.5 W/(mK) at the top of the thermal boundary layer above the core-mantle boundary. Extrapolation of experimental data suggests that at deep-mantle conditions, the presence of a realistic amount of iron impurities lowers the thermal conductivity of the aggregate by about 50% (Manthilake et al., 2011a). From this result and our thermal conductivity model, we estimate the heat flux across the core-mantle boundary to be 10.8 TW for a Fe-bearing MgO/MgSiO3 perovskite aggregate and 10.6 TW for a Fe-bearing MgO/MgSiO3 post-perovskite aggregate.
I Introduction
The thermal conductivity of minerals in the Earth’s mantle is an important geophysical parameter which governs the heat flux from the core up to the surface and hence strongly influences mantle dynamics (Naliboff and Kellogg, 2007). Moreover, the thermal conductivity of minerals at the core-mantle boundary (CMB) determines the amount of heat extracted from the core, driving the convection of the liquid outer core and thus controlling the power available to the generation of the Earth’s magnetic field (Davies, 2007; Aubert et al., 2009). Yet, measuring thermal conductivities at mantle pressures and temperatures is extremely challenging, and experimental data are scarce. Several schemes exist to extrapolate thermal conductivities measured at lower pressures and temperatures to deep-mantle conditions (Ross et al., 1984; Hofmeister, 1999), but they are plagued with large uncertainties. Hence a computational approach is desirable to evaluate thermal conductivities directly at the relevant conditions. The aim of this study is to provide reliable values for the lattice thermal conductivities of MgO, MgSiO3 perovskite (Pv) and post-perovskite (PPv) at lower-mantle conditions and their variation with temperature and density (or pressure). These results can be directly applied to thermal transport in the lower mantle.
In deep-mantle minerals, heat is conducted by phonons and electromagnetic radiation. The importance of the radiative contribution to thermal transport in the Earth is under debate, and current estimates span a considerable range: while Goncharov et al. (2009) report a radiative thermal conductivity below W/(mK) across the lower mantle, Stamenković et al. (2011) predict W/(mK) at the CMB, and Keppler et al. (2008) even values of up to W/(mK), which is of the same order of magnitude as the lattice contribution. Moreover, the radiative conductivity seems to depend strongly on crystal grain size and on the iron content (Hofmeister and Yuen, 2007). In view of these difficulties, we focus on the lattice contribution in this study. If the radiative conductivity turns out to be significant it can simply be added to the lattice part presented here.
Over the past years, different atomic-scale methods were developed to calculate lattice thermal conductivities. Stackhouse et al. (2010) applied the non-equilibrium or “direct” method (Müller-Plathe, 1997; Nieto-Draghi and Avalos, 2003) to derive the thermal conductivity of MgO, using molecular dynamics (MD) simulations based on density functional theory (DFT). In this approach, an energy current from the cold to the hot side of the simulation cell is imposed. From this current and the steady-state temperature gradient which builds up, the thermal conductivity is obtained via Fourier’s law. While computationally rather efficient, the method suffers from strong finite-size effects, thus requiring extrapolation to infinite system size and introducing considerable uncertainties (Sellan et al., 2010). An approach based on phonon lifetimes, obtained from DFT, was used by de Koker (2009, 2010) and by Tang and Dong (2010) to calculate the thermal conductivity of MgO. Phonon lifetimes were either calculated from line widths in the Fourier transform of the velocity autocorrelation function (de Koker, 2009) or from anharmonic lattice dynamics (Tang and Dong, 2010). Combined with the Boltzmann transport equation for the phonon gas, they yield the thermal conductivity in the relaxation time approximation. This approach treats the anharmonicity of lattice vibrations perturbatively and is thus limited to temperatures where atomic displacements from the equilibrium positions are small enough for higher-order anharmonicity to be neglected.
A third approach, the Green-Kubo method, uses the Green-Kubo relations (Kubo, 1957) to obtain thermal conductivities from appropriate current correlation functions, which, in turn, are readily extracted from equilibrium MD trajectories. This method has been successfully applied to solids (e.g. Volz and Chen (2000); Sellan et al. (2010); Esfarjani and Chen (2011)) and liquids (e.g. Galamba et al. (2007); Ohtori et al. (2009b); Salanne et al. (2011)). In contrast to the non-equilibrium method, no concerns about leaving the linear-response regime arise for equilibrium MD. Moreover, the Green-Kubo method exhibits a weaker finite-size effect (Sellan et al., 2010), provides the full thermal conductivity tensor in one simulation and takes into account thermoelectric effects which can contaminate results of the non-equilibrium method for ionic conductors (Salanne et al., 2011). Unlike the lattice dynamics approach, the Green-Kubo method takes into account anharmonicity to all orders. Thus its validity is not restricted to low temperatures. In the light of these advantages, we decided to use the Green-Kubo approach to calculate thermal conductivities of MgO, MgSiO3 Pv and MgSiO3 PPv at conditions spanning a wide pressure and temperature range. We also determined conductivities at conditions where experimental data are available, and satisfactory agreement with these experiments makes us confident that our results are equally reliable at CMB conditions. A drawback of the method is that it requires long run durations (in the nanosecond range) to obtain reasonable statistical accuracy. Our calculations are based on classical MD simulations involving an interaction potential of first-principles accuracy (Jahn and Madden, 2007).
II Theory
The thermal conductivity tensor is defined by Fourier’s law, , under the constraint that no mass or electric currents are present. This constraint is relevant to electronic or ionic conductors, where thermoelectric effects occur (Callen, 1985). Fourier’s law is of linear-response type and relates the heat current density to the temperature gradient . For cubic and orthorhombic crystals, is diagonal if the coordinate axes are along the crystal axes, and direction-dependent conductivities can be defined by
| (1) |
In the framework of non-equilibrium thermodynamics (Callen, 1985; de Groot and Mazur, 1984), the thermal conductivity can be expressed in terms of kinetic coefficients , as is done in equations 3 and 4 below. They determine the linear response of the system to deviations from equilibrium, i.e. energy and mass flows resulting from thermal and chemical gradients. The gist of the Green-Kubo method is that the kinetic coefficients , although representing non-equilibrium behavior, are linked to fluctuations in thermodynamic equilibrium via the fluctuation-dissipation theorem. The kinetic coefficients, and hence the thermal conductivity, can therefore be obtained from equilibrium MD by means of appropriate Green-Kubo formulae, which relate the linear response of a system with volume to current correlation functions in thermodynamic equilibrium:
| (2) |
where is Boltzmann’s constant, and the are Cartesian components of the energy current () or of the mass currents (, where is the number of chemical species in the system), with respective dimensions of energy or mass times velocity. Angular brackets denote an ensemble average. We assume that the center of mass is at rest, hence there are only independent mass currents for a system with chemical species. Then, for a system with two species, the thermal conductivity is given by (Galamba et al., 2007),
| (3) |
and for a system with three species by (Salanne et al., 2011)
| (4) |
It is worth noting that equations 3 and 4 are written here in terms of mass currents, whereas they were originally derived in terms of ionic currents.
III Simulation details
We performed equilibrium molecular dynamics simulations in the ensemble, with a time step of 1 fs for the integration of the equation of motion and a Nosé-Hoover thermostat (Nosé, 1984; Hoover, 1985) maintaining the system at the desired temperature. The cell dimensions were chosen as the average cell size in a previous run at the desired pressure , maintained by a barostat (Martyna et al., 1994). The interactions between atoms were described by an advanced ionic interaction potential which was parameterized non-empirically, using DFT as a reference (Jahn and Madden, 2007). This potential has been shown to reliably predict properties of minerals of the system CaO-MgO-Al2O3-SiO2 over a wide temperature and pressure range, with accuracy comparable to DFT. In particular, the ionic interaction potential used in this study was shown to describe MgO and the MgSiO3 phases perovskite and post-perovskite well, predicting lattice constants to within 1% and elastic constants mostly to within 10%, compared to DFT results (Jahn and Madden, 2007). The elastic constants determine vibrational modes of the crystal in the limit of long wavelengths (Ashcroft and Mermin, 1976). These modes close to the Brillouin zone center, in turn, are expected to make the largest contribution to the thermal conductivity of the crystal (Tang and Dong, 2010). Therefore, we expect the interaction potential to produce accurate lattice dynamics and thermal transport properties. For MgO, MgSiO3 Pv, and MgSiO3 PPv, we used cubic or orthorhombic supercells containing 512, 960, and 720 atoms, respectively. For each composition, temperature, and pressure, we generated trajectories of at least 0.5 ns and up to 2.4 ns.

At each time step of the MD run, the mass currents for each species and the energy current were extracted for later calculation of the different current correlation functions needed in eq. 2. An explicit expression for the energy current for polarizable ions was derived by Ohtori et al. (2009b). The total MD run was then divided into blocks of equal length (50 to 100 ps) which were analyzed independently for current correlation functions and thermal conductivity. The correlation time in eq. 2 was chosen large enough for the thermal conductivity to reach convergence. In practice, as a function of oscillates around its limiting value, and for each MD block, we took a time average over the first plateau of the cumulative (averaged over the from the individual MD blocks), see Fig. 1. Finally, the thermal conductivity and its uncertainty were obtained by averaging the results from all blocks.
IV Results and discussion
IV.1 MgO
For reference, we first calculated the thermal conductivity of isotopically pure MgO in the fcc structure at 300 K and ambient pressure. At these conditions, the model predicts a density = 3.602 g/cm3, which is in excellent agreement with the experimental density at ambient conditions, 3.583 g/cm3 (Speziale et al., 2001). In Fig. 1, we show the computed thermal conductivity as a function of correlation time , see eq. 2. The data contain a number of outliers, due to the second term on the right side of eq. 3. Both and are expected to be close to zero when no diffusion is present, thus the quotient may take on very large positive or negative values occasionally, although it should be small in a crystal. Since outliers tend to distort arithmetic averages, we calculated the conductivity for each MD block from the median of the data over the plateau, which is a more representative measure for the expectation value in such cases.
| phase | (g/cm3) | (K) | (GPa) | (GPa) | (W/(mK)) |
| MgO | 3.602 | 300 | 0 | 1 | 111 16 |
| 76 11 a | |||||
| 62 b | |||||
| 59 6 c | |||||
| 75 d | |||||
| e | |||||
| 5.410 | 300 | 134 | 151 | 1400 250 | |
| 4.201 | 2000 | 41 | 45 | 40.0 2.5 | |
| 5.307 | 2000 | 133 | 148 | 141 11 | |
| 5.307 | 3000 | 138 | 155 | 76.8 4.4 | |
| MgSiO3 Pv | 4.544 | 300 | 26 | 31 | 27.0 2.2 |
| 26 | 19 f | ||||
| 31 | 10.6 0.6 g | ||||
| 5.332 | 300 | 107 | 111 | 61.3 7.9 | |
| 108.4 | 23.7 4 g | ||||
| 4.544 | 2000 | 40 | 42 | 9.7 1.0 | |
| 5.401 | 3000 | 139 | 137 | 12.4 2.0 | |
| 300 | – | ambient | 5.1 h | ||
| 300 | – | ambient | 5.8 i | ||
| MgSiO3 PPv | 5.631 | 298 | 135 | 138 | 167 25 |
| 141 | 65 14 g | ||||
| 5.482 | 2000 | 130 | 132 | 16.8 0.5 | |
| 5.631 | 2000 | 150 | 150 | 20.6 1.7 | |
| 5.482 | 3000 | 138 | 140 | 15.1 0.9 | |
| : 18.0 1.8 | |||||
| : 13.7 1.0 | |||||
| : 14.1 1.2 |
-
a
This study, with isotope correction from Tang and Dong (2010)
-
b
Tang and Dong (2010), DFT, with isotope correction
-
c
Stackhouse et al. (2010), DFT, perfect crystal
-
d
de Koker (2010), DFT, perfect crystal
-
e
Katsura (1997), experiment at ambient conditions
-
f
Manthilake et al. (2011a), experiment at 300 K
-
g
Ohta et al. (2012), experiment at 300 K, pressure determined experimentally
-
h
Osako and Ito (1991), experiment at 300 K, metastable (quenched to ambient pressure)
-
i
Ohta et al. (2012), high- experiments, extrapolated to ambient pressure
Our value of the thermal conductivity at ambient conditions is () W/(mK), significantly larger than that found in other computational and experimental studies (table 1). However, overestimation with respect to experiments is to be expected, since we considered a perfect, isotopically pure crystal, whereas the experiments were performed on real crystals with natural isotopic composition and defects, which reduces the thermal conductivity considerably relative to its perfect-crystal value (Kremer et al., 2004; Tamura, 1983). Therefore, our results should indeed be larger than the experimental ones. Tang and Dong (2010) evaluated the isotope effect for MgO and found that at ambient conditions, the thermal conductivity of an isotopically pure crystal exceeds the one of natural samples by as much as 46%. This correction for isotopic composition is already included in their results in table 1. If we apply the same correction to our data, we get (300K,0GPa) = ()W/(mK). Defects, impurities and grain boundaries in real crystals will further reduce the thermal conductivity, and thus our result is fully compatible with the measured conductivity of () W/(mK) (Katsura, 1997). On the other hand, the computed values given by de Koker (2010) and in particular by Stackhouse et al. (2010) seem to fall at the low end of values reconcilable with experiments, as the computational data represent isotopically pure, perfect crystals and therefore should not agree with conductivities measured on real samples. Following Sellan et al. (2010), the relatively small value of Stackhouse et al. (2010) may be attributed to the use of a linear extrapolation to account for finite-size effects in the non-equilibrium MD method, which leads to a systematic underestimation of the thermal conductivity.
The thermal conductivity was evaluated at four more points, up to lowermost-mantle conditions, K, g/cm3, see table 1. These data allow us to parameterize the behavior of thermal conductivity over a wide density and temperature range, including the conditions relevant to the lower mantle. The temperature and density dependence of the thermal conductivity is a highly complex matter, and no general theory is currently available (Ohtori et al., 2009a). The dependence on density can be described, in the framework of the Debye approximation, as , where is itself a function of density and temperature in principle (de Koker, 2010). In a recent study, Manthilake et al. (2011b) tested the validity of different models for by measuring the thermal conductivity of CaGeO3 perovskite, which is an analog phase for MgSiO3. They found subtle differences in the density dependence of compared to the case of MgO, which they attributed to the larger number of optical phonons in the perovskite phase. However, in view of the limited number of data points in our present study, we take to be constant, as in Stackhouse et al. (2010), which yields an effective for the entire density range spanned by our data points. Concerning the temperature dependence, thermal conductivity approximately follows a power law at high temperatures (Ashcroft and Mermin, 1976). Following de Koker (2010) and Stackhouse et al. (2010), we write
| (5) |
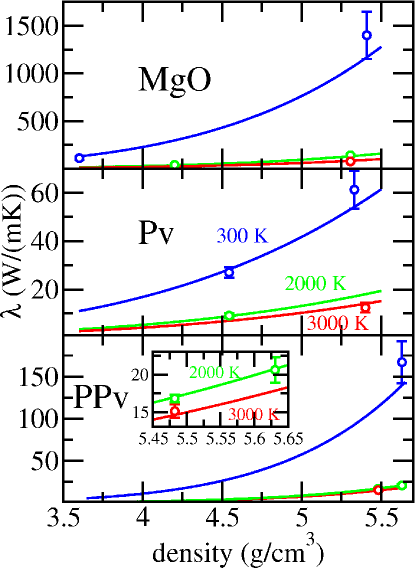
with a fixed reference point g/cm3, K, and free parameters , , and . The result of a least-square fit of eq. 5 to the data points is given in table 2. The quality of the fit can be assessed by means of fig. 2.
| (g/cm3) | (K) | (W/(mK)) | |||
|---|---|---|---|---|---|
| MgO | 3.602 | 300 | 129 | 5.42 | 1.10 |
| MgSiO3 Pv | 4.544 | 300 | 28.3 | 4.06 | 0.608 |
| MgSiO3 PPv | 5.482 | 3000 | 14.6 | 7.48 | 0.327 |
At the high temperatures prevailing at the CMB, anharmonicity, i.e. phonon-phonon scattering, is expected to be the dominant mechanism limiting the thermal conductivity, compared to other sources of phonon scattering like isotopic disorder, point defects, and grain boundaries. This is because the number of phonons present in the material increases with temperature and hence the mean free path between phonon-phonon collisions becomes shorter than the mean free path imposed by other scattering mechanisms. The reduction of the thermal conductivity due to isotopic disorder in MgO has been shown to decrease from 46% at room temperature to only 4% at 4000 K (Tang and Dong, 2010). Qualitatively the same behavior has been observed in experiments on other materials, see e.g. Kremer et al. (2004). In MD simulations, anharmonicity, i.e. the dominant scattering mechanism at high temperatures, is automatically included to all orders, and hence our conductivity results for a perfect crystal should be a good approximation for real MgO at CMB conditions. The same argument applies to the MgSiO3 phases to which we turn in the following paragraphs. Although the above reasoning is based on sound physical considerations, we emphasize that more experimental or simulation data are needed to fully understand and quantify the influence of different kinds of defects on the thermal conductivity at high pressure and temperature.
IV.2 MgSiO3 perovskite
MgSiO3 in the orthorhombic perovskite structure is generally accepted to be the most abundant mineral in the Earth’s lower mantle (i.e. below a depth of 670 km). It consists of a three-dimensional network of corner-sharing SiO6 octahedra, with Mg occupying the larger inter-octahedral sites. The calculated thermal conductivity of MgSiO3 in the perovskite structure, averaged over all directions, at four state points spanning a wide range of densities and temperatures, is given in table 1, along with available experimental data. The effect of isotopic disorder on the thermal conductivity is not known for the MgSiO3 phases Pv and PPv. As in the case of MgO, it may be significant at low temperatures but is expected to decrease rapidly with temperature. The density and temperature dependence of thermal conductivity is well described by eq. 5, and the respective fit parameters are listed in table 2. In fig. 2, the model conductivity is plotted along with the computed data points.
The available experimental data for perovskite scatter considerably (table 1), and the effect of grain boundaries, isotopic disorder and other defects like possible cracks in the samples is not known quantitatively. Hence a comparison to our results is difficult. As expected, the results obtained from perfect-crystal simulations are larger than the experimental values. Our results seem compatible with those of Manthilake et al. (2011a) but more difficult to reconcile with the data of Ohta et al. (2012). Note that at 300 K and approximately 30 GPa, Ohta et al. (2012) report a considerably lower conductivity than Manthilake et al. (2011a): the data, both derived from measurements, differ by a factor of almost 2. At ambient conditions, Osako and Ito (1991) report the conductivity to be 5.1 W/(mK), which is in line with the value of 5.8 W/(mK), derived from a fit to experimental data by Ohta et al. (2012).
IV.3 MgSiO3 post-perovskite
The perovskite structure of MgSiO3 transforms to an orthorhombic post-perovskite phase () at approximately 125 GPa and 2500 K (Murakami et al., 2004; Oganov and Ono, 2004) which is believed to be stable in the Earth’s lowermost mantle close to the core-mantle boundary and might be responsible for the D′′ seismic discontinuity (Iitaka et al., 2004). It is characterized by layers of corner- and edge-sharing SiO6 octahedra perpendicular to the axis, with Mg occupying inter-layer sites. This anisotropic structure exhibits strongly anisotropic elastic properties (Iitaka et al., 2004), which should lead to direction-dependent phonon velocities, and hence we expect anisotropic thermal transport properties. Therefore, in addition to the direction-averaged conductivity, we also calculated the thermal conductivities separately along the three axes of the orthorhombic crystal for one data point, at conditions representative of the lowermost mantle. The simulation time was extended to 2.35 ns in this case to ensure satisfying statistics for each direction individually. The results for several values are listed in table 1.
The calculated data points could not be fit satisfactorily with eq. 5, due to the very weak temperature dependence of the thermal conductivity above 2000 K (compare the second and fourth data point of PPv in table 1). This flattening of the thermal conductivity as a function of temperature is consistent with experimental observations which show a near-constant conductivity above a certain temperature, depending on the material studied (Pertermann et al., 2008). In parameterizing the thermal conductivity of PPv, we therefore used an expression which reconciles a strong temperature dependence at lower temperatures with a flat behavior at high temperatures. A good fit could be obtained with the following functional form:
| (6) |
where and are fixed reference values and , , and are fitting parameters, and the last (normalizing) factor ensures that . The results of a least-square fit are listed in table 2 and compared to the data in fig. 2. Due to the somewhat empirical nature of the assumed temperature dependence, the validity of eq. 6 is restricted to the temperature range covered by our data points. It can certainly not be applied below 298 K: in fact, the expression diverges at K. However, we stress that all data points are well fitted. In particular, the density and temperature dependence at conditions of the lower mantle is well captured by the model, as can be seen from the inset in fig. 2.
The calculated conductivity at conditions of the lowermost mantle is clearly anisotropic, and it is lowest in the direction (along the axis of the crystal). This is consistent with the fact that the crystal is softer along (perpendicular to the layers formed by corner- and edge-sharing SiO6 octahedra) than along and (in the plane of the SiO6 sheets). This leads to lower phonon velocities along , at least close to the Brillouin zone center, and a reduced conductivity.
The thermal conductivity of (167 25) W/(mK), obtained at 300 K and g/cm3, is considerably higher than the value derived from experiments at similar conditions by Ohta et al. (2012), which is () W/(mK) (table 1). Although we cannot quantify the effect of defect scattering in their polycrystalline PPv sample of natural isotopic composition, the discrepancy seems too large to be completely explained by this mechanism, and its origin remains unclear. We note however, that in the case of perovskite, the thermal conductivity reported by Ohta et al. (2012) was much lower than the experimental value by Manthilake et al. (2011a). Interestingly, the estimate of Ohta et al. (2012) for the thermal conductivity of PPv at 3000 K and 135 GPa, based on an assumed temperature dependence, is close to and even slightly higher than our result at similar conditions (19.5 W/(mK) and 15.1 W/(mK), respectively). This agreement at high may partially be due to a fortuitous cancellation of discrepancies, since Ohta et al. (2012) assumed a different temperature dependence than the one we found. But it also hints at the fact that differences between perfect-crystal simulations and real-sample experiments become less important with increasing temperature.
V Implications for the thermal conductivity of the Earth’s lower mantle
When applying our results to heat transport in the Earth’s deep mantle, they should be considered upper estimates for the lattice thermal conductivities of real minerals. Our calculations do not take into account the natural isotopic composition, impurities, and defects of the minerals, all of which lower the conductivity. Manthilake et al. (2011a) measured the effect of realistic amounts of iron impurities on the thermal conductivity of MgO and MgSiO3 perovskite, at relatively low temperatures and pressures. By extrapolation, they estimate that 20 mol% and 3 mol% of iron in MgO and perovskite, respectively, reduce the thermal conductivity of the aggregate at the CMB by about 50% relative to that of the chemically pure aggregate. On the other hand, we did not take into account radiative heat transport as an additional mechanism of thermal conduction.
To calculate the thermal conductivity in the lower mantle, we assumed a simplified mantle composition, derived from the pyrolitic composition given by Piazzoni et al. (2007), with molar fractions (perovskite structure) and . The conductivities were calculated along a mantle geotherm, with the depth-dependent pressure taken from the Preliminary Reference Earth Model (Dziewonski and Anderson, 1981) and the temperature profile adopted from Stacey and Davis (2008). Since our model for thermal conductivities was parameterized as a function of density and temperature, the pressures along the geotherm had to be converted to densities. This was done by means of equations of state for the mineral phases, described by Stixrude and Lithgow-Bertelloni (2005), with a revised set of parameters for that model taken from Xu et al. (2008). The pressures resulting from the equations of states for a given density and temperature agree well with the pressures obtained directly from our MD simulations (table 1). This further corroborates the adequacy of the interaction potential used in the simulations in describing material properties over the range of the lower mantle. By means of the equations of state, the mole fractions of the individual mineral phases can be converted to volume fractions, yielding about 82% Pv and 18% MgO by volume in the lower mantle. These numbers change slightly with pressure and temperature, and the exact values resulting from the equations of state have been used throughout the study.
The thermal conductivity of a two-phase aggregate, expressed in terms of the conductivities, , and volume fractions, , of the individual phases, depends on the geometric details of the assemblage. The extreme cases are realized by a structure of alternating parallel layers of the two phases, with a heat flux parallel and perpendicular to the layers, respectively. For the former case (a “parallel circuit”), the conductivity of the aggregate is maximum and given by the arithmetic or Voigt average . For the latter (a “series circuit”), the conductivity takes on its minimum or Reuss average . For other geometries, not necessarily built from layers, the conductivity of the aggregate will lie within these bounds.
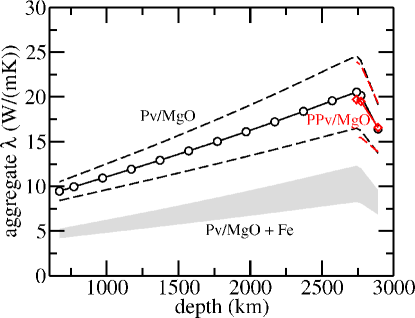
Fig. 3 shows the thermal conductivity of the MgSiO3(Pv)-MgO aggregate along the model geotherm and, for comparison, of the MgSiO3(PPv)-MgO aggregate close to the CMB. Thermal conductivity increases with pressure and decreases with increasing temperature, see eq. 5. With increasing depth, the pressure effect dominates over the concomitant temperature rise, resulting in a net increase of the thermal conductivity. Only close to the CMB, the sharp rise in temperature in the thermal boundary layer reverses this trend. At 2891 km depth, i.e. at the CMB, with GPa and K, the conductivity of a MgO/MgSiO3 perovskite aggregate is predicted to lie between W/(mK) and W/(mK), depending on geometry, with average W/(mK). With MgSiO3 in the post-perovskite structure instead, we obtain W/(mK), W/(mK), and W/(mK), i.e. changes are not significant. The value for the PPv/MgO aggregate is in good agreement with Ohta et al. (2012), who estimate the aggregate conductivity at 4000 K and 135 GPa to be approximately 16 W/(mK). Assuming that a realistic amount of iron impurities reduces the aggregate conductivities by 50% (Manthilake et al., 2011a), the respective average conductivities at the CMB are 8.2 W/(mK) for the MgO/perovskite and 8.3 W/(mK) for the MgO/post-perovskite aggregate. The influence of iron on the thermal conductivity is treated approximatively here, and more data are needed to better quantify this effect at high pressures and temperatures.
Our results for the thermal conductivity across the lower mantle for an iron-free composition are in remarkable agreement with (albeit slightly larger than predicted by) the thermal conductivity model by Manthilake et al. (2011a) which is based on an extrapolation of low- experimental data to CMB conditions, assuming an aggregate of 20% MgO and 80% Pv by volume. On the other hand, the model used by Hofmeister (1999) to extrapolate available conductivity data to high (including iron) yields somewhat smaller values, ranging approximately between 4 W/(mK) and 7 W/(mK) across the lower mantle. Also the estimate of the lower-mantle thermal conductivity by Goncharov et al. (2009) lies below our data: for the lattice conductivity, they assumed an iron-free mantle composition (20% MgO and 80% Pv by volume) and extrapolated experimental data, finding a maximum lattice thermal conductivity varying from approximately 3 W/(mK) to 11 W/(mK) across the lower mantle. Stamenković et al. (2011), using the Ross model (Ross et al., 1984) and approximative equations of state to derive high- lattice thermal conductivities from available data, also obtained values lower than ours, with not exceeding 8 W/(mK) for an iron-free mantle composition (20% MgO and 80% Pv by volume). We emphasize that our data are based on simulations directly at lower-mantle conditions and do not depend on extrapolations.
Finally, an estimate for the heat flux across the CMB is presented. Given the temperatures and at two different depths and as boundary conditions, the steady-state heat current density is determined by an integral form of Fourier’s law,
where the two concentric spheres corresponding to and are locally approximated as parallel planes. Taking the temperature at the CMB and 120 km above from Stacey and Davis (2008) and neglecting the small density variation across this layer, we obtain an average CMB heat flux of 21.5 TW for a Pv/MgO aggregate and of 21.2 TW for a PPv/MgO aggregate. This estimate is based on a specific thermal model of the Earth, and a different temperature profile at the CMB would lead to a somewhat different estimate of the CMB heat flux. Assuming that the presence of iron impurities reduces the heat flux by 50% (Manthilake et al., 2011a), it is estimated to be 10.8 TW on average for an Fe-bearing Pv/MgO aggregate and 10.6 TW for a Fe-bearing PPv/MgO aggregate, with possible variations by about 20%, depending on the geometric details of the two-phase assemblage. These values for the CMB heat flux are consistent with previous estimates, spanning a wide range from 5 TW to 15 TW (Lay et al., 2008).
VI Conclusions
We performed equilibrium MD simulations and used the Green-Kubo method to calculate lattice thermal conductivities of MgO, MgSiO3 perovskite, and MgSiO3 post-perovskite over a wide range of pressure and temperature conditions relevant to the Earth’s deep mantle. To our knowledge, these are the first simulation results for the MgSiO3 phases. Moreover, the thermal conductivity of the lowermost mantle has been determined directly, without extrapolation from experimental or computational low-pressure or low-temperature data and hence is free of the inherent uncertainties.
The data were used to construct a model for thermal conductivities as a function of density and temperature, which was then applied to the Earth’s lower mantle. The thermal conductivity was found to increase significantly with depth and to decrease steeply across the thermal boundary layer above the CMB. These results may be used in geodynamic modeling to refine large-scale simulations of mantle convection. In this field, one often assumes a constant thermal diffusivity (: densitity, : specific heat capacity) across the mantle (e.g., Tan et al. (2011)), which is poorly constrained, moreover. Together with the approximation const., this implies , a rather restrictive assumption, to be contrasted with the more flexible eq. 5.
By combining our thermal conductivity results with a thermal model of the Earth (Stacey and Davis, 2008), the lattice contribution to the CMB heat flux is estimated to be about 11 TW for a Fe-bearing two-phase aggregate (virtually the same with MgSiO3 perovskite and post-perovskite). This relatively high flux is consistent with recent estimates of the heat flux required to generate and maintain mantle plumes (Lay et al., 2008). Due to the large conductivity contrast between MgO and the MgSiO3 phases, the conductivity of the two-phase aggregate depends strongly on the aggregate geometry. Thus, the CMB heat flux may show large lateral variations by up to about %.
VII Acknowledgments
We thank Thomas C. Chust for the numerical evaluation of the equations of state as well as Hauke Marquardt, Sergio Speziale and Rene Gaßmöller for fruitful discussions. V.H. and S.J. acknowledge financial support of the Deutsche Forschungsgemeinschaft (DFG) through the Grant No. JA1469/4-1 from the Emmy-Noether-Program. Part of the work was carried out under the HPC-EUROPA2 project (project number: 228398) with the support of the European Commission Capacities Area - Research Infrastructures Initiative. We also acknowledge support of DAAD-PROCOPE under grant no. D/9811428.
References
- Ashcroft and Mermin (1976) Ashcroft, N. W., Mermin, N. D., 1976. Solid State Physics. Thomson Learning, Inc.
- Aubert et al. (2009) Aubert, J., Labrosse, S., Poitou, C., 2009. Modelling the paleo-evolution of the geodynamo. Geophys. J. Int. 179, 1414–1428.
- Callen (1985) Callen, H. B., 1985. Thermodynamics and an Introduction to Thermostatistics. John Wiley & Sons, Inc., New York.
- Davies (2007) Davies, G. F., 2007. Mantle regulation of core cooling: A geodynamo without core radioactivity? Phys. Earth Planet. Int. 160, 215–229.
- de Groot and Mazur (1984) de Groot, S. R., Mazur, P., 1984. Non-equilibrium thermodynamics. Dover Publications, Inc., New York.
- de Koker (2009) de Koker, N., 2009. Thermal conductivity of MgO periclase from equilibrium first principles molecular dynamics. Phys. Rev. Lett. 103, 125902.
- de Koker (2010) de Koker, N., 2010. Thermal conductivity of MgO periclase at high pressure: Implications for the D” region. Earth Planet. Sci. Lett. 292, 392–398.
- Dziewonski and Anderson (1981) Dziewonski, A. M., Anderson, D. L., 1981. Preliminary reference Earth model. Phys. Earth Planet. Int. 25, 297–356.
- Esfarjani and Chen (2011) Esfarjani, K., Chen, G., 2011. Heat transport in silicon from first-principles calculations. Phys. Rev. B 84, 085204.
- Galamba et al. (2007) Galamba, N., Nieto de Castro, C. A., Ely, J. F., 2007. Equilibrium and nonequilibrium molecular dynamics simulations of the thermal conductivity of molten alkali halides. J. Chem. Phys. 126, 204511.
- Goncharov et al. (2009) Goncharov, A. F., Beck, P., Struzhkin, V. V., Haugen, B. D., Jacobsen, S. D., 2009. Thermal conductivity of lower-mantle minerals. Phys. Earth Planet. Int. 174, 24–32.
- Hofmeister (1999) Hofmeister, A. M., 1999. Mantle Values of Thermal Conductivity and the Geotherm from Phonon Lifetimes. Science 283, 1699–1706.
- Hofmeister and Yuen (2007) Hofmeister, A. M., Yuen, D. A., 2007. Critical phenomena in thermal conductivity: Implications for lower mantle dynamics. J. Geodyn. 44, 186–199.
- Hoover (1985) Hoover, W. G., 1985. Canonical dynamics: Equilibrium phase-space distributions. Phys. Rev. A 31, 1695–1697.
- Iitaka et al. (2004) Iitaka, T., Hirose, K., Kawamura, K., Murakami, M., 2004. The elasticity of the MgSiO3 post-perovskite phase in the Earth’s lowermost mantle. Nature 430, 442–445.
- Jahn and Madden (2007) Jahn, S., Madden, P. A., 2007. Modeling Earth materials from crustal to lower mantle conditions: A transferable set of interaction potentials for the CMAS system. Phys. Earth Planet. Int. 162, 129–139.
- Katsura (1997) Katsura, T., 1997. Thermal diffusivity of periclase at high temperatures and high pressures. Phys. Earth Planet. Int. 101, 73–77.
- Keppler et al. (2008) Keppler, H., Dubrovinsky, L. S., Narygina, O., Kantor, I., 2008. Optical Absorption and Radiative Thermal Conductivity of Silicate Perovskite to 125 Gigapascals. Science 322, 1529–1532.
- Kremer et al. (2004) Kremer, R. K., Graf, K., Cardona, M., Devyatykh, G. G., Gusev, A. V., Gibin, A. M., Inyushkin, A. V., Taldenkov, A. N., Pohl, H.-J., 2004. Thermal conductivity of isotopically enriched 28Si: revisited. Sol. State Comm. 131, 499–503.
- Kubo (1957) Kubo, R., 1957. Statistical-mechanical theory of irreversible processes. i. J. Phys. Soc. Japan 12, 570–586.
- Lay et al. (2008) Lay, T., Hernlund, J., Buffet, B. A., 2008. Core-mantle boundary heat flow. Nature Geoscience 1, 25–32.
- Manthilake et al. (2011a) Manthilake, G. M., de Koker, N., Frost, D. J., McCammon, C., 2011a. Lattice thermal conductivity of lower mantle minerals and heat flux from Earth’s core. PNAS 108, 17901–17904.
- Manthilake et al. (2011b) Manthilake, M. A. G. M., de Koker, N., Frost, D. J., 2011b. Thermal conductivity of CaGeO3 perovskite at high pressure. Geophys. Res. Lett. 38, L08301.
- Martyna et al. (1994) Martyna, G. J., Tobias, D. J., Klein, M. L., 1994. Constant pressure molecular dynamics algorithms. J. Chem. Phys. 101, 4177–4189.
- Müller-Plathe (1997) Müller-Plathe, F., 1997. A simple nonequilibrium molecular dynamics method for calculating the thermal conductivity. J. Chem. Phys. 106, 6082–6085.
- Murakami et al. (2004) Murakami, M., Hirose, K., Kawamura, K., Sata, N., Ohishi, Y., 2004. Post-Perovskite Phase Transition in MgSiO3. Science 304, 855–858.
- Naliboff and Kellogg (2007) Naliboff, J. B., Kellogg, L. H., 2007. Can large increases in viscosity and thermal conductivity preserve large-scale heterogeneity in the mantle? Phys. Earth Planet. Int. 161, 86–102.
- Nieto-Draghi and Avalos (2003) Nieto-Draghi, C., Avalos, J. B., 2003. Non-equilibrium momentum exchange algorithm for molecular dynamics simulation of heat flow in multicomponent systems. Mol. Phys. 101, 2303–2307.
- Nosé (1984) Nosé, S., 1984. A molecular dynamics method for simulations in the canonical ensemble. Mol. Phys. 52, 255–268.
- Oganov and Ono (2004) Oganov, A. R., Ono, S., 2004. Theoretical and experimental evidence for a post-perovskite phase of MgSiO3 in Earth’s D” layer. Nature 430, 445–448.
- Ohta et al. (2012) Ohta, K., Yagi, T., Taketoshi, N., Hirose, K., Kombayashi, T., Baba, T., Ohishi, Y., Hernlund, J., 2012. Lattice thermal conductivity of MgSiO3 perovskite and post-perovskite at the core-mantle boundary. Earth Planet. Sci. Lett. 349-350, 109–115.
- Ohtori et al. (2009a) Ohtori, N., Oono, T., Takase, T., 2009a. Thermal conductivity of molten alkali halides: Temperature and density dependence. J. Chem. Phys. 130, 044505.
- Ohtori et al. (2009b) Ohtori, N., Salanne, M., Madden, P. A., 2009b. Calculations of the thermal conductivities of ionic materials by simulation with polarizable interaction potentials. J. Chem. Phys. 130, 104507.
- Osako and Ito (1991) Osako, M., Ito, E., 1991. Thermal diffusivity of MgSiO3 perovskite. Geophys. Res. Lett. 18, 239–242.
- Pertermann et al. (2008) Pertermann, M., Whittington, A. G., Hofmeister, A. M., Spera, F. J., Zayak, J., 2008. Transport properties of low-sanidine single-crystals, glasses and melts at high temperature. Contrib. Mineral. Petrol. 155, 689–702.
- Piazzoni et al. (2007) Piazzoni, A. S., Steinle-Neumann, G., Bunge, H.-P., Dolejš, D., 2007. A mineralogical model for density and elasticity of the Earth’s mantle. Geochem. Geophys. Geosyst. 8, Q11010.
- Ross et al. (1984) Ross, R. G., Andersson, P., Sundqvist, B., Bäckström, G., 1984. Thermal conductivity of solids and liquids under pressure. Rep. Prog. Phys. 47, 1347–1402.
- Salanne et al. (2011) Salanne, M., Marrocchelli, D., Merlet, C., Ohtori, N., Madden, P. A., 2011. Thermal conductivity of ionic systems from equilibrium molecular dynamics. J. Phys. Cond. Mat. 23, 102101.
- Sellan et al. (2010) Sellan, D. P., Landry, E. S., Turney, J. E., McGaughey, A. J. H., Amon, C. H., 2010. Size effects in molecular dynamics thermal conductivity predictions. Phys. Rev. B 81, 214305.
- Speziale et al. (2001) Speziale, S., Zha, C.-S., Duffy, T. S., Hemley, R. J., Mao, H.-k., 2001. Quasi-hydrostatic compression of magnesium oxide to 52GPa: Implications for the pressure-volume-temperature equation of state. J. Geophys. Res. 106, 515–528.
- Stacey and Davis (2008) Stacey, F. D., Davis, P. M., 2008. Physics of the Earth, 4th Edition. Cambridge University Press, Cambridge.
- Stackhouse et al. (2010) Stackhouse, S., Stixrude, L., Karki, B. B., 2010. Thermal conductivity of periclase (MgO) from first principles. Phys. Rev. Lett. 104, 208501.
- Stamenković et al. (2011) Stamenković, V., Breuer, D., Spohn, T., 2011. Thermal and transport properties of mantle rock at high pressure: Applications to super-Earths. Icarus 216, 572–596.
- Stixrude and Lithgow-Bertelloni (2005) Stixrude, L., Lithgow-Bertelloni, C., 2005. Thermodynamics of mantle minerals - I. Physical properties. Geophys. J. Int. 162, 610–632.
- Tamura (1983) Tamura, S.-i., 1983. Isotope scattering of dispersive phonons in Ge. Phys. Rev. B 27, 858–866.
- Tan et al. (2011) Tan, E., Leng, W., Zhong, S., Gurnis, M., 2011. On the location of plumes and lateral movement of thermochemical structures with high bulk modulus in the 3-D compressible mantle. Geochem. Geophys. Geosys. 12, Q07005.
- Tang and Dong (2010) Tang, X., Dong, J., 2010. Lattice thermal conductivity of MgO at conditions of Earth’s interior. PNAS 107, 4539–4543.
- Volz and Chen (2000) Volz, S. G., Chen, G., 2000. Molecular-dynamics simulation of thermal conductivity of silicon crystals. Phys. Rev. B 61, 2651–2656.
- Xu et al. (2008) Xu, W., Lithgow-Bertelloni, C., Stixrude, L., Ritsema, J., 2008. The effect of bulk composition and temperature on mantle seismic structure. Earth Planet. Sci. Lett. 275, 70–79.