Chandra View of the Warm-Hot IGM toward 1ES 1553+113: Absorption Line Detections and Identifications (Paper I)
Abstract
We present the first results from our pilot 500 ks Chandra-LETG Large Program observation of the soft X-ray brightest source in the sky, the blazar 1ES 1553+113, aimed to secure the first uncontroversial detections of the missing baryons in the X-rays.
We identify a total of 11 possible absorption lines, with single-line statistical significances between 2.2-4.1. Six of these lines are detected at high single-line statistical significance (), while the remaining five are regarded as marginal detections in association with either other X-ray lines detected at higher significance and/or Far-Ultraviolet (FUV) signposts. Three of these lines are consistent with metal absorption at , and we identify them with Galactic OI and CII. The remaining 8 lines may be imprinted by intervening absorbers and are all consistent with being high-ionization counterparts of Far-Ultraviolet (FUV) HI and/or OVI IGM signposts.
In particular, five of these eight possible intervening absoption lines (single-line statistical significances of 4.1, 4.1, 3.9, 3.8 and 2.7), are identified as CV and CVI K absorbers belonging to three WHIM systems at , and , which also produce broad HI (and OVI for the system) absorption in the FUV. For two of these systems ( and 0.237), the Chandra X-ray data led the a-posteriori discovery of physically consistent broad HI associations in the FUV (for the third system the opposite applies), so confirming the power of the X-ray-FUV synergy for WHIM studies. The true statistical significances of these three X-ray absorption systems, after properly accounting for the number of redshift trials, are (; 6.3 if the low-significance OV and CV K associations are considered), (), and 3.8 (), respectively.
1 Introduction
According to the latest baryon census in the local () Universe (Shull, Smith & Danforth, 2012 and references therein), about 30-40% of the total number of baryons predicted by Big-Bang Nucleosynthesis (e.g. Kirkman et al. 2003), inferred by density fluctuations of the Cosmic Microwawe Background (e.g. Bennett et al. 2003; Spergel et al. 2007), and seen at in the “Ly Forest” (e.g. Rauch, 1998; Weinberg et al. 1997), are missing at the present epoch.
Of the low- baryons we can account for in a recent census (Shull, Smith & Danforth, 2012), % lie in a collapsed phase (stars, cold atomic and molecular gas in galaxies, circumgalactic medium - CGM -, and hot virialized gas in groups and clusters of galaxies), % lie in the local photoionized Ly forest, and finally, as much as % , are estimated to be found in the OVI/BLA-traced Warm-Hot Intergalactic Medium 111This estimate is based on an average ionization and metallicity, versus column density, correction derived by hydrodynamical simulations, and therefore suffers not only the large scatter found in the given simulation between these parameters (i.e. Fig. 8 in Shull, Smith & Danforth, 2012), but also the scatter of theoretical predictions from simulation to simulations (e.g. Cen & Ostriker, 2006, Tornatore et al. 2010, Bertone et al. 2010, Branchini et al. 2009, Smith et al. 2011). The resulting number of baryons still missing also depends on these uncertainties. . The remaining % of baryons still remains elusive, and are likely to lie in the hot phase of the WHIM, at temperatures larger than logT K.
This is predicted by nearly all hydrodynamical simulations for the formation of structures in a -CDM Universe (e.g. Cen & Ostriker, 2006, Tornatore et al. 2010, Bertone et al. 2010, Branchini et al. 2009, Smith et al. 2011). According to simulations, starting at redshift of some of the IGM was shock-heated to temperatures of K during the continued process of collapse and structure formation, and enriched up to Z Z⊙ by galaxy super-winds (GSW, e.g. Cen & Ostriker, 2006) already at redshifts of , remaining essentially unchanged from then to . The first pieces of observational evidence of this violent process of structure formation are starting to be gathered in the densest nodes of this filamentary IGM, at and inside the virial radius of massive clusters of galaxies (e.g. Keshet et al. 2012). However, diffuse WHIM filaments are too tenuous to be detected through their bremsstrahlung and line emission with current Far-Ultraviolet (FUV) or X-ray instruments (e.g. Yoshikawa et al. 2003). Absorption is more promising.
The lowest temperature tail of the WHIM distribution, from T up to K (where the fraction of OVI peaks), has been most likely detected in the FUV, with FUSE and the STIS spectrometer onboard the Hubble Space Telescope (HST), in OVI and narrow Ly absorbers, though the fraction of this gas that actually belongs to the shock-heated WHIM is highly uncertain (e.g. Danforth & Shull, 2008). More recently, the advent of the larger throughput Cosmic Origins Spectrograph of HST (COS, hereinafter) has enabled the detection of somewhat hotter (T) and possibly truly shock-heated WHIM, through the detectability of the strongest (i.e. large column density) Broad Lyman absorbers (BLAs) with thermal Doppler parameter km s-1 (Danforth, Stocke & Shull, 2010) 222The thermal Doppler parameter, is typically narrower than the measured Doppler parameter , which includes a combination of internal turbulence and Hubble-flow broadening. Danforth, Stocke & Shull, 2010, estimate an average correction factor . . These BLAs are in principle good tracers of the warm (T K) portion of the WHIM, where a significant fraction of the WHIM (%, e.g. Cen & Ostriker, 2006) is supposed to reside. However, observing km s-1 BLAs requires data of excellent quality and accurate continuum definition to detect the low-contrast features. In addition, measuring HI without an ionization correction 333The measured HI Doppler parameter gives only an upper limit on the gas temperrature, and in addition, the proper ionization correction depends also on the gas density because of the second-order contribution of photo-ionization, and this can only be estimated through multi-ion metal measurements, e.g. Nicastro et al. 2002). will always underestimate the actual baryon fraction in the fraction of hot IGM sampled by these tracers. Given the temperature of this gas, such an ionization correction can only come from the X-ray detection of the highly ionized counterparts to such BLAs. Finally, the T K portion of the WHIM (the vast majority of the WHIM mass) can only be detected through highly ionized metals in the X-rays.
However, detecting the metal tracers of the bulk of the “Missing Baryons” in the “X-Ray Forest”, has proven to be extremely difficult. This is because of the unfortunate combination of (a) the still limited resolving power ( at the location of the OVII K transition, at Å) and the low throughput ( cm2) of the current high-resolution X-ray spectrometers [the XMM-Newton Reflection Grating Spectrometer (RGS, den Herder, et al. 2001) and the Chandra Low Energy Transmission Grating (LETG: Brinkman et al. 2000)]; (b) the lack of bright ( erg s-1 cm-2) extragalactic point-like targets at sufficiently high redshifts; and, (c) the dramatic steepening in slope () of the predicted number density of metal He-like WHIM filaments per unit redshift at ion column densities cm-2 (e.g. Cen & Fang, 1996). Current evidence is still limited, and highly controversial.
The statistically strongest evidence to date comes from the evidence for large amounts of baryonic matter in two intervening WHIM filaments along the line of sight to the nearby () blazar Mkn 421 (Nicastro et al. 2005a,b). However, these results are controversial (Kaastra et al. 2006, Rasmussen et al. 2007, Danforth et al. 2011, Yao et al. 2012; but see also Williams et al. 2006, Nicastro, Mathur & Elvis, 2008, Williams et al. 2010).
Over the last few years there have been new discoveries reported (Buote et al. 2009: B09; Fang et al. 2010: F10; Nicastro et al. 2010, Zappacosta et al. 2010, Zappacosta et al. 2012). However, such tentative discoveries are either serendipitous (and so biased toward the strongest systems: Nicastro et al. 2010; Zappacosta et al, 2012), or trace extreme galaxy overdensity regions (Zappacosta et al. 2010) or even just galaxy halos (Buote et al. 2009; Zappacosta et al. 2010; Williams et al. 2012). In all cases, these sample only the hottest and densest IGM or circumgalactic medium, which is not representative of the majority of the WHIM.
Thus a firm, high-significance detection of the bulk of the missing baryon mass has not been secured yet. To do so, the only pursuable observational strategy, with current instrumentation, is to first identify “true” gaseous signposts (e.g. Mathur, Weinberg & Chen, 2003) of the T WHIM (i.e. BLAs), and then search for their metal counterparts in the soft X-rays, along optimally selected sightlines. Over the past two years we selected 1ES 1553+113 as “the best WHIM target in the Universe’ (because of its extreme soft X-ray brightness, relatively high redshift and the presence of BLA signposts in its HST-COS spectrum - Danforth et al. 2010), and started the X-ray campaign with a pilot 500 ks Chandra cycle 12 observation of 1ES 1553+113. In our observing proposal, we conservatively tuned the exposure of this first pilot observation to test the reliability of the strongest FUV systems as gaseous signposts for X-ray WHIM filaments. The results are well beyond the most optimistic expectations and confirm the effectiveness of such an observational strategy. In this article we report on these results from the pilot Chandra-LETG spectrum.
The paper is organized as follow. In §2 we describe the target of our LETG observation, and summarize the relevant results from the HST-COS observations reported by Danforth et al. (2010). Section 3 describes the Chandra-LETG data reduction and analysis, while in §4, we discuss our findings and present possible absorption system identifications. Finally in §5, we summarize our conclusions. In a forthcoming article (“paper II”), we will present a self-consistent modeling of the spectral features detected in the LETG spectrum of 1ES 1553+113 by making use of our WHIM hybrid collisional-ionization plus photoionization models, and so deriving preliminary estimates of metallicities of these systems, the ionization-corrected baryon cosmological mass density of the WHIM at T K, the number density of CV and OVII WHIM absorbers as a function of the ion column density.
2 1ES 1553+113 and the WHIM Signposts along its Line of Sight
Four years ago, we selected 1ES 1553+113 as the optimal target for FUV and X-ray WHIM studies, because of its relatively high estimated redshift prior to spectroscopic determinations (, from the non-detection of the host galaxy in a deep HST R image: Treves et al. 2007), its high Galactic latitude () and its extreme average 0.1-2.4 keV brightness of 2 mCrab ( erg s-1 cm-2), coupled with a bright and stable FUV flux of erg s-1 cm-2.
1ES 1553+113 was first observed with the HST-COS on September 22, 2009, for 3 orbits (1 orbit with the G130M and 2 with the G160M grating: Danforth et al. 2010). Almost 2 years later, on July 24, 2011, the target was re-observed for 2 additional orbits with the G130 M and 4 additional oribits with the G160M. The first COS spectrum of 1ES 1553+113 was published in 2010, by Danforth and collaborators. Here we summarize the main findings from this 2009 observation, relevant to this work.
The published HST-COS spectrum of 1ES 1553+113 secured a robust lower limit on the spectroscopic redshift of 1ES 1553+113. Narrow HI Ly (NLA) and OVI absorption is observed at a combined 19.3 significance at (Fig. 2 of Danforth et al. 2010), so establishing a spectroscopic lower limit on the redshift of 1ES 1553+113 of (almost twice the non-spectroscopic value upon which we based our original selection) and making this target by far the brightest, non-transient, X-ray source in the sky. Moreover, Danforth et al. (2010) report on the presence of 5 possible BLAs, at , 0.10230, 0.12325, 0.13334 and 0.15234, plus a rare and complex triple-HI-metal absorption system at , spanning a range of 1200 km s-1 in velocity (Fig. 2, Table 1, in Danforth et al. 2010). In our work, we use these systems as initial gaseous signposts for our X-ray search of either WHIM filaments (BLA counterparts), or highly ionized galaxy outflows and hot circumgalactic medium from nearby galaxies (counterparts to the triple-HI-metal system). However, since the 2011 COS observation observation almost doubled the S/N of the first published spectrum of 1ES 1553+113, we also retrieved and reduced the total final COS spectrum of 1ES 1553+1§13, and present here a re-analysis of it whenever the higher S/N data detect FUV lines associated to the proposed X-ray identifications and that had eluded detections in the published spectrum because of its lower S/N.
3 The Chandra-LETG spectrum of 1ES 1553+113
Chandra observed 1ES 1553+113 between May-June 2011, for 500 ks, with the LETG spectrometer (constant resolution mÅ, i.e. resolving power R at Å) dispersed across the High Resolution Camera for Spectroscopy (HRC-S, Murray et al. 1985) plates. The observation consisted of three visits with exposures of 166.3 ks (2011, May 4-6), 175.4 ks (2011, May 6-9) and 153.9 ks (2011, June 18-20).
3.1 Data Reduction
The data were reduced with the latest version of the Chandra Interactive Analysis of Observation software (CIAO v. 4.4.1, CALDB v. 4.5.2), following the standard processing procedures outlined in the HRC-S-LETG grating analysis thread 444http://cxc.harvard.edu/ciao/guides/gspec_hrcsletg.html .
The Chandra HRC-S detector has virtually no spectral resolution, which prevents the separation of the different spectral orders dispersed by the LETG. For each observation, we therefore extracted “all-order” negative and positive source and background spectra with the CIAO tool tg_extract. This produced a total of six LETG spectra, three (one per LETG visit) negative-order and three positive-order source and background spectra, extracted at a binning pace of mÅ, i.e. oversampling the LETG FWHM resolution of 50 mÅ by a factor of 4.
Due to the impossibility of separating HRC-LETG spectral orders, the spectral modeling of these spectra must be performed by folding the fitting models with the sum of the convolution products of the redistribution matrices (RMFs) and ancillary response files (ARFs) belonging to the first N positive and negative orders, respectively. For our LETG observations of 1ES 1553+113, we conservatively decided to build our final “all-order” response matrix by adding up positive and negative orders up to N = 10. For each order, we used the CIAO tools mkgarf and mkgrmf to build 20 effective area and photon-redistribution matrices, which were then read together with the data into the CIAO fitting-package Sherpa, through the commands load_multi_arfs and load_multi_rmfs.
To maximize the S/N of our spectra (we note that the HRC-S-LETG combination has an effective area of only A cm2 at both and 44 Å), we first co-added the three negative and three positive-order spectra (source and background) from the three observations (CIAO tool add_grating_spectra), to produce 2 LETG spectra (one negative- and one positive-order spectrum), with net exposures of 495.6 ks each. Effective area matrices of the three observations, for each of the 10 negative and ten positive orders, were averaged together, producing 20 averaged effective area matrices (ARFs). Finally, we used the CIAO tool add_grating_orders to co-add the two negative and positive order source and background spectra and ARFs, to end up with a single LETG spectrum, containing all counts from the ten negative-order and the ten positive-order spectra of the three Chandra observations of 1ES 1553+113. The final co-added spectrum, has roughly 250-300 net (i.e. background subtracted) counts per mÅ, resolution element, over the two interesting spectral bands covering the OVII K ( Å) and CV K ( Å) ranges at redshifts where WHIM absorption might be found, for a signal-to-noise ratio per resolution element (S/N).
Because of our co-adding procedure, particular care must be taken to account for the wavelength calibration inaccuracy. The Chandra LETG-HRC-S spectrometer suffers a variable intrinsic wavelength uncertainty owing to the non-linearity in the effective dispersion relation. This non-linearity is due to a spatial imaging non-linearity of the HRC-S detector caused by the combination of (1) partial charge loss in the 3-tap read-out algorithm of each of the three HRC-S microchannel plates, each of which is divided into 190 taps along the dispersion direction, and (2) a hardware problem that corrupts the data from the position taps under a specific set of conditions. The net result is that photon event positions obtained from processing HRC-S telemetry can be offset from their true values 555See http://cxc.harvard.edu/cal/Letg/Hrc_disp/degap.html . The wavelength errors thus depend on the physical location of dispersed photon events on the HRC-S, and so on both precise nominal pointing direction and the deliberate Lissajous figure “dither” about this point 666See, e.g. http://cxc.harvard.edu/cal/Letg/Corrlam/ . An updated version of the degap polynomial coefficients based on empirical wavelength corrections from multiple HRC-S/LETG observations of Capella has been released since CALDB 3.2.15. This update allows the correction of the non-linearities in the HRC-S dispersion relation improving the 90% statistical significance uncertainties across the detector (i.e. ) from 22 mÅ to 16 mÅ. Since we have co-added three different observations, and then the resulting positive and negative orders, we should consider a larger uncertainty. By propagating four times, in quadrature, the quoted deviations, we obtain 90% uncertainties of 32 mÅ. However, since the updated wavelength corrections have been applied to the rest-frame position of the strongest soft X-ray metal electronic transitions and the interpolation of the correction may not be strictly valid to the position of blueshifted and redshifted lines, we conservatively adopt a 90% wavalength uncertainty 40 mÅ, 80% of the LETG Line Spread Function (LSF) FWHM.
In the following we report all uncertainties at the 1 (68%) statistical significance level, with the exception of X-ray wavelength and redshifts, for which we use 90% statistical confidences (i.e. 1.6).
3.2 Data Analysis
We used the fitting package Sherpa, in CIAO, to fit our Chandra-LETG spectrum of 1ES 1553+113. We ignored data outside the Å spectral interval, where the (S/N) was either too low ( Å and Å) and/or the spectral resolving power too low (at Å, R, implying km s-1).
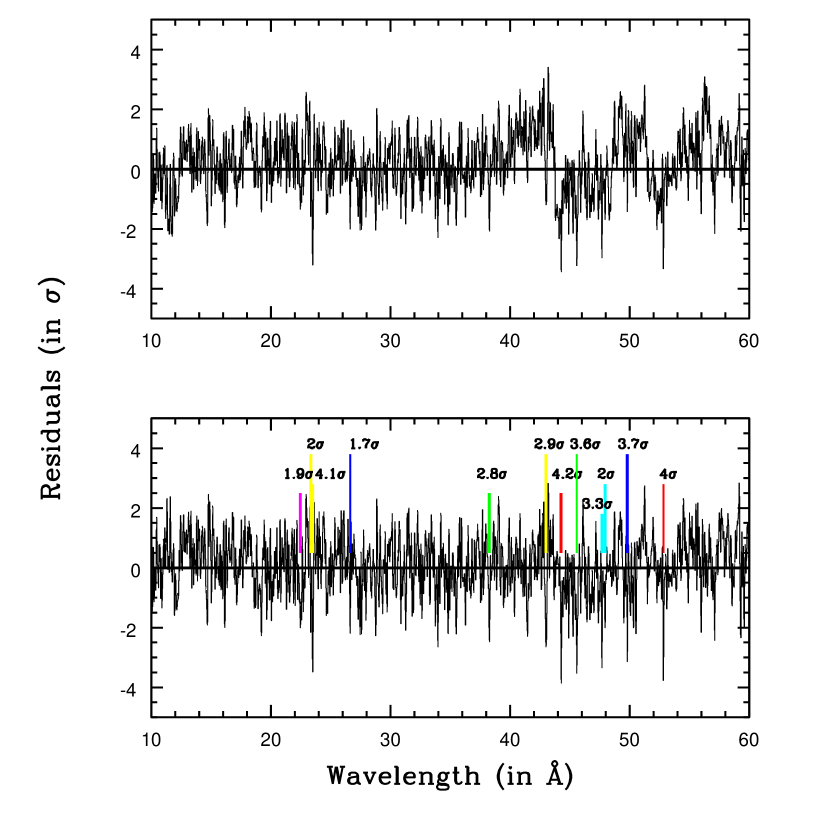
We first fitted the spectrum with a model consisting of a single power law absorbed by neutral gas. This yielded a best-fitting power-law energy spectral index and cold-absorber column density of and N cm-2 (fully consistent with the Galactic value along the line of sight to 1ES 1553+113: N cm-2 (Kalberla et al. 2005). The integrated reduced was acceptable, . However, a visual inspection of the residuals showed both broad deviations around the K instrumental edges of OI ( Å) and CI ( Å), the M edges of I and Cs ( Å) and the HRC-S plate gaps ( Å), as well as narrow deficit of counts at specific wavalengths. Figure 1, top panel, shows these residuals smoothed through a convolution with the LETG LSF, in re-normalized (after smoothing) standard deviations.
At first, we excluded the possible absorption lines (which do not affect the continuum fitting over the integrated 10-60 Å band) and focused on curing the residual calibration uncertainties around the positions of the instrumental I, Cs, O and C edges and the HRC-S plate gaps, with the aim of reaching an optimal model of the continuum that would allow us to properly assess the statistical significance of true physical spectral features possibly present in the spectrum. We then added to the continuum model, (a) an edge with negative optical depth, to cure the sharp edge-like emission feature present in the residuals at Å and due to either an over-estimated modeling of the CI instrumental edge in the LETG effective area, or a non-accurate modeling of the CI absorption edge in the wabs model of XSPEC, or both (best-fit ); (b) three broad emission Gaussians at Å, Å and Å (best-fitting Å for the first two and Å for the third) to model residuals broad wiggles at the wavelength of the CI edge, and the dithering-shaped HRC-S plate gaps 777During every pointing the Chandra satellite dithers around the aim-point sky coordinates producing a Lissajous-figure in detector coordinates. This implies that plate-gaps are not blind to photons at all times during the observation, and their dispersion position (for dispersed spectra) can be reconstructed a posteriori by applying the aspect-solution. However, the exact shape of the effective area at the plate-gap wavelengths depends on the accuracy of the aspect-reconstruction and the zeroth-order centroid. ; (c) Five notch XSPEC component models: 4 negative (at , , 48.34 and 52.14 Å, with total widths of 0.6, 0.4, 0.2 and 1.1 A, respectively), to model residual narrower (but still well resolved) deviations at the I and Cs M edges and the C K edge and plate-gaps wavlengths Fig. 1, top panel), and one positive with central Å and total width of 5.5 Å, to model a systematic excess over the 18-23 Å spectral region, just leftward of the instrumental O K edge.
We re-fitted the data, and obtained an improvement of , for 20 additional degrees of freedom, with almost unchanged best-fitting parameters: and N cm-2. We measure a (0.1 - 2) keV flux of F erg s-1 cm-2 (1.2 mCrab). The LSF-smoothed residuals now appear flat over the entire 10-60 Å band (Fig. 1, bottom panel).
3.2.1 Unresolved Absorption Lines: Detectability of Carbon vs Oxygen
A visual inspection of the LSF-smoothed residuals in Fig. 1 (bottom panel), shows clear narrow (i.e. unresolved: Å) deficit of counts involving 3-6 consecutive bins, especially in the spectral region where redshifted C absorption is expected. This is expected: indeed, the sensitivity of dispersed spectrometers with constant and S/N per resolution element, over a given band-pass, to a given ion column density, increases with wavelengths. This is because of the concurrence of two independent facts. First, the absorption line equivalent width (EW) sensitivity of a dispersed spectrum with given constant and S/N, down to a statistical significance N, can be written:
| (1) |
Second, the absorption line EW is related to the column density of the ion imprinting the line in the spectrum through the rest-frame position of the line and the redshift of the absorber. For unsaturated lines we can write:
| (2) |
with in Å and where is the column density of the ion of the element in cm-2, is the oscillator strength of the given transition of the ion , the rest-frame wavelength (in Å) of the given transition of the ion , and the redshift of the absorber. Therefore, from equations 1 and 2:
| (3) |
Let us now consider, the LETG spectrometer and, for example, the strongest K transitions of the two stable and most abundant ions of carbon and oxygen at T K, i.e. CV and OVII. The rest frame wavelengths of these two transitions are in a 1:2 ratio, and fall in regions of the spectrometer with similar effective area (i.e. similar S/N in the same spectrum). Therefore, from Eq. 3, one gets
For a broad range of WHIM temperatures, logT, the fraction of CV and OVII are similar and between 0.7-1. At logT CV largely dominates over OVII. Moreover, in gas with solar-like composition, oxygen is roughly twice more abundant than carbon. So, for logT the minimum detectable CV column density is at least twice smaller than the minimum detectable OVII column density.
3.2.2 Automated Identification of Absorption-Line Candidates
To identify candidate unresolved absorption lines we wrote a routine that scans the LSF-smoothed residuals (Fig. 1, bottom panel) over mÅ wide contiguous bins (2.5 LETG resolution elements), to search for negative deficits of counts involving between 3-7 consecutive bins (i.e. 0.75-1.75 LETG LSF FWHM at our oversampled resolution), and line-shaped, i.e. symmetrically distributed around a central negative peak (at least one left and one right bin with values higher than the peak). We do not consider resolved lines here (i.e. consecutive deficits of counts spreading over more than bins), since we assume that any ISM or IGM absorption lines must have intrinisc FWHM km s-1. By definition, LSF-smoothing of the residuals tends to smooth flickering in adjacent sub-resolution bins. Thus, on the one hand it highlights real absorption (or emission) lines, but on the other hand it also increases the number of false absorption (or emission) line-like features with typical LSF width (see, e.g., Fig. 1 bottom panel). We can estimate the expected number of LSF-shaped emission or absorption features exceeding a bin-by-bin integrated (in quadrature) significance of 3, by using a simple Gaussian argument. At our 4 LSF over-sampled binning, we have a total of (60-10)/0.0125 = 4000 bins. Therefore the Gaussian-predicted number of positive or negative LSF-shaped fluctuations at is (1 - 0.997) = 12. So, on average, we expect a total of 6 emission and 6 absorption LSF-shaped fluctuations. Indeed, the blind run of the scanning routine over the 10-60 Å LSF-smoothed residuals (over-sampled at a resolution of 0.25 the LETG LSF FWHM), finds exactly 6 LSF-shaped emission features exceeding the bin-by-bin integrated (in quadrature) statistical significance of , according to expectations given the blazar nature of the target and the consequent absence of intrinsic emission in the optical or infrared spectra of 1ES 1553+113. On the contrary, 50 of such features are found in absorption, clearly suggesting that real absorption lines are imprinted on the 10-60 Å LETG continuum spectrum of 1ES 1553+113. Given the way the scanning routine works, moving on contiguous 2.5 LETG-LSF wide bins, some of the 50 absorption line candidates found by the routine are simply the same strong feature, detected twice over adjacent scanned bins. This leaves about 40 absorption-line candidates, still many more than predicted by Gaussian statistics and found in emission.
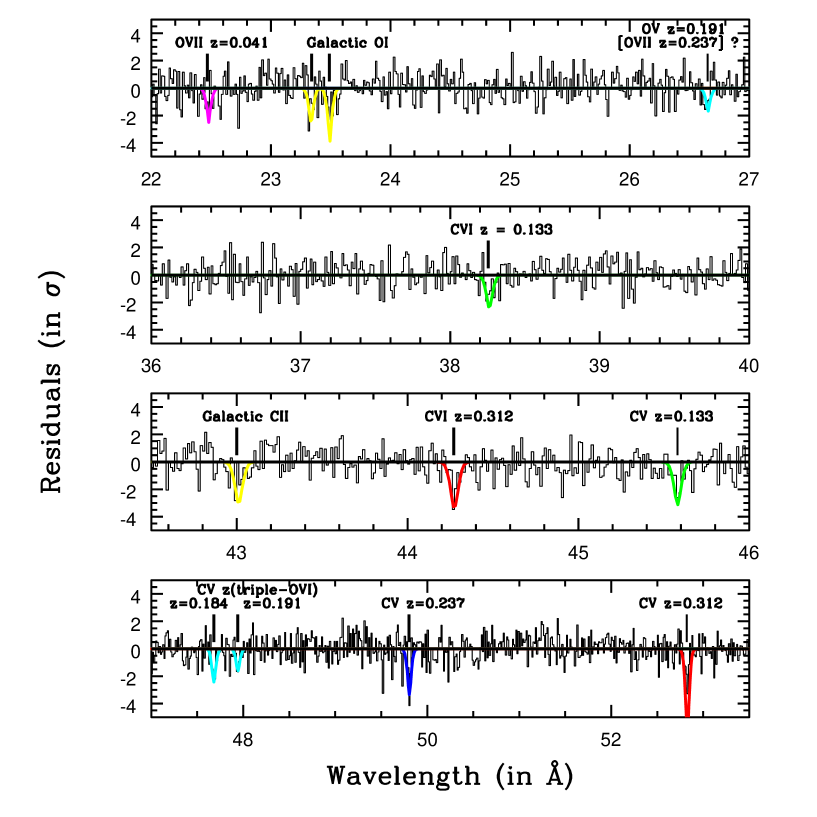
To confirm the real absorption-line nature of these candidates (at least down to the sensitivity of the current LETG spectrum), we therefore used unresolved (line FWHM frozen at 5 mÅ) absorption Gaussians to model the non-smoothed data. We added these Gaussians one by one and refitted the data, by allowing the line position to vary within 0.5 Å around the scan-routine determined position of the centroid. This procedure yielded the results summarized in Table 1, columns 1 and 2. Only 12 of the possible absorption candidates were actually confirmed by the fitting procedure at % () statistical significance. The single-line (prior to secure identification) statistical significances of 11 of these lines (computed as the ratio between the best-fitting line normalization and its 1 uncertainty) are in the range : three lines at , three at , five at . (Table 1, column 2 and Fig. 1 bottom panel). An additional line-like feature is only hinted by the data and can be fitted with a negative Gaussian with single-line statistical significance of 1.7. In the following we consider the six lines with prior-to-identification statistical significance (0.04 and 0.08 expected by chance up to in the oxygen and carbon bands, respectively; see §4.2) as real absorption lines, which need to be identified. The remaining six absorption features are considered as tentative detections that need confirmation, and we consider them here only in association with either higher significance LETG absorbers or COS signposts, or both. In Figure 2 we show the best fitting models of the 12 absorption lines superposed on the non-LSF-smoothed residuals (in standard deviations) of the data to the best-fitting continuum model. Best fitting Gaussians models are color-grouped into 6 different systems, according to their possible identifications (§4.1).
| aWavelength | bSignificance | Redshift | Id | COS HI, Metal I |
| in Å | in | |||
| Galactic Absorbers | ||||
| 2.5 | OI Molecular | N/A | ||
| 4.1 | OI K Atomic | N/A | ||
| 2.8 | CII K Atomic | N/A | ||
| Intervening Absorbers | ||||
| High-Confidence X-ray System Detections and COS Associations | ||||
| 4.1 | CVI K | BLA-OVI | ||
| 4.1 | CV K | BLA-OVI | ||
| 3.9 | CV K | BLA | ||
| 1.7 | OVII K | BLA | ||
| 3.8 | CV K | BLAd | ||
| 2.7 | CVI K | BLAd | ||
| Tentative X-ray Detections and COS Associations | ||||
| 3.6 | CV K | Triple-HI: | ||
| 2.2 | CV K | BLA-OVI | ||
| 1.7 | OV K | BLA-OVI | ||
| 2.3 | OVII K | BLA | ||
a We use 40 mÅ as 1 systematic uncertainities for the HRC-LETG co-added negative and positive order wavelength scale. This is (4/5) of the LETG Line Spread Function FWHM, and it is due to the non-linearity in the HRC-LETG effective dispersion relation.
b Single-line statistical significances, obtained by ratioing the best-fitting line normalization and its 1 error.
c This line can be identified with either an OVII K transition at , close but only 3 consistent with the CV-BLA system at (§4.1.3), or with an OV K transition associated with the CV-BLA-OVI system at (§4.1.5).
d Given the relatively low-temperature derived from the HI Doppler parameter, the column density of this HI component is probably too low to produce all the CV and CVI detected in the LETG, even assuming Solar abundances. (see §4.1.3).
4 Discussion
The LETG spectrum of 1ES 1553+113, reveals the presence of unresolved line-like absorption in both the oxygen K and carbon K regions. These absorption lines could be the imprints of either Galactic ISM and/or CGM, or of warm-hot intervening IGM, or both. To identify these systems, we consider all the strongest ground-state metal transitions (K) from all ions of the two most abundant elements in gas with solar-like composition (O and C). We try to match the possible identifications, with the available redshift priors: (a) , rest-frame absorption by the ISM of our Galaxy, or CGM (the LETG resolution does not allow us to kinematically distinguish between the two; e.g. Gupta et al. 2012 and references therein), and (b) the redshifts of the possible BLAs (or NLAs) and/or OVI absorbers identified in the COS spectrum of 1ES 1553+113 (Danforth et al. 2010).
4.1 Absorption System Identifications
The longest wavelength HI Ly securely identified in the COS spectrum of 1ES 1553+113, is at Å, . At longer wavelengths, and up to the COS G160M band-limit ( Å, or in HI Ly), the absorption line density drops dramatically, indicating as a likely redshift for the target (Danforth et al. 2010). We therefore assume as the redshift of 1ES 1553+113.
The 12 absorption features identified as possible lines in the LETG spectrum of 1ES 1553+113, have wavelengths between Å (four lines in the O-region of the spectrum) and Å (8 lines in the C-region of the spectrum). The shortest wavelength K transition of O is that of its H-like ion (OVIII), at Å (Verner, Verner & Ferland, 1996), while the longest wavelength K transition of O is the inner-shell transition of its neutral ion (OI), at Å (E. Behar, private communication) 888For most of the K inner-shell transitions of C and O (with the exception of OI and CII, for which empirical observational values are available, e.g. Takei, Fujimoto & Mitsuda, 2002, Shulz et al. 2003, Juett et al. 2004) we use wavelengths and oscillator strengths computed through the HULLAC code (Bar-Shalom, Klapisch & Oreg, 2001). The uncertainties on the rest-frame positions of these transitions are of the order of 0.1-1% (i.e. mÅ (i.e. Behar & Netzer, 2002). However, several of these positions have been bench-marked with either laboratory or astrophysical experiments (e.g. Kaastra et al. 2011, and reference therein; Shulz et al. 2003, and references therein; Juett et al. 2004)., and have resulted to be accurate to mÅ. . Similarly, for C, we have Å (Verner, Verner & Ferland, 1996), and and 43.27 Å (an LETG-resolved doublet; E. Behar, private communication), as the shortest and longest wavelength transitions, respectively. Intermediate ionization ions have their K transition wavelengths between these extremes . So, the four LSF-shaped features in the 22-27 Å range (Figure 1, top panel), if true absorption lines, can only be identified with OVIII in the ranges or with OI-OVII at , with the exact lower limit depending on the ion considered. Analogously, the eight line-like features at Å can only be identified with CVI in the range or CI-CV at , while the feature at Å, can only be due to redshifted CVI.
We have checked these ions one by one, and propose possible identifications based on HI and/or OVI COS associations. We only check here for possible X-ray C and/or O counterparts to the FUV signposts. These are by far the two most abundant metals in gas with solar-like composition (Asplund et al. 2009), with C being only a factor of less abundant than O, and the third most abundant metals (N and Ne) being less abundant than C. Similarly, when in doubt between two or more identifications involving different ions of C and/or O, we always favor the He-like metal identification, i.e. CV and/or OVII. These are the He-like ions of C and O, respectively, and as such are highly stable and by far the most abundant ions of their respective elements over a broad range of temperatures. The oscillator strengths of their K transitions are also the strongest of all the other K transitions from lower- or higher-ionization ions.
4.1.1 Galactic Absorption
The three lines at Å, Å and Å, are consistent with absorption by neutral (or only moderately ionized) species of C and O. In particular, we clearly (4.1) detect atomic OI at Å and also a marginal (2.5) excess of molecular OI (possibly ISM oxygen in coumpound forms of oxide dust grains, e.g. Takei, Fujimoto & Mitsuda, 2002) at Å, with respect to the instrumental molecular OI. Atomic OI is not an instrumental feature (e.g. Takei, Fujimoto & Mistuda 2002). Finally we marginally (2.8) detect the signature of CII (whose K transition is twice as strong as the single transitions of the resolved and undetected CI doublet) at Å999Not only the CII K transitions is intrinsically stronger than the CI K, but also CII is expected to be much more abundant than CI in the Galaxy, because neutral carbon is easily photoionized by ambient UV radiation (the C I ionization edge is at 11.260 eV or 1101 Å). . We identify these three transitions as due to the cold ISM of our Galaxy (Table 1, Columns 3-4; Fig. 1 and 2, yellow lines), and we therefore consider their single-line statistical significance as their true (i.e. after a secure identifications) statistical significance.
We also note that we do not detect any OVII K absorber along the line of sight to 1ES 1553+113, down to the 3 sensitivity limit of our Chandra LETG spectrum, in this spectral region: EW(OVII()) mÅ.
Below we present the possible intervening system identifications in order of statistical significances.
4.1.2 The CV-CVI-BLA-OVI WHIM System
The line at Å, is that detected at the highest statistical significance () in the LETG spectrum (together with the line at Å and the Galactic OI atomic line). The CI, CII and CIV K transitions, at this wavelength, would be redshifted at , 0.031 and 0.070. At none of these redshifts is there a metal or HI association in COS. At the redshift of a putative CIII, instead, , there is a moderately strong NLA. However, no imprint of a CIII absorber is seen in the FUSE spectrum of 1ES 1553+113 (though its presence cannot be ruled out due to the presence of HI Ly and OI absorption/airglow in FUSE), and no other metal lines are present in the FUSE or COS spectra at this redshift. CV and CVI identifications are more promising.
The CV K transition would be redshifted at . At a close (but inconsistent) redshift () there is one of the strongest HI Ly lines in COS, which is also seen in Ly and is consistent with being thermally broadened (BLA) at T K. Moreover, at Å there is another line in the LETG spectrum (3.8), which, if identified with CIV, would fall at . The possible temperature of the HI absorber at is consistent with the presence of CIV and CV, however no CIV doublet () is seen in the COS spectrum at or . We conclude (both for the lack of CIV in COS and the redshift inconsistency with the BLA) that the CV/CIV identification with a thick and moderately cool WHIM filament traced by the COS BLA at , is unlikely.
A more likely identification is with a CVI K transition at Å, which would have a redshift of . At Å there is the other highest statistical significance line of the LETG spectrum (4.1), which, if identified with CV K, would fall at , exactly the redshift of the CVI identification. No HI or OVI identification is reported at a consistent redshift in the published COS spectrum. However, with additional data, the currently available COS spectrum of 1ES 1553+113 has a S/N a factor higher than the published spectrum. We therefore downloaded from the HST-MAST archive all available HST-COS spectra of 1ES 1553+113 taken with the G130M and G160M gratings, and re-analyzed the two portions of the spectrum at Å and Å, regions where the OVI doublet (i.e. OVI, oscillator strength , and OVI, ) and the HI Ly at are supposed to lie.
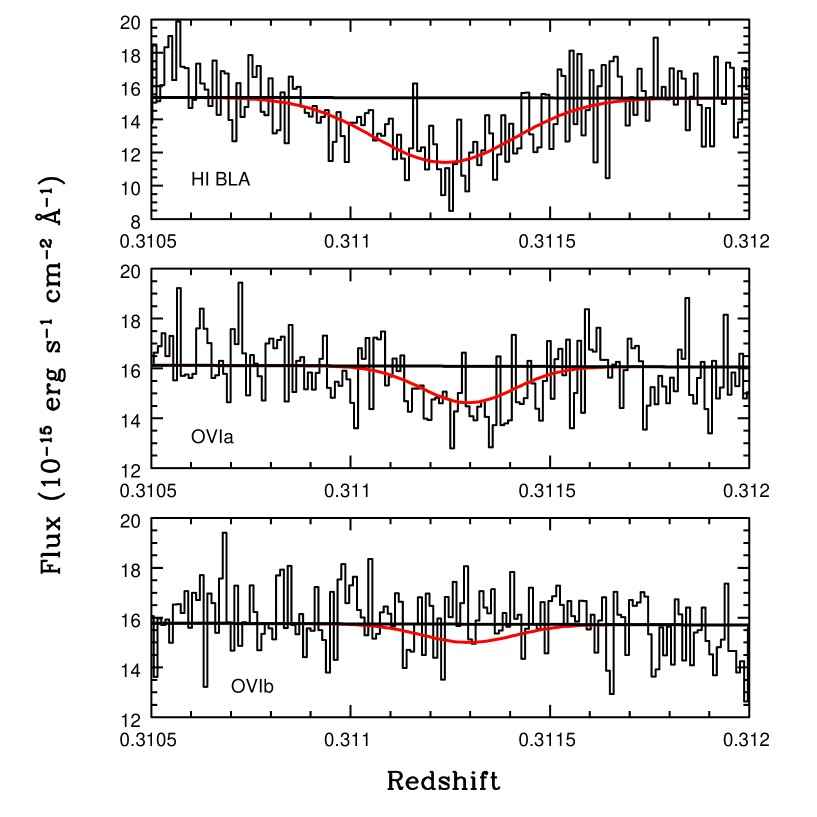
We identify a strong HI BLA at (8.1; Fig. 3 top panel), with the following best-fitting parameters: Å, km s-1 and EW mÅ. The strongest line of the OVI doublet (OVI1) is also detected (; Fig 3, central panel), with best fitting parameters: Å (i.e. ), km s-1, and EW mÅ. Finally, the weakest line of the OVI doublet (OVI2) is not detected in the data (Fig. 3, bottom panel), but the COS 3 EW upper limit at the wavelengths of this line, EW mÅ, is consistent with the maximum possible EW expected for the OVI2 (given the measured EW(OVI1) and the fact that this line is not blank). From the observed HI and OVI Doppler parameters, we can estimate the relative contribution of thermal and turbulence broadening. In general, if and are the observed Dopller parameters of two associated lines of HI and a metal with atomic weight , then the HI thermal parameter is given by:
| (4) |
So, in this case we have: km s-1 (implying logT) and km s-1, with a thermal contribution (in quadrature) of 75% and a correction factor, similar to the average value found by Danforth, Stocke & Shull (2010).
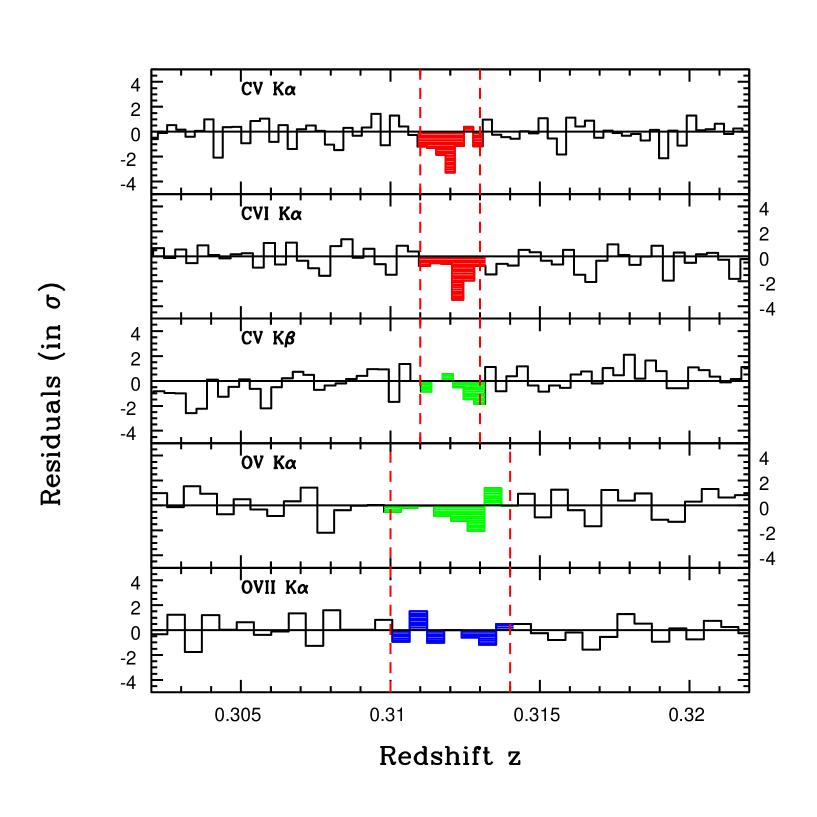
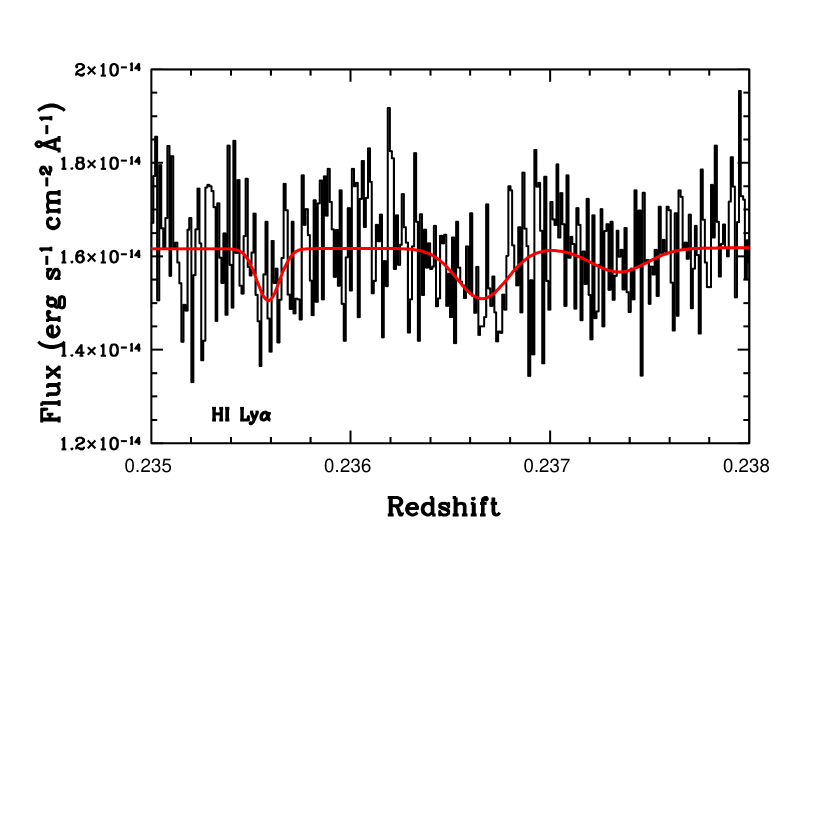
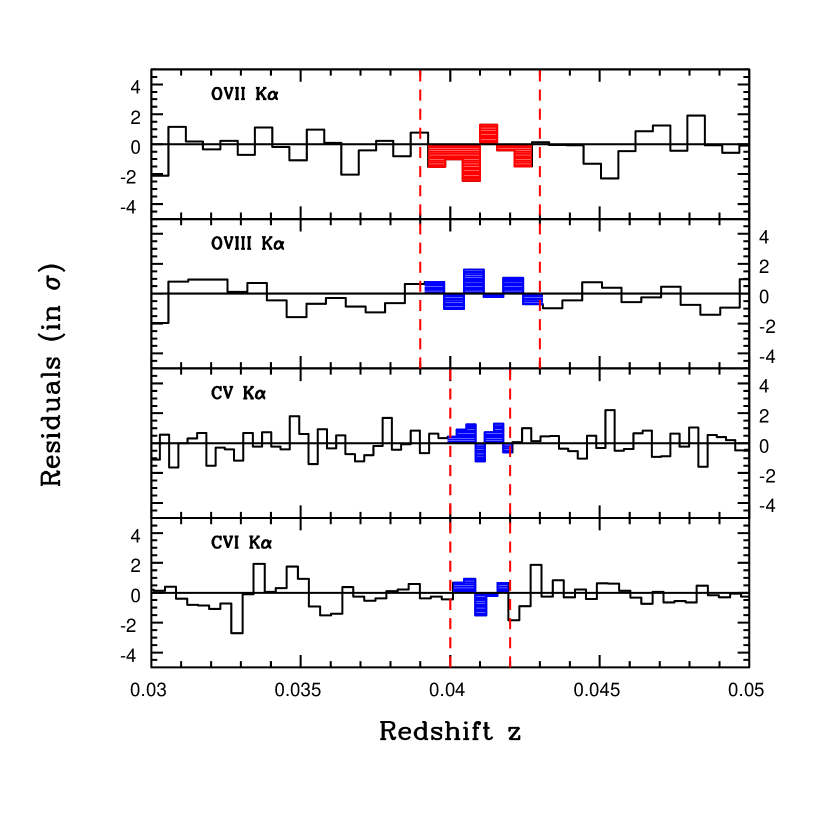
We conclude that the two highest significance intervening LETG lines are CV and CVI absorbers at (Table 1; Fig. 1 red lines), possibly imprinted by an intervening WHIM filament, as further suggested by the a-posteriori discovery of an associated strong BLA and OVI counterpart in the COS spectrum, with the right temperature (i.e., line Doppler parameters) and strength. This identification is further strenghtened by the a-posteriori discovery of two additional associated X-ray absorption lines. Figure 4 shows 5 portions of the LETG spectrum of 1ES 1553+113, centered around the CV K (top panel), CVI K (second panel), CV K (third panel), OV K, and OVII K transitions at . Clearly, both the OV K and the CV K lines are hinted in the data, and were not picked up by our scanning routine because of their bin-by-bin integrated (in quadrature) significance, which is slightly lower ( for both lines) than the threshold that we imposed in our search (§3.2). The single-line statistical significance of these two additional lines are 1.9 and 1.6, respectively. The OVII K transition, instead, is undetected (Fig. 4, bottom panel) down to the 3 sensitivity threshold of EW mÅ, confirming the relatively low temperature for this system.
4.1.3 The WHIM System
The line at Å is the second highest statistical significance line detected with the LETG (3.9). This line can only be associated with a COS absorber if identified as a CV K at . Indeed, at a marginally consistent redshift of , there is a weak (EW mÅ) NLA ( km s-1) in the published COS spectrum (Danforth et al., 2010). The HI line, however, is too weak and much too narrow to be considered the actual counterpart of a putative CV absorber, so, if the LETG identification is correct, CV and NLA would be the tracers of a spatially co-located multi-phase WHIM filament, and a broader HI absorber should exist at , undetected down to the sensitivity limit of the published COS spectrum. To investigate this possibility further, we searched for such a BLA absorber in the currently available COS spectrum of 1ES 1553+113, which, at the interesting wavelengths has a factor of 2 higher S/N than the published spectrum. We confirm the presence of the NLA at with EW mÅ and km s-1 (Fig. 5). Additionally the data also show a structured and broad absorption complex at (Fig. 5). We model this complex with two gaussians with best-fitting HI Ly centroids , , equivalent widths EW mÅ (5), EW mÅ (2.2), and Doppler parameters b km s-1, b km s-1. The redshifts of these two BLAs are both fully consistent with that of the putative CV K absorber, and their widths suggest temperatures in the ranges logT and logT (where the lower boundaries of these intervals are corrected for the average observed ratio: Danforth et al., 2010), again consistent with the presence of a large fraction (%) of CV.
In the same temperature interval CVI is also relatively abundant, with a fraction raising monotonically from % at logT=5.1 to % at logT=5.9, but the oscillator strength of the CVI K transition is 1.7 times smaller than that of the CV K transition. The strongest transitions expected from oxygen, instead, depend on the exact temperature within this broad interval: at logT, OV K is the strongest transition expected (with %), while at logT the OVII K dominates, with %. We therefore looked for the presence of these three transitions in the LETG spectrum of 1ES 1553+113. The top panel of Figure 6 shows the detection that we tentatively identify with CV K at . The remaining three panels show the postions of the CVI K (second panel), OV K (third panel) and OVII K (bottom panel) in the redshift range. We note that OV K and CVI K (shifted by ) may be hinted in the data (second and third panels of Figure 6). We also note that the two line-like deficits of counts visible in the third and bottom panels of Figure 6 (magenta bins), just leftward of the 90% confidence redshift interval of our tentative CV K identification (dashed red lines), could be identifiable with OV K and OVII K at , respectively. Indeed the magenta-colored feature in the bottom panel of Fig. 6 is the lowest significance (1.7) line-like absorption feature identified by our scanning routine and susbequently confirmed by a Gaussian fit in the LETG, at Å. However the redshift of these two putative OV K and OVII K identifications is only marginally (3) consistent with that of our CV K identification. Moreover, for the putative OVII K at an alternative identification is possible: that of an OV K absorber at associated with a CV-BLA system (see §4.1.5). Higher quality data are needed to discriminate between these two possibilities.
We conclude that the most likely identification for the line at Å (3.9) is that of a CV K line imprinted by a highly ionized shock-heated WHIM metal system at , producing also structured BLA absorption at and (Fig. 5), as well as a nearby NLA at (Fig. 5) in a mildly photo-ionized portion of the filament, possibly at the interface of the shock-heated part of the main-body filament (Table 1; Fig. 1, blue lines; Fig. 5 and 6). Such multi-phase systems, with metals tracing hot collisionally ionized gas and narrow HI tracing a cooler photoionized portion of the same system, have been observed in OVI-NLA in the FUV (Danforth & Shull 2008), but it would be the first time they are observed in hotter gas traced by CV-BLA pairs. Confirming the presence of a nearby higher-ionization OV-OVII absorber, would probe an even more extreme regime and would therefore be extremely important.
4.1.4 The Multiphase and Multi-Component CV-CVI-BLA System
The line at Å (3.8), cannot be associated with any metal or HI system in COS, if identified as CII, CIII or CVI. The CIV identification has already been ruled out in §4.1.2, because no corresponding CIV transition is detected in COS at . At the redshift of a putative CI identification (), instead, there is a NLA in COS (). However, CI must be associated with almost neutral gas, with a large HI/H fraction. The HI column derived from the COS data is only N cm-2, implying a total baryon column of at most N cm-2. Galactic CI is not detected in these LETG data, and our line of sight to 1ES1553+113 crosses a Galactic column density N cm-2. Finally, there are 10 CI transitions accessible in the COS bandpass, and none is detected at . We therefore rule out the CI identification for this line.
The only possibility left is CV at . The marginal detection at Å (2.7) would have a marginally consistent redshift of , if identified with CVI K. At a redshift consistent with both the CV and CVI X-ray lines () there is a weak (N cm-2) HI Ly in COS, with a doppler parameter of km s-1. Correcting for the empirically derived ratio of (Danforth, Stocke & Shull, 2010), gives a thermal width of km s-1, implying T K, consistent with either shock-heated WHIM or low-density purely photoionized IGM. However, we note that, given the relatively low-temperature derived from the HI Doppler parameter, the column density of this HI component is probably too low to produce all the CV and CVI detected in the LETG, even assuming Solar abundances. Therefore, if our identification is correct, the CV-CVI system cannot be entirely and directly associated with the HI Ly in COS. Possibly some of the detected CV and CVI must be associated with an even broader and shallower HI not detectable at the sensitivity of the current COS spectrum.
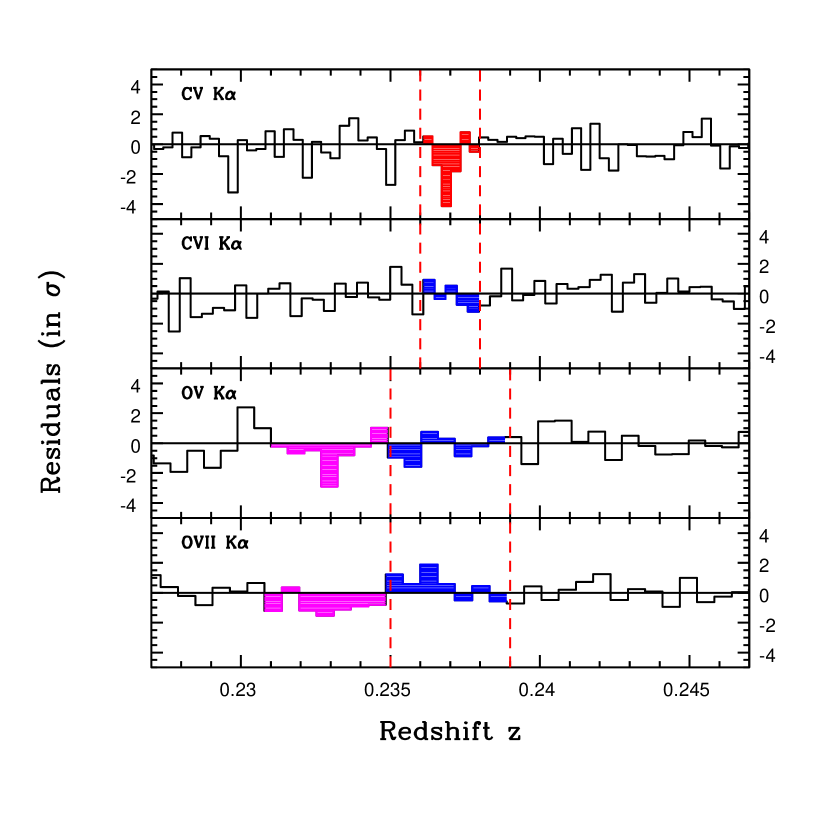
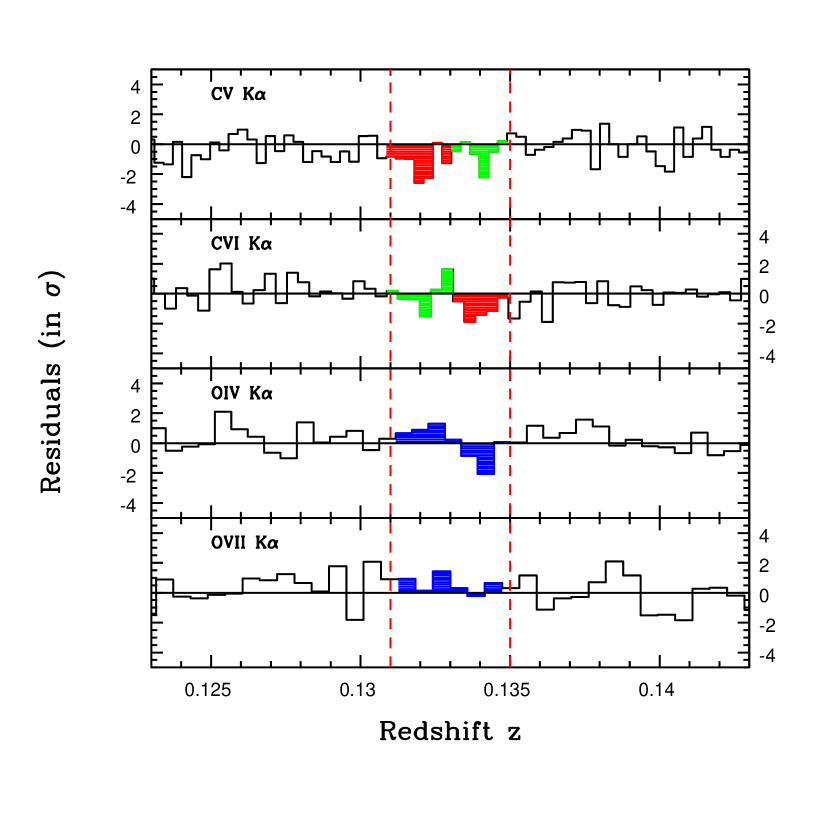
To further investigate on this possible identification we visually inspected the portions of the LETG spectrum where the tentatively detected CV and CVI K transitions, as well as other, similar ionization, associated lines of O and C would fall. Figure 7 shows 4 portions of the LETG spectrum of 1ES 1553+113 centered around the interval, for the CV K (top panel), CVI K (second panel), OIV K (third panel) and OVII K (bottom panel) transitions. Interestingly, the complex profiles of the CV and CVI K lines, suggest the presence of a double component (red and green filled bins in the top and second panel of Fig. 7). No other associated X-ray line is hinted by the data (possibly with the exception of a small deficit of counts at one of the two components of OIV: third panel).
We conclude that the CV/CVI K complex at an average redshift of (Fig. 7) is the most likely identification for these two LETG line complexes (Table 1; Fig. 1, green line, and Fig. 7 top 2 panels), possibly produced in a multi-phase, multi-component WHIM filament together with the spatially associated BLA absorber.
4.1.5 The Double-CV
The line at Å (3.6) can only be identified as CV K. No other ion of C can be associated with any metal and/or HI absorber in COS. Instead, the redshifts of the CV K identification, is close, but only marginally consistent, with the short-wavelength extreme of a narrow redshift interval, , where a rare triple-HI system is found in COS. No OVI is detected at , while both the and the absorbers have associated OVI absorption, with the central system (the one with higher column density) showing also NV, CIII and SiII absorption (Danforth et al. 2010). We re-analyzed these three absorbers in the currently available HST-COS spectrum of 1ES 1553+113 and measured the doppler parameters of the lines detected from the two HI-metal systems at and . From these, we derive the thermal HI Dopler parameters of these two systems (by correcting for the average value): km s-1 and km s-1, respectively. Clearly, the HI-metal system at is imprinted by photo-ionized gas, while the HI-OVI absorber is a WHIM system with logT.
Interestingly, in the LETG we also marginally detect (2.2) a line-like absorption feature at Å. Also for this line, if real, the only possible identification, in association with a COS HI and/or metal system, is CV K at , consistent with the long-wavelength extreme of the COS triple-HI-metal system, where a relatively strong BLA (logN) is present. Figure 8 shows five portions of the LETG spectrum of 1ES 1553+113 in the interval, for the CV K (top panel), the CVI K (second panel), the OIV K (third panel), the OV K (fourth panel) and the OVII K (bottom panel) transitions. No associated X-ray lines is hinted in the data for the tentative CV K identification at . The situation is different for the second tentative CV K identification at (the higher redshift boundary of the triple-HI-metal system detected in COS, where a BLA is present). For this system the OV K transition is identifiable with the lowest significance (1.7) line-like absorption feature identified by our scanning routine and susbequently confirmed by a Gaussian fit in the LETG, at Å.
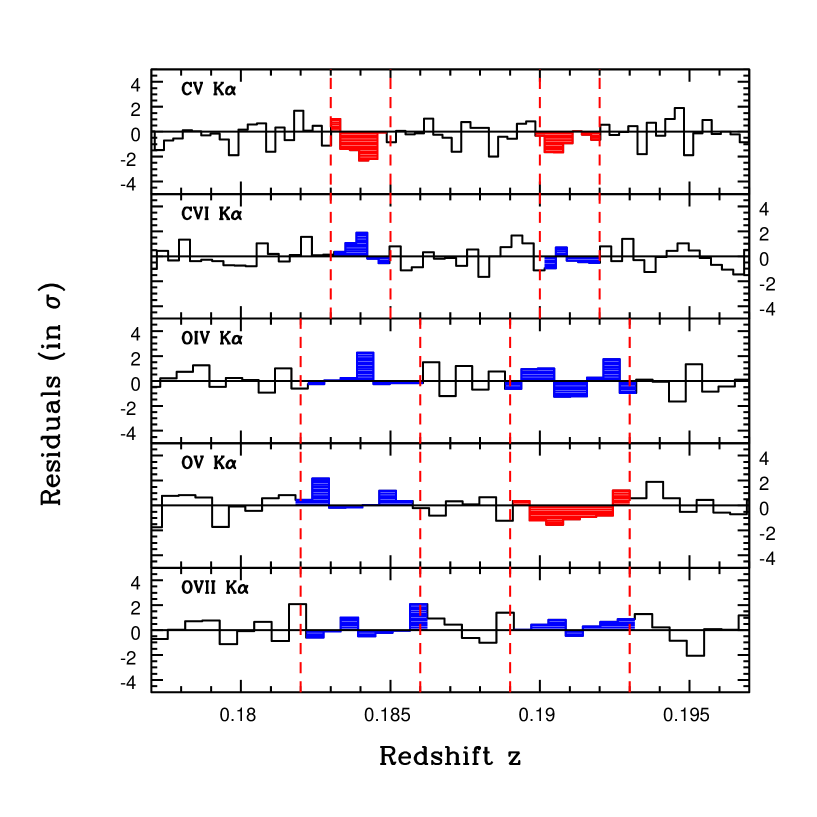
We thus speculate that these LETG lines at Å (3.6), Å(2.2) and Å (only 1.7), may be the high-ionization CV K ( and ) and OV K () counterparts (Table 1; Fig. 8, top panel, red bins) of the interesting, likely multi-phase, triple-HI-metal system detected in COS, possibly witnessing the on-going interplay between nearby galaxy outflows and a WHIM filament at , where a CV-OV-BLA system is present.
4.1.6 The WHIM System
Finally, the marginal detection at Å () can only be redshifted OV or higher. The OV K transition would be redshifted to . There is a NLA present in COS at , i.e. marginally consistent with the X-ray redshift. However, in photoionized gas OV shows fractional abundances similar to OVI. No OVI absorption is seen at this redshift either in the FUSE spectrum of 1ES 1553+113 or in its LETG spectrum. The OVI K transition would be redshifted to . No HI Ly or OVI is seen at a consistent redshifts in COS or FUSE. Finally, the OVII and OVIII K transitions, would be redshifted to and . These two redshifts are both consistent with either the broadest ( km s-1, corresponding to logT K) and strongest (EW(BLA) = mÅ) BLA detected in the published COS spectrum, at , or the redshift range of the unusual triple-HI-metal system at , respectively. However, while a possible double-CV counterpart to the triple-HI-metal system seen in COS is possibly detected in the LETG (§4.1.5), no OVII counterpart is detected. So, it appears unlikely that the line at Å is OVIII associated with the triple-HI-metal system.
For this marginal LETG detection we therefore favor the OVII-BLA association (Table 1, Columns 3-5; Fig. 1 magenta line), and tentatively identify this association with an intervening WHIM system at the COS-detected BLA signpost (though an OVIII-Triple-HI association cannot be ruled out). No other associated X-ray line is hinted in the data (Fig. 9).
We stress that this is the weakest system for which we propose an identification in association with a COS system (only one LETG line, at ). However, given the nature of this association (OVII-BLA), in principle probing the majority of the baryons in the WHIM, a confirmation of this putative OVII K detection at high statistical significance is highly desirable.
4.2 On the Statistical Significance of the X-ray Absorption Lines
The statistiscal significances of the X-ray absorption lines reported in Table 1 (second column), are single-line statistical significances. That is the ratio between the line flux, and its 1 lower-bound uncertainty. For those lines not identifiable with transitions imprinted by Galactic or circumgalactic gas, these significances over-estimate the true absorption-line statistical significances, because they derive from a number of redshift trials. This number of redshift trials, depends on the wavelength of the transition, the spectrometer resolution, and the available path length over which the blind search is performed: N, where is the rest frame wavelength of the given transition, and the spectrometer LSF FWHM. In our case, and mÅ. So, the number of independent LETG resolution elements is 173 for the OVII K and 322 for the CV K. In such conditions, the true statistical significance (i.e. after correcting for the unknown line position) of a line blindly detected at a “single-line” statistical significance of 4 is only 2.6 and 2.4, for OVII K and CV K respectively.
However, if an independent (and physically self-consistent) redshift prior is known (OVI or BLA in COS), then the line identification can be considered “secure” and therefore the single-line statistical significance provides a reliable estimate of the true statistical significance of the line. This is true for five out of the eight intervening lines: (a) the highest statistical significance CV and CVI lines, at redshift consistent with that of a strong BLA-OVI system with the right temperature to produce CV, (b) the CV line, at redshift consistent with that of a shallow BLA complex with the right temperature to produce CV; (c) the putative CV-OV lines, at redshifts consistent with that of a BLA at in COS, and (d) the speculative OVII absorber, at redshift consistent with that of a strong BLA whose thermal width is appropriate for the production of OVII.
The remaining three lines are identified as CV K at (close to the lower boundary of a rare triple HI-metal system detected in COS), and CV-CVI K at , a redshift consistent with that of a BLA whose column density, however, is probably too low to produce the entire CV and CVI absorption (given the relatively low temperature derived for this BLA). For the putative CV K line at , its single-line significance is 3.6, which corresponds to a probability of chance detection of 3.5. Allowing for the number of redshift trials, the probability of chance detection of this line rises to 0.056, a Gaussian-equivalent significance of 1.9. Fo the CV-CVI system at , the presence of two lines poses a bound on the number of redshift trials for the line detected at lower statistical significance and makes its measured single-line statistical significances close to the true statistical significances. These two lines are detected at single-line significances of 3.8 and , corresponding to probabilities of chance detections of 1.5 and , respectively. Allowing for the number of redshift trials, the probability of chance detection of the strongest of these two lines rises to 0.024, a Gaussian-equivalent significance of 2.3. However, considering this as a prior for the second line, the probability of having by chance both lines (independently) is the product of the two probabilities: P, corresponding to a Gaussian-equivalent significance of 3.8.
5 Conclusions
We report on the detection of six absorption lines and five additional features associated with either other X-ray lines detected at higher significance and/or Far-Ultraviolet (FUV) signposts, in the 500 ks Chandra-LETG spectrum of the bright (F mCrab) and distant () blazar 1ES 1553+113. The six detections have single-line statistical significances between , while the five additional associations are detected with single-line statistical significances of 2.2-2.8.
We tentatively identify these absorption lines as belonging to six different systems: the Galaxy cold ISM, and five intervening warm-hot IGM filaments.
Three out of the five intervening absorption systems show multiple-ion associations in the X-rays, have BLA (and OVI for the system at ) counterparts at consistent redshifts in the HST COS spectrum of 1ES 1553+113 and have true X-ray statistical significances of (; 6.3 if the low-significance OV and CV K associations are considered), () and 3.8 (). For these three systems, the COS counterparts are also physically consistent with the ionization degree and temperature of the X-ray absorbers in a shock-heated gas scenario. However, for the system, given the temperature implied by the BLA width, the HI column density is probably too low to produce all the detected CV and CVI absorption.
The two remaining proposed identifications are X-ray single-ion tentative detections (with the exception of the CV-BLA-OVI system, where OV may also be present), both with a possible, physically consistent, COS counterpart: (b) the double CV K system at (3.6) and (2.2, plus OV K, 1.7), both with HI (BLA-OVI for the putative CV-OV at ) counterparts, and (c) the possible OVII K absorber at (2.3) with a BLA counterpart.
Here we summarize our identifications:
-
•
Galactic ISM: We detect atomic OI (and possibly an excess of ISM oxygen in compound forms, over the instrumental molecular OI), as well as CII at and associate these absorbers with the cold ISM of our Galaxy along the line of sight to 1ES 1553+113.
-
•
Intervening System I: this is the highest significance LETG system, with two lines detected at single-line statistical significances of 4.1 each. We identify these two lines with CV and CVI absorption at , possibly imprinted by an intervening WHIM filament, as further suggested by our a-posteriori discovery of an associated strong BLA and OVI counterpart in the COS spectrum, with the right temperature (i.e. line Doppler parameters) and strength. Associated OV and CV K absoprtion are also possibly hinted by the X-ray data. The combined (in quadrature) statistical significance of this system in the LETG (CV and CV K lines only)is 5.8. If the association with OV K and CVI K is considered, the statistical significance of the system is 6.3).
-
•
Intervening System II: we identify CV absorption at , consistent with the redshift of a structured BLA complex that we discovered a posteriori in the currently avaiable COS spectrum of 1ES 1553+113. Given the presence of a physically self-consistent redshift prior (the BLA complex in COS), the true statistical significance of this line in the LETG is of 3.9.
-
•
Intervening System III: we identify a CV-CVI-BLA system at , and associate this absorber with an intervening warm WHIM filament, where only part of the X-ray absorption is physically related to the detected BLA. The statistical significance of this system in the LETG (after properly accounting for the number of redshift trials) is 3.8.
-
•
Tentative Intervening System IV: we identify 2 CV K absorbers at redshifts and , where also OV K is tentatively detected, adjacent to the redshifts of the extremes of a narrow redshift interval containing a rare triple-HI-metal absorption system. One of these three HI absorber is a BLA-OVI pair, with redshift and temperature fully consistent with that of the CV-OV absorber at . We speculate that the X-ray CV-OV absorbers trace the same multi-phase medium traced by the triple-HI-metal system in COS, possibly representing the result of the interplay between galaxy winds and a WHIM filament at . The CV line at is detected at single-line statistical significance of 3.6 (a true statistical significance of only 1.9, after allowing for the number of redshift trials), while the CV-BLA-OVI system at is detected at a true significane of and 2.2 (2.8 if the OV K association is considered).
-
•
Tentative Intervening System V: we tentatively identify an OVII-BLA system at and associate this absorber with an intervening hot WHIM filament. This is the weakest system for which we report a possible identification, with only one X-ray line at a single-line statistical significance of 2.3, but with a possible redshift prior identified in the broadest and strongest BLA reported in the published COS spectrum.
This moderate quality 500 ks Chandra-LETG spectrum of the, by far, brightest steady soft X-ray target in the sky, strongly hints at the existence of possible X-ray metal WHIM counterparts to genuine gaseous signposts, previously secured with the HST-COS (or viceversa), and so demonstrates the efficiency of this observational strategy and the power of the X-ray-FUV synergy for WHIM studies. Moreover, these results suggest that the gas may be often found to be multiphase, possibly indicating that the IGM structure is richer than typically found in hydrodynamical simulations. Longer integrations with both the high resolution soft X-ray spectrometers available (the Chandra-LETG and the XMM-Newton-RGSs) are needed to confirm at high statistical significances and with two indipendent measurements these tentative identifications and associations (especially for the three lowest statistical-significance associations), and to conduct a sensitive exploration of even hotter WHIM systems along this line of sight.
6 Acknowledgements
We thank Ehud Behar for providing wavelength, oscillator strengths and transition probabilities of inner shell transitions of C, O and Ne. FN acknowledges support from CXO grant GO1-12174X, and from INAF-ASI ADAE grant 1.05.04.13.15. MS and CD acknowledge support from COS grant NNX08AC14G to the University of Colorado, from NASA. XB acknowledges support by the Spanish Ministry of Economy and Competitiveness through grant AYA2010-21490-C02-01.
References
- (1) Asplund, M., Grevesse, N., Sauval, A.J., Scott, P., 2009, ARA&A, 47, 481
- (2) Bar-Shalom, A., Klapish, M. & Oreg, J., JQSRT, 71, 169
- (3) Behar, E. & Netzer, H., 2002, ApJ, 570, 165
- (4) Bennett, C.L. et al., 2003, ApJS, 148, 1
- (5) Bertone S., Schaye J., Dalla Vecchia C., Booth C. M., Theuns T., Wiersma R. P. C., 2010, MNRAS, 407, 544
- (6) Branchini, E., et al., 2009, ApJ, 697, 328
- (7) Brinkman, A.C., et al., 2000, ApJ, 530, L111B
- (8) Buote, D.A., Zappacosta, L., Fang, T., Humphrey, P.J., Gastaldello, F., Tagliaferri, G., 2009, ApJ, 695, 1351
- (9) Cen, R. & Ostriker, J.P., 2006, ApJ, 650, 560
- (10) Cen, R. & Fang, T., 2006, ApJ, 650, 573
- (11) Danforth, C.W. et al., 2011, ApJ, 743, 18
- (12) Danforth, C.W. et al., 2010, ApJ, 720, 976
- (13) Danforth, C.W., Stocke, J.T. & Shull, J.M., 2010, ApJ, 720, 976
- (14) Danforth, C.W. & Shull, J.M., 2008, ApJ, 679, 194
- (15) Fang, t. et al., 2010, ApJ, 714, 1715
- (16) Fang, T., Canizares, C.R., & Yao, Y., 2007, ApJ, 670, 992
- (17) Gupta, A. et al., 2012, ApJ, 756, L8
- (18) den Herder, J.W. et al., 2001, A&A 365, L7
- (19) Juett, A.M., Schulz, N.S. & Chakrabarty, D., 2004, ApJ, 612, 308
- (20) Kaastra, j.S. et al., 2011, A&A, 534, 37
- (21) Kaastra, J.S., Werner, N., den Herder, J.W.A., Paerels, F.B.S., de Plaa, J., Rasmussen, A.P., de Vries, C.P., 2006, ApJ, 652, 189
- (22) Kalberla, P.M.W. et al., 2005, A&A, 440, 775
- (23) Keshet, U., Kushnir, D., Loeb, A., Waman, E., 2012, arXiv:1210.1574
- (24) Kirkman, D. et al., 2003, ApJS, 149, 1
- (25) Mathur, S., Weinberg, D.H. & Chen, X., 2003, ApJ, 582, 82
- (26) Nicastro, F. et al., 2010, ApJ, 715, 854
- (27) Nicastro, F., Mathur, S. & Elvis, M., 2008, Science, 319, 55
- (28) Nicastro, F. et al., 2005a, Nature, 433, 495
- (29) Nicastro, F. et al., 2005b, ApJ, 629, 700
- (30) Nicastro, F. et al., 2002, ApJ, 573, 157
- (31) Murray, S.S. & Chappell, J.H., 1995, SPIE, 597, 274
- (32) Rasmussen, A.P., Kahn, S.M., Paerels, F., den Herder, J.W., Kaastra, J., de Vries, C., 2007, ApJ, 656, 129
- (33) Rauch, M., 1998, ARA&A, 36, 267
- (34) Schulz, N.S., Juett, A., Chakrabarty, D., Canizares, C.R., 2003, AN, 324, 166
- (35) Shull, J.M., Smith, B.D., Danforth, C.W., 2012, ApJ, 759, 23
- (36) Smith, B. D, Hallman E. J., Shull J. M., O’Shea B. W., 2011, ApJ, 731, 6
- (37) Spergel, D.N. et al., 2007, ApJS, 170, 377
- (38) Takei, Y., Fujimoto, R. & Mitsuda, K., 2002, ApJ, 581, 307
- (39) Tornatore L., Borgani S., Viel M., Springel V., 2010, MNRAS, 402, 1911
- (40) Treves, A., Falomo, R. & Uslenghi, M., 2007, A&A, 473, L17
- (41) Verner, D.A., Verner, E.M. & Ferland, G.J., 1996, Atom.Ph, 4003
- (42) Weinberg, D.H., 1997, ApJ, 490, 564
- (43) Williams, R.J., Mathur, S., Nicastro, F., Elvis, M., 2006, ApJ, 624, L95
- (44) Williams, R.J, Mulchaey, J.S., Kollmeier, J.A. & Cox, T.J., 2010, ApJ, 724, L25
- (45) Yao, Y., Shull, J.M.,, Wang, Q.D., Cash, W., 2012, ApJ, 746, 166
- (46) Yoshikawa, K. et al., 2003, PASJ, 55, 879
- (47) Zappacosta, L., Nicastro, F., Krongold, Y., Maiolini, R., 2012, ApJ, 753, 137
- (48) Zappacosta, L. et al., 2010, ApJ, 717, 74
- (49)