Gene Regulation by Riboswitches with and without Negative Feedback Loop
Abstract
Riboswitches, structured elements in the untranslated regions of messenger RNAs, regulate gene expression by binding specific metabolities. We introduce a kinetic network model that describes the functions of riboswitches at the systems level. Using experimental data for flavin mononucleotide riboswitch as a guide we show that efficient function, implying a large dynamic range without compromising the requirement to suppress transcription, is determined by a balance between the transcription speed, the folding and unfolding rates of the aptamer, and the binding rates of the metabolite. We also investigated the effect of negative feedback accounting for binding to metabolites, which are themselves the products of genes that are being regulated. For a range of transcription rates negative feedback suppresses gene expression by nearly 10 fold. Negative feedback speeds the gene expression response time, and suppresses the change of steady state protein concentration by half relative to that without feedback, when there is a modest spike in DNA concentration. A dynamic phase diagram expressed in terms of transcription speed, folding rates, and metabolite binding rates predicts different scenarios in riboswitch-mediated transcription regulation.
Introduction
Riboswitches are cis-acting RNA elements located in the untranslated region of mRNAs that regulate associated gene expression by sensing and binding target cellular metabolites Winkler and Breaker (2005); Cheah et al. (2007); Montange and Batey (2008). In bacteria, binding of metabolites to the conserved aptamer domain allosterically alters the folding patterns of the downstream expression platform, whose conformation controls transcription termination or translation initiation Montange and Batey (2008); Batey et al. (2004); Serganov et al. (2004). The target metabolites are usually the products or their derivatives of the downstream gene that riboswitches control. Hence, metabolite binding to riboswitches serves as a feedback signal to control RNA transcription or translation initiation. The feedback through metabolite binding is naturally designed to be a fundamental network motif for riboswitches. For example, tandem riboswitches respond to multiple metabolites to control a single gene with greater regulatory complexity Sudarsan et al. (2006); Breaker (2008), while single glmS riboswitch has been shown to respond to multiple signals using both negative and positive feedback Watson and Fedor (2011). Understanding the various in vivo riboswitch functions requires a theoretical framework that takes into account the interplay between speed of RNA transcription, folding kinetics of the nascent RNA transcript, and kinetics of metabolite binding to the nascent RNA transcript, and the role of feedback arising from interactions between synthesized metabolities and the transcript. The effects of speed of RNA transcription and metabolite binding kinetics have been examined in vitro in an insightful study involving the flavin mononucleotide (FMN) riboswitches Wickiser et al. (2005). They argued that FMN riboswitch is kinetically driven implying that the riboswitch does not reach thermodynamic equilibrium with FMN before a decision between continued transcription and transcription termination needs to be made.
The regulatory roles played by riboswitches have also inspired design of novel RNA-based gene-control elements that respond to small molecules Link and Breaker (2009); Carothers et al. (2011). Several models have been proposed to describe how riboswitches function and meet their regulatory demands Beisel and Smolke (2009); Chen and Ellington (2009). However, they focused solely on the transcription process without accounting for the feedback effect from the metabolite produced by the gene encoding the riboswitch. Here, we introduce a general kinetic network model that can be used to describe both in vivo and in vitro functions of riboswitches. Our coarse-grained kinetic network model, which takes into account the interplay of co-transcriptional folding, speed of transcription, and kinetics of metabolite binding, also models effects of negative feedback loop so that predictions for in vivo functions of riboswitches can be made. As an illustration of the theory, we first consider the dependence of metabolite concentration on the regulation of in vitro transcription termination of FMN riboswitches without feedback loop, which enables us to obtain the range of folding rates and transcription rates that produce results consistent with experiments Wickiser et al. (2005). We then include the negative feedback loop in the network to study how riboswitches regulate gene expression at the systems level.
General Kinetic Model
The riboswitch is transcribed from the leader, the non-protein-coding region, of the associated gene (Fig. 1). We simplify the multiple complex in vitro biochemical steps in the function of the off riboswitch, involving transcription, co-transcriptional RNA folding and metabolite binding, to a few key kinetic steps (Fig. 1). Without feedback, the first stage is the transcription of the aptamer domain (). The antiterminator sequence is transcribed () in the second step. At each stage, the aptamer domain of the RNA transcript can either co-transcriptionally fold or unfold. Only when the aptamer domain is folded (, ) can the RNA transcript bind the metabolite (). At the second stage, when the aptamer domain is unfolded, the RNA transcript is in an alternative folding pattern with the formation of antiterminator stem (). The final stage of the transcription occurs when the terminator sequence is transcribed (). If the terminator sequence is transcribed following , the antiterminator structure prevents the formation of terminator stem and the transcription proceeds till the downstream coding region is fully transcribed (). If the terminator sequence is transcribed following or , the absence of antiterminator allows the terminator to form, which subsequently leads to the dissociation of RNA transcript ( and ) from the DNA template and terminates the transcription. The feedback effect involved with translation and metabolite synthesis will be discussed in later sections.
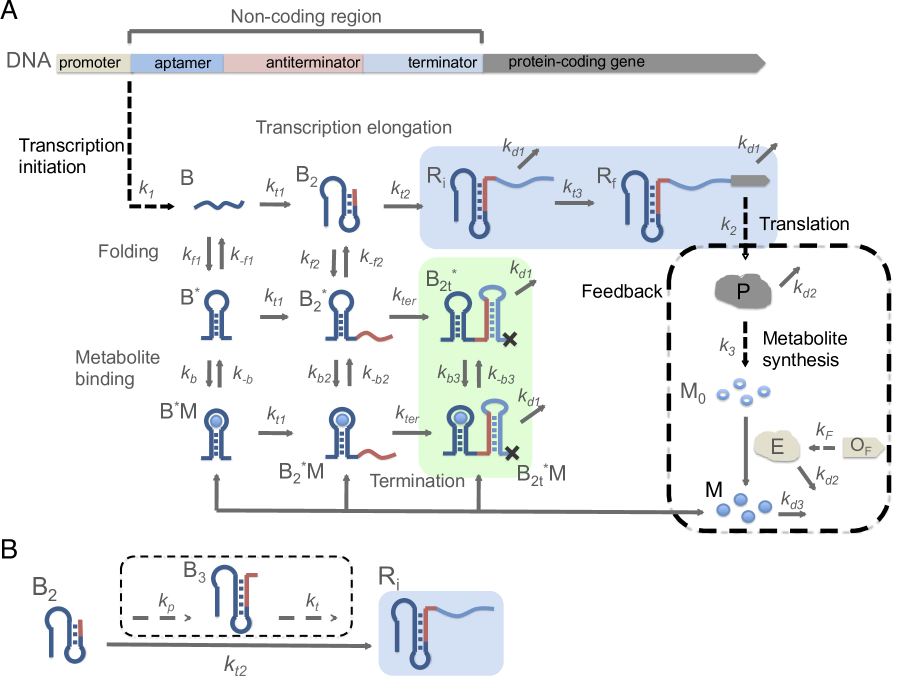
To assess how the metabolite concentration, , regulates transcription termination, we computed the fraction of terminated transcript, , given an initial concentration of RNA transcript with aptamer sequence transcribed (). Some of the rate constants can be estimated from the in vitro experiments Wickiser et al. (2005) for FMN riboswitches, which we use to illustrate the efficacy of the theory. The experimental values of the FMN association rate constant for the FMN aptamer is M-1s-1, and the dissociation rate constant is s-1, giving the equilibrium nM. RNA polymerases (RNAP) pause at certain transcription sites during transcription. There are two pause sites for the FMN riboswitch, one after the aptamer domain sequence with a lifetime of the paused complex being about 10 s, and the other at the end of the antiterminator sequence with a lifetime min. To approximately account for the pause times in our simplified model, we observe that represents the transcript of the FMN riboswitch with part of the antiterminator out of RNAP, when RNAP pauses at the second pause site. Even with only part of the antiterminator sequence, the transcript still has high probability of forming alternate folding patterns Wickiser et al. (2005), similar to a full antiterminator sequence. Hence, we set the effective transcription rates s-1 and s-1, which reflects the pause times for the FMN ribsowtich (see Fig. 1B for additional explanation for this approximation).
Extraction of minimal set of parameters from in vitro transcription experiments
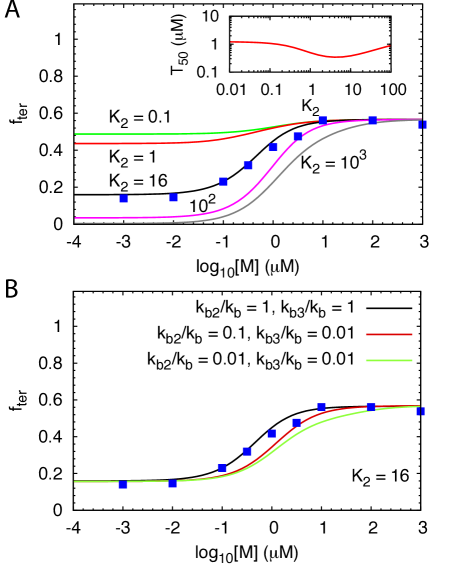
To make testable predictions using our model, we need estimates of the co-transcriptional folding and unfolding rates of the aptamer as well as , the aptamer with the antiterminator sequence. The kinetic model described mathematically in the Supplementary Information (SI) can be used to extract parameters that most closely fit the measured dependence on for the FMN riboswitch Wickiser et al. (2005). When the aptamer sequence is transcribed, the transcript favors the aptamer-folded state, and when the antiterminator sequence is transcribed, the folding pattern changes in favor of forming the antiterminator stem with disruption of the aptamer folded structure Wickiser et al. (2005). Thus, there are restraints on the folding rates, and . We also assume the same association (dissociation) rate constant for metabolite binding to , , and because there is little change in the results when the values of and are drastically altered. In addition, because we only allow the folded states of the aptamer to bind the effective is a convolution of the folding rates and the binding rate. Thus, even though is the same the decrease in the folding rate as the transcript length increases effectively decreases . The values of the transitions rates that reproduce the measured (blue squares in Fig. 2) are listed in Table I. The folding rates and are within an order of magnitude of the theoretical prediction based on, , s-1, where is the number of nucleotides Thirumalai (1995); Hyeon and Thirumalai (2012). Moreover, the rate we obtained is in the same order of magnitude of the folding rate of other riboswitch aptamer with similar lengths observed in experiments Perdrizet et al. (2012). Thus, for the purposes of quantitatively describing the in vitro experiments we need only two kinetic rates ( and ).
| 111In unit of s-1 for all rates except . | 222Values from experimental data Wickiser et al. (2005). | 222Values from experimental data Wickiser et al. (2005). | 222Values from experimental data Wickiser et al. (2005).,c | 222Values from experimental data Wickiser et al. (2005). | |||
|---|---|---|---|---|---|---|---|
| 0.1 | 0.04 | 2.5 | 0.04 | 0.1 | 0.016 | 0.1 |
The folding rate of the aptamer is comparable to (Fig. 1). The transition rate () from (Fig. 1) to is 2-3 times the rate of transcription enlongation to the stage where terminator sequence is transcribed (). Since the results are not sensitive to , if the other rates are fixed, we choose because both involve unfolding of the folded aptamer structure. With this assumption, the parameter set that emerge when our model is used to quantitatively describe (see Fig. 2) the in vitro kinetic experiments is unique. In addition, under these conditions, the regulation of transcription termination works when is in large excess over RNA transcript, when . With for metabolite concentration and , the binding time is of 10 s, which is of the same order of magnitude as the transcription elongation rate and the folding rate of the antiterminator stem. Consequently, the metabolite binding is unlikely to reach equilibrium before formation of the antiterminator stem. Large excess of metabolite, exceeding the equilibrium ( nM) for FMN binding to , over RNA transcript is needed for the metabolites to bind the riboswitches with sufficient speed to regulate transcription under the conditions explored in experiments Wickiser et al. (2005).
Results
Dependence of on
We investigated how depends on variations in the transition rates around the parameter set listed in Table I. Figure 2 shows that the fraction of terminated transcripts converges to the same value in the limit of high metabolite concentration, independent of , while keeping the other paramters fixed. At high , and are always metabolite bound, which results in very low . Hence, varying does not affect at high . In the limit of low , decreases as increases because exceeds the effective binding rate so that is preferentially populated.
The effective metabolite concentration , at which
| (1) |
where is the value of at high (low) , does not change much as is varied (see the inset in Fig. 2). Even when is small implying the concentration of is in excess of the equilibrium to effect binding to . Since the population of is favored as increases it follows that decreases at all concentrations of the metabolite as is changed from a low to a high value (Fig. 2). In addition, the transcription rate from (or ) to the next stage where terminator sequence forms () is about one order of magnitude larger than , which means that at low or normal metabolite concentration, transitions between and states do not reach equilibrium before the terminator sequence is transcribed - a result that also follows from the inequality . Finally, the dissociation rate constant is much smaller than , which indicates that once the metabolite is bound, the bound state remains stable through transcription termination. Hence, the riboswitch is in the kinetically driven regime with the parameters used here - a conclusion that was reached in the previous study Wickiser et al. (2005).
Dynamic Range and Thermodynamic Control
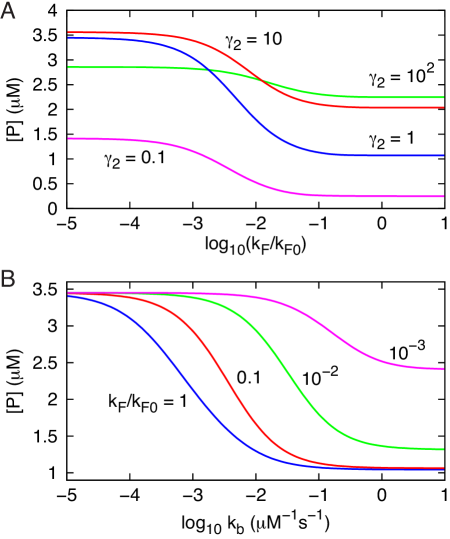
Thermodynamic equilibrium between and can be reached only if the transcription speed is much slower than the transition rates between different folding patterns and the association rate with metabolites (Fig. 1). We varied the transcription speed to probe how the riboswitch can be driven from kinetic to thermodynamic control, which can be experimentally realized by increasing the pausing time, achievable by adding transcription factors, such as NusA. The dependence of on at various values shows that, in the limit of low metabolite concentration, is roughly equal to the fraction of folded aptamer . At high metabolite concentrations, almost all riboswitches are metabolite bound, and transcription is terminated with high probability (Fig. 3A). As increases, the system transitons to a kinetically driven regime and the probability that the transcription is terminated at high decreases, while the fraction of terminated transcript at low increases.
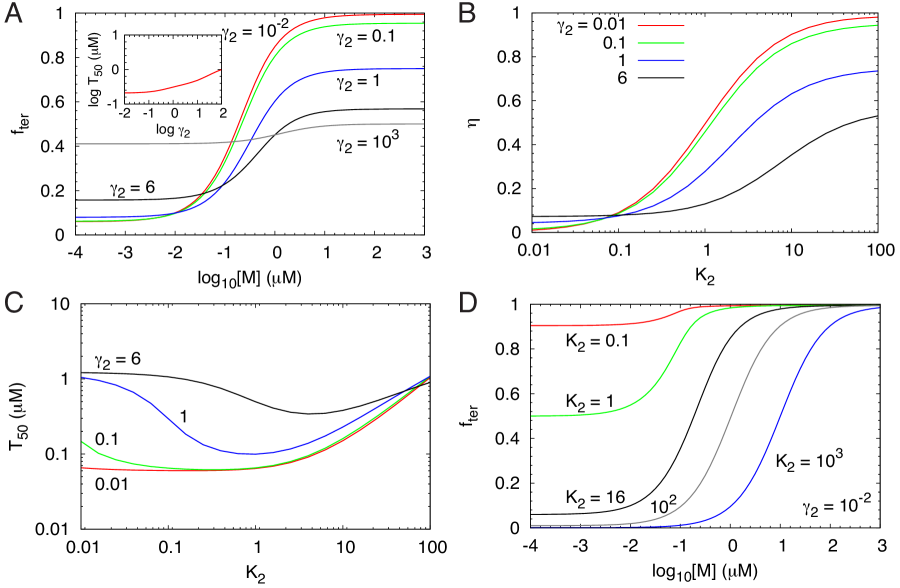
Interestingly, at high we find that decreases as increases because in this limit the folded has insufficient time to make a transition to . As a result the population of decreases at high resulting in a reduction in (Fig. 3A). Surprisingly, the exact opposite result is obtained at low as is varied. At low and small the binding rate is small enough that the transition to occurs with high probability resulting in a decrease in . As increases the flux from to decreases, and the pathway to from becomes relevant leading to an increase in at low (Fig. 3A). Thus, at high and low the extent of transcription termination is controlled by and . The value of increases substantially relative to as increases (see the inset in Fig. 3A). Even when is very small exceeds implying that it is difficult to drive the FMN riboswitch to thermodynamic control under the conditions used in experiments Wickiser et al. (2005).
Figure 3B shows the dynamic range as a function of for different values of . The riboswitch functions with maximal dynamic range when the system is nearly under thermodynamic control corresponding to small values. The range of is between 0.1 () and 1 () for (Fig. 2C). When the unfolding rate of the aptamer folded structure () is comparable to the speed of transcription to the terminator sequence, , has the smallest value. The minimum decreases as decreases, and becomes less dependent on when . When , as shown in Fig. 3D, the probability of transcription termination approaches unity in the limit of high metabolite concentration at all values of . On the other hand, in the limit of low metabolite concentration ( is small), increases and decreases as decreases. The results in Fig. 3 show that the efficiency of the riboswitch function is determined by a compromise between the need to maximize ( should be small) and the ability to terminate transcription ( should be large).
Effect of aptamer folding rates on
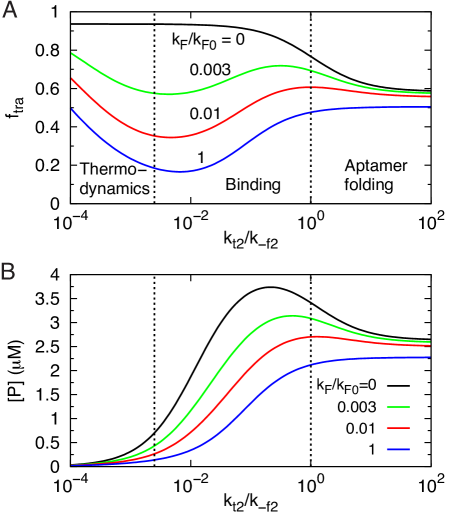
In the kinetically driven regime (), the probability of transcription termination depends on the fraction of the aptamer-formed state before transcription of the antiterminator sequence. This fraction can be changed by altering , or equivalently the ratio , or by varying the transcription speed from the aptamer domain sequence to antiterminator sequence, . When , most of the riboswitches do not form stable folded aptamer domain (Fig. 1), resulting in very small fraction of transcription termination and low response to changes in the metabolite concentration. As the transition rate from the unfolded state () to the aptamer-folded state () increases relative to the reverse transition rate, the fraction of terminated transcripts and dynamic range increases (Fig. 4A). In the limit of high , the probability of transcription termination approaches 1 when , while in the low limit, almost all the riboswitches are aptamer folded but without metabolite bound () before transcription to antiterminator sequence. Just as in Fig. 2, is not sensitive to changes in (see inset in Fig. 4A).
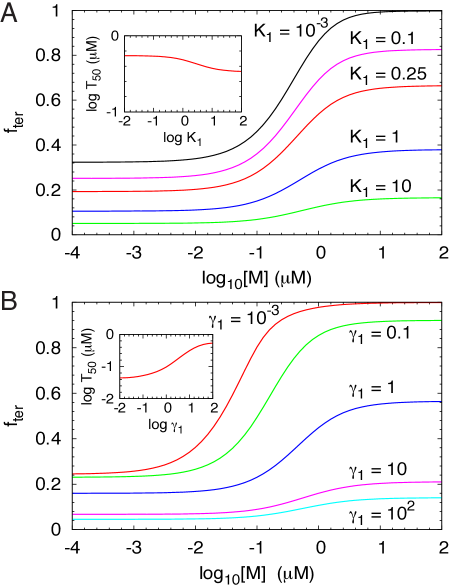
Figure 4B shows the concentration dependence of the fraction of terminated transcripts for different transcription rates to the antiterminator sequence, or the ratio . When the transcription rate is much faster than the folding rate, the riboswitch does not have enough time to form the aptamer-folded structure, which results in low fraction of terminated transcripts and low response to metabolite concentration change. When transcription rate is much slower than folding rate, the folded and unfolded states of the aptamer are able to reach equilibrium before transcription to antiterminator sequence. In the high metabolite concentration limit, the riboswitch is always metabolite bound resulting in transcription termination. At low , the riboswitch does not bind the metabolite. The fraction of aptamer formed state without bound metabolite is before transcription to the antiterminator sequence. There is substantial variation in as changes as the inset in Fig. 4B shows. Thus, besides the speed of transcription and the binding rates, the folding rates of the aptamers have considerable influence on (compare insets in Fig. 3A and Fig. 4B).
| 111In unit of s-1 for all rates. | 222Ref.McAdams and Arkin (1997) | 333In unit of M-1s-1. | 444Ref.Bernstein et al. (2002) | 555Ref.Belle et al. (2006) | 666See SI. | ||
|---|---|---|---|---|---|---|---|
| 0.01 | 0.016 | 0.3 | 0.064 |
Transcription with negative feedback loop
Most riboswitches regulate gene expression of the downstream platform that encodes for proteins involved in the production of the specific metabolite that itself binds to the riboswitch (Fig. 1). Therefore, sensing and binding of its own metabolite by the riboswitch acts as a feedback to control gene expression. For riboswitches that suppress gene expression by binding to metabolites with high selectivity (for example, guanine riboswitches or FMN riboswitches) such feedback loop is an example of negative autoregulation, which has been widely studied in gene regulation networks associated with transcription factors Alon (2007). We include the role negative feedback plays in regulating transcription termination by generalizing the in vitro kinetic model considered in the previous section. Our minimal model, illustrated in Fig. 1 and described in detail in the SI, provides a framework for interpreting future in vivo experiments.
We consider transcription and translation in a cell and take into account RNA degradation and cell expansion. The transcription process is similar to that described without feedback loop, except now we include the effect of cell expansion and RNA degradation. We assume that the cell grows at a rate of s-1, resulting in a typical doubling time of ln minutes for an E. coli cell, and that the degradation rate of the fully transcribed RNA or terminated RNA transcript is . The values of , and other parameters in the feedback loop are in Table II. The fully transcribed RNA serves as a template for the translation of the protein () that synthesizes metabolite , which is then converted to an active form by the enzyme encoded by the gene (Fig. 1). The species , with a degradation rate of , is the target metabolite that binds to the riboswitch.
In the case of FMN riboswitches, represents riboflavin, the eventual product encoded by the gene ribD (), that is subsequently converted to FMN by flavokinase (), synthesized by the gene ribC (). The degradation rate takes into account the effect of conversion from FMN to FAD (flavin adenine dinucleotide) by FAD synthetase in vivo (see SI for more details). However, we neglect the potential binding of FAD to the riboswitch because there is a 60 fold difference (or potentially even larger factor in the absence of FMN) in the binding of FMN and FAD to the FMN riboswitch Winkler et al. (2002). In the model with negative feedback the extent of regulation by riboswitches is expressed in terms of the production of the protein (Fig. 1).
We assume that the activated level of the operon, , for transcription initiation of the riboswitch is a constant, and set nM, which is equivalent to one DNA molecule in an E. coli cell, and assume that the aptamer sequence, , is produced with an effective rate constant s1, taking into account the transcription initiation rate ( s between initiation events; Larson et al. (2011); Iyer and Struhl (1996)) and the typical transcription speed, nucleotides per second Uptain et al. (1997). With these parameters fixed, which are used for illustrative purposes only, we can study the effect of feedback by varying the effective rate , at which is produced from OF. We set . If is produced at a rate similar to that of protein without feedback, then s-1, which we set as a reference rate (see SI for details). At this rate, the steady state level of enzyme E is copies per cell. The variation of rate can result from delays or speed up in the process of the transcription from or translation of E, or even deficiency in .
Dependence of on enzyme production and metabolite binding rates
We assess the extent of regulation due to feedback by the changes in the protein level expression, , as the parameters in the network are varied. The results in Fig. 5A show that when is low, very few active metabolites are formed to suppress protein expression. Consequently, the expression level of protein does not change at low at all values of (Fig. 5A). This finding explains the observation that deficiency in ribC ( in Fig. 1), the gene that encodes for flavokinase (E in Fig. 1), causes accumulation of riboflavin ( in Fig. 1) without converting it to FMN, and thus cannot suppress the synthesis of riboflavin Gusarov et al. (1997); Mack et al. (1998). When increases to about , the expression of the protein starts to be suppressed. There is a substantial suppression of protein concentration (Fig. 5A) at all values when . As exceeds , the suppression begins to saturate (Fig. 5A) because most of produced are converted to , and the level is essentially determined by the production of , which is independent of . Thus, at all values, level varies between two steady state values as is changed.
In contrast to the results in Fig. 5A, the extent of regulation ( levels) varies greatly with binding rate constant of metabolites while keeping fixed at 10 nM (Fig. 5B). Changes in as is varied, which affect synthesis of (Fig. 1), depend on . When , most of the aptamer folded structures are metabolite bound at experimental value of M-1s-1, and hence the level of protein expression is suppressed. Therefore, with copies of enzyme in a cell, the production of decreases substantially even if the binding rate constant is small. Binding occurs because the concentration of active metabolites ( M) is far larger than RNA transcripts ( nM), resulting in a high effective binding rate . The ability to suppress protein production decreases if the binding rate constant is smaller than the experimental value by more than one order of magnitude, or when the value of decreases. Not surprisingly, when is very low, the dependence of binding rate on expression of decreases. As a consequence the changes in production decreases greatly as decreases (Fig. 5B). Thus, only over a small range of and does the riboswitch function with sufficient dynamic range.
Interplay between co-transcriptional folding and transcription speed
The dependence of transcription rate on the extent of regulation, shown in Fig. 6, exhibits three distinct functional modality depending on the value of relative to . First, consider the case with (black line in Fig. 6A). If , the fraction of fully transcribed RNA (Fig. 6A), , becomes
| (2) |
where is the sum of concentration of the fully transcribed and terminated RNA transcripts, and . In this limit, depends predominantly on the folding transition rate before the antiterminator sequence () is transcribed (Fig. 1). Hence, is a function of , , and the rate of cell expansion. When decreases, co-transcriptional folding results in the formation of the antiterminator stem, which prevents transcription termination. If and , then
| (3) |
where . In this limit, and (Fig. 1) are in equilibrium. These results are the same as those in the limit of low metabolite concentration without the feedback loop (Fig. 3A).
For finite , when is fast relative to the expression level of protein is nearly independent of (Fig. 6B). In this regime transcription termination and hence the extent of completed transcription is determined by the folding rates of the aptamer, which is not greatly affected by negative feedback. When the transcription speed decreases, the expression of protein increases for small (Fig. 6B). The expression level of reaches a peak when , and it disappears when because the metabolite binding becomes significant enough to stabilize the folded aptamer structure and offset the effect of formation of the antiterminator stem. This is illustrated in Fig. 6A, which shows that decreases significantly when goes below and reaches a minimum at . The dependence of on is maximal when . When the transcription rate decreases further (, or as shown by the left dashed line in Fig. 6A), the fraction of fully transcribed RNA increases sharply because the transcription rate is slow enough for the dissociation of metabolites from riboswitches to occur significantly. The system can establish thermodynamic equilibrium, which increases the favorability of the formation of antiterminator stem when decreases resulting in decreasing effective binding rate . However, the overall expression level of protein becomes very low because slow transcription results in a decrease in production. In addition, there is also significant probability of RNA degradation, which also results in a decrease in expression. Therefore, the extent of regulation due to the negative feedback of metabolite binding has a maximal effect when where the protein expression is suppressed by metabolite binding by as large as 85%.
Dynamic phase diagram: Competition between folding, transcription, and binding rates
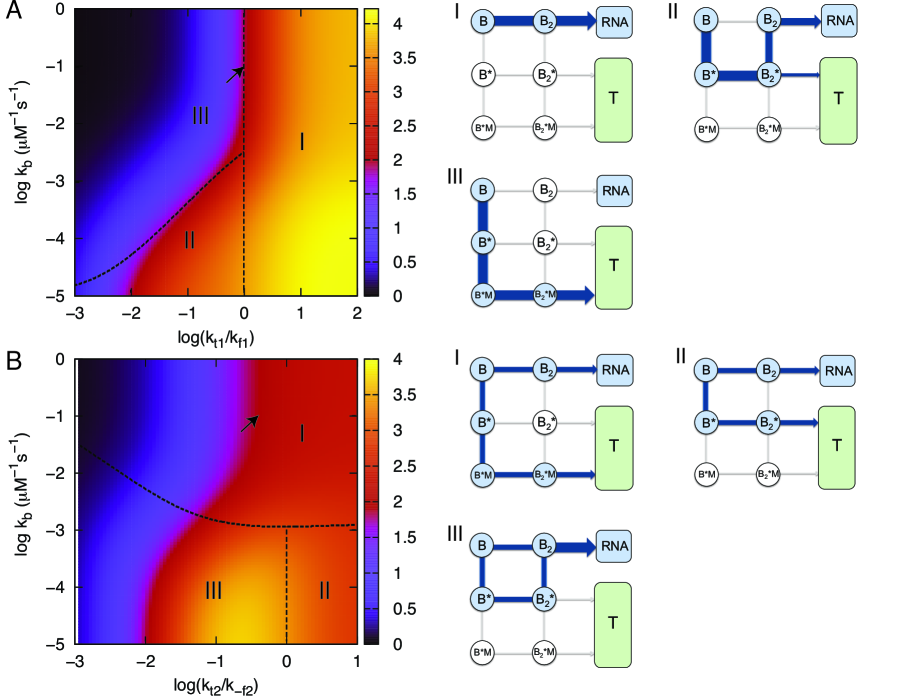
To have a more complete picture on how the interplay between folding of RNA transcripts, transcription, and metabolite binding regulate the expression of , we study the dependence of on the transcription rates and the effective binding rate . The dynamic phase diagram in Fig. 7 is calculated by varying both () and with nM. In the first stage of transcription elongation, i.e. after the aptamer sequence is transcribed, the formation of the aptamer structure is the key step in regulating transcription termination. Thus, the folding rate and the effective metabolite binding rate are the key rates in competition with for regulation of . Figure 7A shows three regimes for the dependence of on and . In regime I, , the folding rate is slow relative to transcription to the next stage (Fig. 1). Thus, the aptamer structure does not have enough time to form. The dominant flux is from to , which leads to high probability of fully transcribed RNA downstream because of the low transition rate from to . The metabolite binding has little effect on protein expression in this regime, particularly for large , and hence the protein is highly expressed. In regime II, , the aptamer has enough time to fold but the metabolite binding is slow. The dominant flux is , leading to formation of antitermination stem () or transcription termination (). The expression level of protein is thus mainly determined by and , and the protein production is partially suppressed in this regime. In regime III, and , the aptamer has sufficient time to both fold and bind metabolite, the dominant pathway is , leading to transcription termination. The protein production is highly suppressed in this regime. The results using parameters from Table I and Table II ( and ) fall on the interface of regime I and regime III, as shown by the arrow in Fig. 7A. The metabolite binding does not reach thermodynamic equilibrium due to low dissociation constant. However, the effective binding rate is high because the steady state concentration of metabolites ( M) is in large excess over RNA transcripts. Thus, the riboswitch is kinetically driven under this condition even when feedback is included.
With comparable to , at the second stage of transcription elongation the key step against transcription termination is the formation of the antiterminator stem (). Figure 7B also shows three regimes for the dependence of on and relative to , and the associated most probable pathways are displayed on the right. In regime I, , the effective binding rate competes favorably with transition so that , if populated, is not likely to form the antiterminator stem. However, in this regime, the effective binding rate is also likely to be larger than , resulting in most of the metabolite binding occurring at the first stage of transcription. Protein production is partially suppressed with the flux towards transcription termination flowing through (terminated transcript). In regime II, , both the metabolite binding and transition are too slow to occur. The protein production level is mainly determined by and . The major pathways are and , leading to partial protein suppression. In regime III, and , metabolite binding is too slow to occur, but the riboswitch has enough time to form the antiterminator stem before the terminator sequence is transcribed. The major flux from flows to , leading to fully transcribed RNA, and proteins are highly expressed. We note that using the parameters from Table I and Table II ( and ), the result falls in regime I with partial protein suppresion. Among the three regimes, regime I has efficient negative feedback, while the slow metabolite binding in regime II and regime III makes results resemble to those without feedback. The dynamic phase diagrams predicts results with limiting cases of various parameters, whose values may be within range in vivo and most certainly in vitro.
Role of feedback in response to DNA bursts
To assess how feedback affects the response to a sudden burst in DNA concentration we calculated the time dependent changes in the protein concentration,
| (4) |
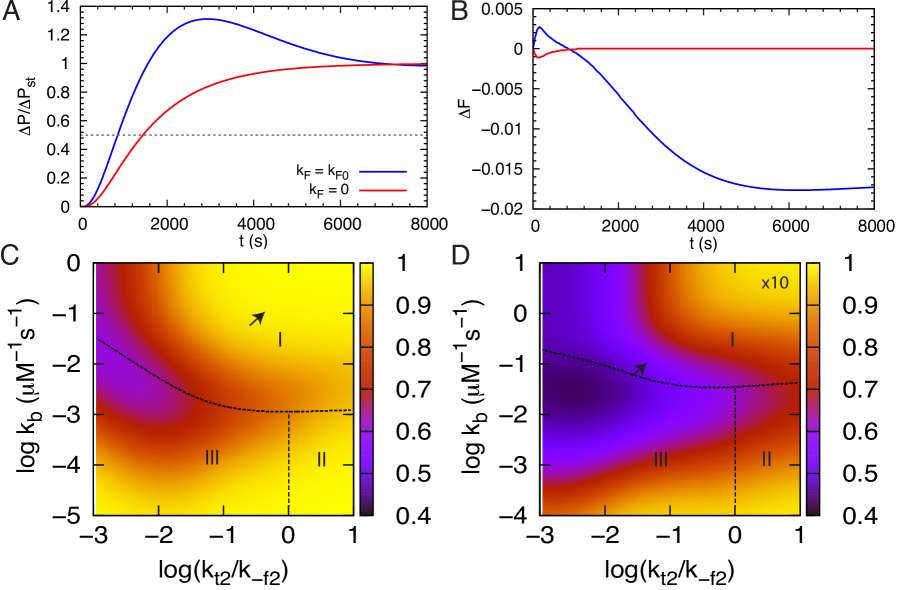
when the DNA concentration is switched from to . In Eq. (4) stands for steady state. Fig 8A shows the response time, defined as the time needed to reach half-way to the new steady-state level (dashed line in Fig. 8A), for = 3.75 nM and = 2.5 nM using folding and unfolding rates one order of magnitude larger than those in Table I. Small transient fluctuations in DNA concentration could arise from environmental stresses, and hence it is interesting to examine the response of the network to such changes. The values of the folding rates from Table I results in little difference in response time between cases with negative feedback and without feedback. However, with larger folding rates, the response time for the systems with negative feedback is significantly shorter than without feedback (Fig. 8A). The fractional change of the fully transcribed RNA, (Fig. 8B), shows a slight increase with overshoot initially before settling into a steady state level lower than the original one in the case of negative feedback (blue line in Fig. 8B). For the case without feedback, the fraction of fully transcribed RNA decreases initially before reaching the expected steady state level (red line in Fig. 8B).
With negative feedback and 10-fold increase in overall folding and unfolding rates, the fractional increase in the protein steady state level, , in response to the increase in DNA level, , is reduced by more than half of that in the case without feedback for certain range of parameters, as shown in Fig. 8C and 8D. Without feedback, . Negative feedback noticeably reduces the variations of expression in protein due to DNA level change. Substantial reduction occurs when the effective binding rate is comparable to and when (the interface between regime I and regime III in Fig. 8D).
Discussion
Transcription, regulated by metabolite binding to riboswitches, depends on an interplay of a number of time scales that are intrinsic to the co-transcriptional folding of the riboswitch as well as those determined by cellullar conditions. For a riboswitch to function with a large dynamic range, transcription levels should change significantly as the metabolite concentration increases from a low to high value. In the high concentration limit, RNA transcript in the aptamer folded state binds a metabolite. Low dissociation rate constant results in the formation of terminator stem, which subsequently terminates transcription. In the low concentration limit, the aptamer folded state is mostly unbound and can remain folded till transcription termination or can fold to the antiterminator state leading to the transcription of the full RNA. The levels of transcription termination is thus controlled by the transition rates between the aptamer folded and unfolded states.
For in vitro description the efficiency of riboswitch is determined by two conflicting requirements. If , the dynamic range, is to be maximized, then has to be sufficiently low. However, at low and realistic values of the metabolite concentration, which implies the switching function (needed to abort transcription) cannot be achieved. Thus, has to have an optimal range () for the riboswitch to have sufficient dynamic range without compromising the ability to switch from an on to off state.
In the presence of negative feedback loop the concentration of target metabolites is also regulated by gene expression. Under nominal operating conditions () binding of target metabolites, products of the downstream gene that riboswitches regulate, significantly suppresses the expression of proteins. Negative feedback suppresses the protein level by about half relative to the case without feedback. In vivo, the presence of RNA binding proteins, such as NusA, may increase the pausing times, thus effectively reducing the transcription rates. Thus, the repression of protein level by the riboswitch through metabolite binding may be up to 10 fold. Faster RNA folding and unfolding rates than those we obtained may also increase the suppression by negative feedback and broaden the range of transcription rates over which maximal suppression occurs. These predictions are amenable to experimental test.
In response to changes in the active operon level, the negative feedback speeds up the response time of expression and modestly reduces the percentage change in the protein level relative to change in operon level. The steady state level of expression for autoregulation varies as a square-root of the DNA concentration. Adaptive biological systems may minimize the variation in gene expression to keep the systems functioning normally even when the environments change drastically. One may need to consider more complex networks than the single autoregulation in the transcription network to find near perfect adaptation to the environmental change Ma et al. (2009).
Riboswitches provide novel ways to engineer biological circuits to control gene expression by binding small molecules. As found in tandem riboswitches Sudarsan et al. (2006); Breaker (2008), multiple riboswitches can be engineered to control a single gene with greater regulatory complexity or increase in the dynamic range of gene control. Synthetic riboswitches have been successfully used to control the chemotaxis of bacteria Topp and Gallivan (2007). Our study provides a physical basis for not only analyzing future experiments but also in anticipating their outcomes.
Acknowledgements
We thank Michael Hinczewski for constructive suggestions and advice. This work was supported in part by a grant from the National Science Foundation through grant number CHE09-10433.
References
- Winkler and Breaker (2005) W. C. Winkler and R. R. Breaker, Annual Review Microbiology 59, 487 (2005).
- Cheah et al. (2007) M. T. Cheah, A. Wachter, N. Sudarsan, and R. R. Breaker, Nature 447, 497 (2007).
- Montange and Batey (2008) R. K. Montange and R. T. Batey, Ann. Rev. Biophys. 37, 117 (2008).
- Batey et al. (2004) R. T. Batey, S. D. Gilbert, and R. K. Montange, Nature 432, 411 (2004).
- Serganov et al. (2004) A. Serganov, Y. T. Yuan, O. Pikovskaya, A. Polonskaia, L. Malinina, A. T. Phan, C. Hobartner, R. Micura, R. R. Breaker, and D. Patel, J. Chem. Biol. 11, 1729 (2004).
- Sudarsan et al. (2006) N. Sudarsan, M. C. Hammond, K. F. Block, R. Welz, J. E. Barrick, A. Roth, and R. R. Breaker, Science 314, 300 (2006).
- Breaker (2008) R. R. Breaker, Science 319, 1795 (2008).
- Watson and Fedor (2011) P. Y. Watson and M. J. Fedor, Nat. Struc. Mol. Biol. 18, 359 (2011).
- Wickiser et al. (2005) J. K. Wickiser, W. C. Winkler, R. R. Breaker, and D. M. Crothers, Molecular Cell 18, 49 (2005).
- Link and Breaker (2009) K. H. Link and R. R. Breaker, Gene Therapy 16, 1189 (2009).
- Carothers et al. (2011) J. A. Carothers, J. A. Goler, D. Juminaga, and J. D. Keasling, Science 334, 1716 (2011).
- Beisel and Smolke (2009) C. L. Beisel and C. D. Smolke, PLoS Comp. Biol. 5, e1000363 (2009).
- Chen and Ellington (2009) X. Chen and A. D. Ellington, PLoS Comp. Biol. 5, e1000620 (2009).
- Thirumalai (1995) D. Thirumalai, J. de Physique I 5, 1457 (1995).
- Hyeon and Thirumalai (2012) C. Hyeon and D. Thirumalai, Biophysical Journal 102, L11 (2012).
- Perdrizet et al. (2012) G. A. Perdrizet, I. Artsimovitch, R. Furman, T. R. Sosnick, and T. Pan, Proc. Natl. Acad. Sci. USA 109, 3323 (2012).
- McAdams and Arkin (1997) H. H. McAdams and A. Arkin, Proc. Natl. Acad. Sci. USA 94, 814 (1997).
- Schramek et al. (2001) N. Schramek, A. Bracher, and A. Bacher, J. Biol. Chem. 276, 44157 (2001).
- Bernstein et al. (2002) J. A. Bernstein, A. B. Khodursky, P. H. Lin, S. Lin-Chao, and S. N. Cohen, Proc. Natl. Acad. Sci. USA 99, 9697 (2002).
- Belle et al. (2006) A. Belle, A. Tanay, I. Bitincka, R. Shamir, and E. K. O’Shea, Proc. Natl. Acad. Sci. USA 103, 13004 (2006).
- Alon (2007) U. Alon, Nature Review Genetics 8, 450 (2007).
- Winkler et al. (2002) W. C. Winkler, S. Cohen-Chalamish, and R. R. Breaker, Proc. Natl. Acad. Sci. USA 99, 15908 (2002).
- Larson et al. (2011) D. R. Larson, D. Zenklusen, B. Wu, J. A. Chao, and H. Singer, Science 332, 475 (2011).
- Iyer and Struhl (1996) V. Iyer and K. Struhl, Proc. Natl. Acad. Sci. USA 93, 5208 (1996).
- Uptain et al. (1997) S. M. Uptain, C. M. Kane, and M. J. Chamberlin, Annual Review of Biochemistry 66, 117 (1997).
- Gusarov et al. (1997) I. Gusarov, R. A. Kreneva, K. V. Rybak, D. A. Podcherniaev, I. Iomantas, L. G. Kolibaba, B. M. Polanuer, I. Kozlov, and D. A. Perumov, Mol. Biol. (Mosk) 31, 820 (1997).
- Mack et al. (1998) M. A. Mack, A. P. van Loon, and H. P. Hohmann, J. Bacteriol. 180, 950 (1998).
- Ma et al. (2009) W. Ma, A. Trusina, H. El-Samad, W. A. Lim, and C. Tang, Cell 138, 760 (2009).
- Topp and Gallivan (2007) S. Topp and J. P. Gallivan, J. Am. Chem. Soc. 129, 6807 (2007).