Accretion Disk Temperatures of QSOs: Constraints from the Emission Lines
Abstract
We compare QSO emission-line spectra to predictions based on theoretical ionizing continua of accretion disks. The observed line intensities do not show the expected trend of higher ionization with higher accretion disk temperature as derived from the black hole mass and accretion rate. This suggests that, at least for accretion rates close to the Eddington limit, the inner disk does not reach temperatures as high as expected from standard disk theory. Modified radial temperature profiles, taking account of winds or advection in the inner disk, achieve better agreement with observation. This conclusion agrees with an earlier study of QSO continuum colors as a function of disk temperature. The emission lines of radio-detected and radio-undetected sources show different trends as a function of disk temperature.
Subject headings:
galaxies: active — quasars: general — black hole physics1. Introduction
The idea of accretion disks around supermassive black holes as the power source of active galactic nuclei (AGN) is widely accepted. Physical plausibility, the lack of successful alternatives, and the frequent presence of bipolar jets, support this picture. Qualitatively, the blue-ultraviolet “Big Blue Bump” (BBB) in the spectral energy distribution of QSOs resembles the expected thermal emission from the disk atmosphere (Shields, 1978; Malkan, 1983). Models achieve some success in fitting the spectral energy distribution (SED) of individual QSOs (e.g., Hubeny et al., 2001). However, the simple disk model has known shortcomings in accounting for the soft X-ray continuum, optical polarization, variability (see review by Koratkar & Blaes, 1999).
In an effort to test the correspondence between disk theory and observation, Bonning et al. (2007, hereinafter B07) examined the optical and ultraviolet colors of QSOs in the Sloan Digital Sky Survey 111The SDSS website is http://www.sdss.org. as a function of accretion disk temperature. In simplest terms, do QSOs with hotter disks show bluer colors? They found poor agreement between observed color trends and those predicted by standard disk models. For luminosities approaching the Eddington limit, the observed colors actually become redder with increasing disk temperature, in qualitative disagreement with predictions. B07 suggested that the discrepancy might result from a modification of the inner disk within the radius where radiation pressure gives a large fractional disk thickness. Modified disk models with no emission inside the critical radius gave improved agreement with observation.
Here we extend the results of B07 to include the QSO emission lines as diagnostics of the higher frequency portion of the disk continuum. The emission lines are governed by the intensity of the continuum at ionizing frequencies. The emitted flux at these frequencies is more sensitive to the accretion disk temperature and potentially offer a stronger test of the trend of the spectral energy distribution (SED) of QSOs with disk temperature. We again use the large dataset of quasar spectra available from the SDSS. We compare the observed quasar spectra to model predictions computed with the code AGNSPEC (Hubeny et al. 2000) coupled with the photoionization code Cloudy (Ferland et al., 1998). With a large range of inferred disk temperatures, one might expect strong trends in emission-line ratios and equivalent widths as a function of disk temperature. We find that these expectations are not borne out in observed QSO spectra.
We refer the reader to B07 for further background and references to earlier work. We assume a concordance cosmology with , , and H Mpc-1.
2. Modeling and Data Sampling
2.1. Accretion Disk Properties
B07 describe the physical basis of estimating the disk effective temperature. In standard thin-disk theory (Shakura & Sunyaev, 1973), accreting matter gradually spirals inwards as viscous stresses transport angular momentum outward. These stresses lead to local dissipation of energy that flows vertically to the surface of the disk and is radiated by the photosphere. The resulting effective temperature, given by , shows a radial dependence at radii substantially larger than the inner boundary of the disk. As the inner boundary is approached, the effective temperature reaches a maximum and then drops to zero at the inner boundary if the inner boundary condition is one of zero torque. For a disk radiating locally as a black body, the disk spectrum is fixed by , for a given value of black hole spin. For realistic opacities, there are significant spectral features such as Lyman edges of hydrogen and helium, either in emission or absorption (Hubeny et al., 2001) that can cause disks with the same value of to differ in their detailed continuum spectra. However, still remains a useful sequencing parameter.
The key parameters for a QSO accretion disk are the black hole mass and spin, the accretion rate, and the observer viewing angle. An important reference luminosity is the Eddington limit,
| (1) |
where is the electron scattering opacity per unit mass and M. The total luminosity produced is
| (2) |
Here is the accretion rate in , and = 10 increases from 0.057 for a non-rotating hole to 0.31 for a rapidly rotating Kerr hole with angular momentum parameter (Novikov & Thorne, 1973; Thorne, 1974). For = 0.998
| (3) |
or alternatively, , where . For a Schwarzschild hole, is cooler by a factor of for a given and (e.g., Shields, 1989). We also define a reference accretion rate and a dimensionless accretion rate . Note our definition of in terms of , so that a value gives for .
2.2. Deriving and
Derivation of from the width of the H or Mg ii broad emission lines has become an accepted approximation in recent years. The FWHM of the broad lines is taken to give the circular velocity of the broad-line emitting material (with some geometrical correction factor). The radius of the broad-line region (BLR), derived from echo mapping studies, increases as a function of the continuum luminosity, . Bentz et al. (2009) find , consistent with the value 0.5 suggested by photoionization physics. Here we use (Shields et al., 2003)
| (4) |
where /3000 , and .
The derived value of depends almost entirely on the broad line FWHM for a given object. The bolometric luminosity can be estimated as , following Kaspi et al. (2000)). Using Eq. 4 and this expression for , Eq. 3 becomes
| (5) |
We use a bolometric correction factor (Kaspi et al., 2000; Richards et al., 2006).
2.3. SDSS Spectra and Bins
We use the SDSS DR5 spectroscopic data base for “quasars” as our primary observational material. We selected AGN using an automated spectrum fitting program and imposing quality cuts as described by Salviander et al. (2007). These fits give values for quantities such as the flux and width of the broad H line and the continuum flux at various rest wavelengths including . The adopted redshift range is to 0.8 so as to keep the [O iii] nebular lines out of the telluric water vapor region. Approximately one-half of the objects fall above the QSO/Seyfert galaxy luminosity boundary at in units of . Following B07, we derive and for the individual quasars as described above, and then group them into bins with ranging from 5.0 to 5.7 defined by windows of 4.95 to 5.05, etc. Table 1 gives the average values of log and for these bins. Also given is the accretion rate and resulting on the assumption and , based on the bin averages for log and . (An alternative approach to the accretion rate is discussed below.) The values of log systematically decrease from 8.27 to 7.20 as increases from 5.0 to 5.7. The mean luminosity and accretion rate differs only slightly among the bins. As a result, the Eddington ratio increases with from to -0.3 across the bins.
| 5.0 | 8.72 | 44.39 | -0.95 | -1.47 | -0.77 | -1.34 |
| 5.1 | 8.51 | 44.36 | -0.98 | -1.30 | -0.63 | -0.99 |
| 5.2 | 8.31 | 44.33 | -0.97 | -1.13 | -0.49 | -0.65 |
| 5.3 | 8.12 | 44.34 | -0.95 | -0.93 | -0.29 | -0.26 |
| 5.4 | 7.90 | 44.30 | -1.00 | -0.75 | -0.12 | 0.13 |
| 5.5 | 7.66 | 44.22 | -1.06 | -0.59 | -0.03 | 0.46 |
| 5.6 | 7.43 | 44.13 | -1.13 | -0.44 | 0.06 | 0.78 |
| 5.7 | 7.20 | 44.04 | -1.19 | -0.30 | 0.15 | 1.10 |
Note. — Mean properties of the SDSS quasars in the various bins. All quantities are log10, with in solar masses and in solar masses per year. Subscript “5100” refers to AGNSPEC models with accretion rate adjusted to match observed continuum at 5100 Å. See text for discussion.
For each of the bins, we form a composite spectrum giving equal weight to all objects based on the frequency-integrated flux at earth over the spectrum. These composite spectra were measured to give values of several observational quantities (e.g., the [Ne v] emission-line intensity) used in the analysis below. Line measurements were carried out in IRAF222IRAF is distributed by the National Optical Astronomy Observatories, which are operated by the Association of Universities for Research in Astronomy, Inc., under cooperative agreement with the National Science Foundation.. Figure 1 gives the composite spectra and Figure 2 shows the accretion rate for the composite spectra as discussed in the preceding paragraph.

2.4. Accretion Disk Models
Our goal is to compare basic trends in observed and predicted AGN properties as a function of . To this end, we have computed disk models using the AGNSPEC program (Hubeny et al., 2001) in the manner described in B07. These models take as input parameters the black hole mass and spin paramter , accretion rate , viscosity parameter , and inclination of the disk axis to the line of sight. For simplicity, we adopt the commonly assumed value and focus on rapidly rotating black holes with (Thorne, 1974). We take as representative of randomly oriented AGN subject to an exclusion of inclinations near edge-on because of the dusty torus postulated in the unified model of AGN (Antonucci & Miller, 1985). The AGNSPEC code computes the vertical gravity and locally emitted flux in the orbiting frame, and calculates for each radius the vertical structure and emergent spectrum with the aid of a pre-computed grid of models. The spectrum observed at infinity is summed over all emitting radii accounting for all relativistic effects. In order to avoid an excessive number of free parameters, we restrict our models to the case . The spin of the black holes in AGN has been much debated, with some authors arguing for moderate values based on likely merger histories or fitting of disk models to the spectral energy distributions of individual AGN (e.g., Czerny et al., 2011, and references therein).
3. Problems with the Standard Disk Model
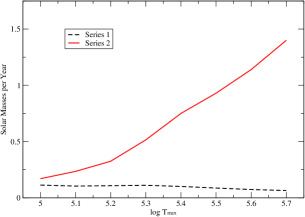
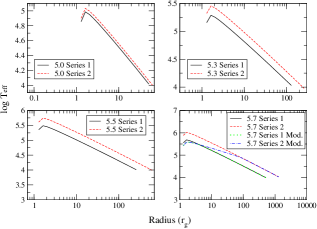
Here we discuss tests of the success of the standard thin accretion disk model in explaining a variety of observed properties of AGN. We discuss two different approaches to determining the accretion rate of the disk, which together with determines . First, we follow B07 in assuming a universal bolometric correction as described above. Then we discuss an alternative approach (see Section 3.3) in which is adjusted in the disk models so as to reproduce the observed value of . Figure 2 shows the accretion rate derived for the composite spectra in these two different approaches. Figure 3 shows the radial temperature profile for these models as well as a modified accretion disk model discussed in Section 4.
3.1. Emission-Line Intensities
As found above, typical values of for the accretion disk (for the parameters of our sample) are of order 200,000 K, corresponding to a black body peak at , where is the hydrogen ionization potential. Thus, the output of the disk in hydrogen ionizing photons, , will be sensitive to the value of , and the sensitivity will be greater for ions with higher ionization potentials. The amount of ionized gas and the resulting line luminosities, as well as the relative intensities of lines from different levels of ionization, should depend strongly on .
3.1.1 H Equivalent Width
A basic application of this concept is the equivalent width of the broad H line. For a photoionized nebula, the luminosity of the H line is given by radiative recombination theory (Osterbrock & Ferland, 2006) as
| (6) |
Here, is the covering fraction for the BLR, is the recombination-line emission coefficient, is the radiative recombination coefficient for hydrogen to quantum levels and higher, and is the ionizing photon luminosity (photons per second). This does not allow for collisional excitation or other processes that can affect H in the BLR. The H equivalent width is then given by . As increases, we expect a strong increase in , because the ionizing frequencies are more sensitive to disk temperature than the optical continuum emission. Figure 4 shows the predicted EW for the set of AGNSPEC models described above, on the assumption of a covering fraction of 0.5 independent of . The expected increase of EW with is evident. (The covering fraction of 0.5 was chosen to give agreement with the observed EW of H at log = 5.0 and is reasonable in the context of the unified model of AGN.)
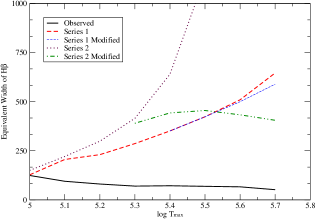
Figure 4 also shows the observed trend of the H EW as a function of for our SDSS composites. The observed values show a progressive decrease from from 120 Å to 50 Å as increases from 5.0 to 5.7. This trend is in qualitative disagreement with the model prediction. While it is possible that the covering fraction changes systematically with , an order-of-magnitude decrease in would be required from to 5.7. A search for independent signatures of such a trend may be worthwhile. However, it seems likely that such an extreme trend in covering fraction would have been been noticed in prior investigations. Therefore, the discrepancy shown in Figure 4 is an indication that something is wrong with the standard disk model as regards the ionizing photon output. This discrepancy resembles that found in B07 in which the continuum colors do not show the expected trend toward bluer colors at higher . The systematic decrease in H equivalent width with increasing gives a new context to the long known correlation between the EW and FWHM of the broad H emission line (Boroson & Green, 1992), since the derived depends mainly on the H broad line width (see eq. 5).
3.1.2 Ionization Ratios
Typical AGN spectra show emission lines from ions with a large range of ionization potentials. In the case of ionized nebulae, a useful diagnostic of the ionizing continuum is the ratio of the lines of He II and H I. In a normal nebular ionization structure, He ii occupies an inner volume of the Strömgren sphere (or a surface layer of a slab) whose fraction of the total H+ volume is proportional to the ionizing photon luminosity ratio, . Here is the ionizing photon luminosity above 4 Rydbergs frequency. The recombination line ratio is in turn proportional to the nebular average of , giving
| (7) |
This assumes that the nebula is optically thick to the Lyman continuum.
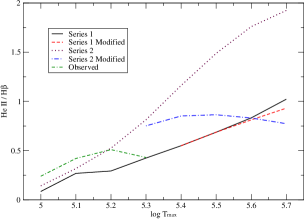
Figure 5 shows that does indeed increase strongly with increasing in the AGNSPEC models. Figure 1 shows the composite spectra for the various bins in . The broad He ii line is blended with Fe ii and difficult to measure. The He ii line in the narrow line spectrum is well defined for our cooler composites, in which the broad line widths are large. However, it is difficult to separate the narrow from the broad components of for the hotter composites, which have relatively narrow broad lines. Nevertheless, two points can be be made. A subjective inspection of the figure indicates little trend in the narrow He ii strength as a function of . Also, the observed values of narrow He ii/H for the lower bins are larger than would be expected for the predicted disk continuum, absent an additional hard component such as a power-law; and there is little trend with increasing .
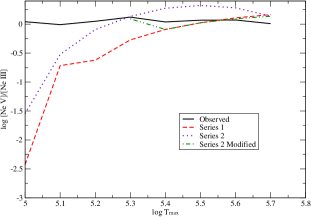
For an observationally more feasible test, we consider the narrow line ratio of [Ne v] to [Ne iii] . The Ne+4 ion requires even higher ionizing photon energies than He+2 and thus the [Ne v]/[Ne iii] ratio should be even more sensitive to than He ii/H. However, [Ne v]/[Ne iii] shows no significant trend with (see Figure 6). Thus, this observed line ratio, involving emission lines from the NLR rather than the BLR, also fails to support the expectation of a harder spectrum in the ionizing ultraviolet for higher .
3.2. Soft X-rays
AGN spectra characteristically include emission in the hard and soft X-ray bands. In general, this emission involves frequencies too high to be the result of ordinary thermal continuum emission from a standard accretion disk. Laor et al. (1997) and others have noted the inconsistency of observed soft X-ray fluxes with the simple thin-disk model. A Comptonizing corona, producing a power-law spectrum extending to high photon energies, is sometimes invoked (Czerny & Elvis, 1987). However, for the higher values of that we consider here, substantial soft X-ray emission from the inner disk is predicted, and there is the possibility of overproducing soft X-rays. We have computed in the manner described above, for the AGN in the sample described by Laor et al. (1997). Laor gives X-ray fluxes and values of the optical (3000 Å) to soft X-ray (0.3 keV) spectral index defined by . Figure 7 shows the predicted value of as a function of for a simple set of AGNSPEC models with . The increase in with increasing is evident. In contrast, the observed values of in the Laor sample, grouped into our same bins in , show no significant trend with . In particular, for , the models predict a greater value of than observed. This is significant, because one might invoke a Comptonized component to explain the soft X-rays for low ; but the hotter disks, in the standard model, over-predict the soft X-rays even before any Comptonized component is added. While the origin of the X-ray flux of AGN remains uncertain, it is remarkable that observed values of show no trend with . Thus, we have in yet another qualitative discrepancy between observed AGN properties and the predictions of the simple disk model.
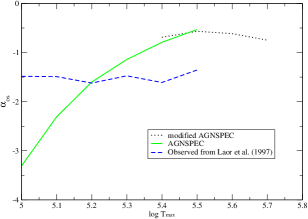
The dependence of on disk effective temperature has been previously discussed by other authors. For example, Deroches et al. (2009) in their Figure 6 show versus . Aside from minor differences in the derivation of and , their temperature axis can be calibrated to our scale by adding 7.56. The SDSS objects in their plot span a similar range in to ours, and likewise show little systematic trend in with .
3.3. Models with variable bolometric correction
As noted above and in B07, the use of a universal bolometric correction is not consistent with the proposition that disk temperatures may differ considerably among AGN. An alternative approach is to tune the value of in the AGNSPEC models so as to give the observed value of for a given bin. We have computed a set of models in this fashion, still assuming and . We find that for , the resulting model has a value giving , so that the model differs little from the case. However, for the higher bins, the value of implied by the AGNSPEC fits increases progressively to a value of for . (Here we use the terminology to refer to the original SDSS quasar bins, even though the actual of the models is now higher.) These models involve very large accretion rates which exceed the more conventional based on by nearly an order of magnitude. Such large accretion rates put increased strain on available accretion supplies. They also give much larger than , so that the inner radii of such disks would likely involve serious modifications due to radiation pressure and mass loss, as discussed below. Nevertheless, we start our discussion of these models by revisiting the several observational tests above using the predicted disk spectra from AGNSPEC.
Because increases strongly with in these models, the actual value of exceeds the nominal value defining the data bin by an increasing factor as the nominal increases. These models are useful, nevertheless, because we may think of the nominal spectrum bins as a sequencing procedure that gives us a set of SDSS AGN involving a large range in , even if there are ambiguities as to how well the nominal value agrees with the actual disk temperaure. Because the models adjusted to have a greater range of and than the nominal models, they are expected to show even stronger trends in observational quantities sensitive to , such as continuum color and high ionization emission-line strength.
Figure 4 shows the predicted equivalent width of H for the luminosity-fitted models. The strong increase with the bin value of is now even more pronounced and in greater contrast to the observed decrease. Figures 5 and 6 show the predicted He ii and [Ne v] intensity. The strong increase in [Ne v] with is now in even greater contrast to the observed constancy of [Ne v]/[Ne iii]. Figure 7 shows the extreme trend in versus for the luminosity-fitted models. The hotter cases greatly overpredict the observed soft X-ray fluxes.
Clearly, the luminosity-fitting approach only exacerbates the discrepancy between the theoretical predictions and observations. However, this approach may have merit physically, since it avoids use of a universal bolometric correction. Moreover, for the higher values of , the models severely underpredict the luminosity at . If the accretion rate is not increased, some restructuring of the AGN continuum source is needed to channel energy more efficiently into the continuum at optical wavelengths. In any case, the standard thin-disk model requires some kind of modification to explain the continuum and emission-line observations.
4. A Modified Disk Model
B07 found that observed continuum colors of SDSS QSOs did not become progressively bluer with increasing in the manner predicted by the AGNSPEC models. We suggested that this resulted from higher Eddington ratios at higher , leading to departures from the standard thin disk model. This might involve thickening by radiation pressure, inefficient “slim disk” accretion, and mass loss in a radiation-driven wind (see also Deroches et al. 2009). As an estimate of the potential effect on the continuum colors, we computed AGNSPEC models in which the inner disk was truncated inside the radius where radiation pressure gave a vertical scale height for the disk, relative to the radius, of . This led to improved agreement with the observed colors, in particular giving a non-monotonic trend of color with .
Here we explore a more physical model in which the disk effective temperature is modified inside the critical radius. The basic idea, following Poutanen et al. (2007) and Begelman, King, & Pringle (2006), is to take account of the luminosity produced at a given radius relative to . If the luminosity emitted by a wide annulus, , is well below , then the disk will not be severely thickened by radiation pressure, and standard disk physics applies. However, except near the inner boundary, increases with decreasing . For sufficiently large values of , a radius is reached where reaches . Near this radius, serious modifications of the disk structure can be anticipated. Shakura & Sunyaev (1973) called this the “spherization radius” on the basis that radiation pressure would severely thicken the disk. Poutanen et al. (2007) find that, inside , a combination of wind mass loss and advection occurs to a degree that keeps the local luminosity close to . This results in a break in the run of effective temperature with radius, so that inside one has rather than the standard dependence . This reduces the value of actually reached in the inner disk as well as the luminosity radiated from the hottest parts of the disk.
The value of in units of the gravitational radius is approximately As increases, the effective temperature at actually decreases, following
| (8) |
Here we have used the Newtonian expression for the local flux, omitting the normal factor of 3 increase in flux due to viscous transport of energy from smaller radii. This modification was found by Poutanen et al. (2007) because of energy loss in the inner disk due to advection and mass loss. For large values of , a luminosity is emitted in the vicinity of , and a similar luminosity is emitted per unit at smaller radii. Thus substantially controls the character of the emitted spectrum. Hence, the fact that decreases with increasing once spherization comes into play is suggestive of the reversal in the trend of colors with found in B07. (Note that, in this context, is defined in terms of the accretion rate entering the disk at large radii, and differs from the actual maximum temperature in the inner disk.)
The potential for an inverse relationship between and disk color temperature is strengthened if one considers the optical depth of the disk wind. In the case of highly super-Eddington accretion, Poutanen et al. (2007) find that a large part of the inflowing material is expelled as a wind in the vicinity of . In the simple approximation of a spherical wind with constant radial velocity equal to the circular orbital velocity at , the optical depth of the wind, measured radially from , is . The optical depth in the wind, measured outward from some radius that exceeds , is . For the radius of the photosphere, where , this gives . The effective temperature at the photosphere is
| (9) |
This raises the prospect that, for super-Eddington accretion rates, the maximum visible disk temperature will be rather than . An estimate of the progression of the disk temperature as it actually appears to the observer is then
| (10) |
This assumes that there is enough absorption opacity in the wind to reprocess the emerging energy; otherwise, the escaping spectrum may still be characterized by .
For our Series 1 models above, with an accretion rate based on , the value of reaches -0.3 for . Thus, unless opacity sources other than electron scattering reduce the effective Eddington limit, the effects of radiation pressure may be modest. However, for our Series 2 models with adjusted to fit the continuum at , reaches +1.1 for = 5.7. For this series, at we have ; , and . Thus, a reversal of the trend of the apparent temperature of the disk as a function of the nominal would be expected at . The fact that this value agrees with the turn-around in the color trend found in B07 is fortuitous, given the approximations in our discussion. However, this simple calculation does illustrate the possibility of reverse trend of color temperature with for super-Eddington rates.
In order to explore the impact of super-Eddington accretion on the disk spectrum and resulting emission-line intensities, we have computed modified models with AGNSPEC in which the standard inside a break radius is multiplied by a factor (see above). For the value of the break radius, we took . We present here results for , which was motivated by a preliminary analysis but which serves here simply as an illustrative example. We used the same values of and as used in our Series 1 and Series 2 models above. The run of with radius for the modified models is shown in Figure 3. As expected, there is little effect for Series 1 (); but substantial alterations are seen for Series 2. In Figure 4, the Series 2 prediction for the H equivalent width levels off above . This reduces but does not eliminate the discrepancy with the observed trend. Figure 5 shows a similar leveling of the predicted He ii intensity. Figure 6 shows a substantial reduction in the predicted Ne v intensity for around 5.4. These models are not intended to achieve a detailed fit to the observed spectra, but they do illustrate the substantial effect on the ionizing continuum that results from a modified disk structure resulting from super-Eddington accretion.
5. Radio vs. Non-radio sources
Our focus has been on the entire SDSS quasar data set, which is strongly dominated by radio quiet objects. However, radio loudness raises interesting questions regarding the black hole spin, which affects the inner disk boundary and thus the maximum temperature reached in the disk. Numerous authors have discussed the possibility that radio loud AGN have rapidly spinning black holes (e.g., Blandford, 1990), and on the other hand Garofalo et al. (2010) have proposed that radio loud objects have retrograde black hole spin with respect to the disk angular momentum. The innermost stable circular orbit (ISCO) decreases from for to for . Correspondingly, the radius of maximum effective temperature moves inward from to ; and the value of increases from to (Shields, 1989). For retrograde spin, the ISCO moves still farther out. These differences in the inner disk temperature could have a significant effect on the ionizing spectrum of the disk, while having less effect on the optical luminosity. Thus, we might expect differences between radio loud and quiet AGN in the observational quantities sensitive to discussed above.
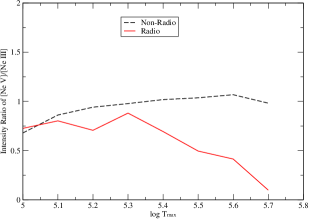
We have formed composite spectra separately for the radio loud and radio quiet AGN, adhering to our previously defined bins in . Here radio loud was taken simply to mean detected in the FIRST radio survey (Becker et al., 1995). This is not equivalent to the standard definition (Kellermann et al., 1989) and is distance-dependent, but it is sufficient to look for any qualitative difference between radio loud and quiet AGN. Figure 8 shows the observed trend of the [Ne v] intensity with for the radio loud and quiet composites. The [Ne v] /[Ne iii] ratio is similar for the two groups for , but there is a decline for the radio detected objects with increasing . Certainly, there is no evidence that [Ne v] is stronger for the radio-detected objects, as might be expected if they have higher spin of a prograde sense. On the other hand, the weaker [Ne v] of the radio objects might be expected if they involve retrograde disks.
6. Conclusion
The results presented here give focus to concerns about the disk model for the AGN continuum that have been voiced in the literature by numerous authors. In general terms, AGN over a wide range of and luminosity have rather similar SEDs (see Laor & Davis, 2011, and references therein). Organization of the observational data in terms of helps to clarify what trends are expected. We find that the predicted trends in the intensity of H, He ii and ]Ne v] are not seen in the observations. Over a factor of five in the value of as inferred from and , the [Ne v] intensity shows no systematic variation, and the H equivalent width shows a reverse trend. While our models are highly simplified, in particular for cases that approach or exceed the Eddington limit, the basic immunity of these key line ratios as well as to the expected value of is a striking empirical fact. These results suggest that a serious re-examination of the structure and emission mechanisms of the AGN central engine is in order. This might reasonably start with more detailed studies of the nature of disks in systems with high Eddington ratios, taking account of advection, winds, and all contributing sources of opacity.
References
- Antonucci & Miller (1985) Antonucci, R. R. J.; Miller, J. S. 1985, ApJ, 297, 621
- Becker et al. (1995) Becker, R.H., White, R.L., & Helfand, D.J. 1995, ApJ, 450, 559
- Begelman, King, & Pringle (2006) Begelman, M. C., King, A. R, & Pringle, J. E. 2006, MNRAS, 370, 399
- Bentz et al. (2009) Bentz, M. C., Peterson, B. M., Netzer, H., Pogge, R. W., & Vestergaard, M., 2009, ApJ, 697, 160
- Blandford (1990) Blandford, R. D. 1990, in Courvoisser, T. J.-L., Mayor M., eds., Active Galactic Nuclei. Springer, Berlin, p. 161
- Bonning et al. (2007) Bonning, E. W., Cheng, L., Shields, G. A., Salviander, S., & Gebhardt. K. 2007, ApJ, 659, 211
- Boroson & Green (1992) Boroson, T. A., & Green, R. F. 1992, ApJS, 80, 109
- Czerny & Elvis (1987) Czerny, B., & Elivis, M. 1987, ApJ, 321, 305
- Czerny et al. (2011) Czerny, B., Hryniewicz, K., Nikolajuk, M., & Sadowski, A., 2011, MNRAS, 415, 2941
- Deroches et al. (2009) Deroches, l.-B., Greene, J. E., & Ho, L. C. 2009, ApJ, 698, 1515
- Ferland et al. (1998) Ferland, G. J., Korista, K.T., Verner, D.A., Ferguson, J.W., Kingdon, J.B. & Verner, E.M. 1998, PASP, 110, 761
- Garofalo et al. (2010) Garofalo, D., Evans, D. A., & Sambruna, R. M. 2010, MNRAS, 406, 975
- Hubeny et al. (2001) Hubeny, I., Blaes, O., Krolik, J. H., Agol, E. 2001, ApJ, 559, 680
- Kaspi et al. (2000) Kaspi, S., Smith, P. S., Netzer, H., Maoz, D., Jannuzi, B. T., & Giveon, U. 2000, ApJ, 533, 631
- Kaspi et al. (2005) Kaspi, S., Maoz, D., Netzer, H., Peterson, B. M., Vestergaard, M., & Jannuzi, B. T. 2005, ApJ, 629, 61
- Kellermann et al. (1989) Kellermann, K. I., Sramek, R., Schmidt, M. Shaffer, D. B., & Green, R. F. 1989, AJ, 98,1195
- Koratkar & Blaes (1999) Koratkar, A., & Blaes, O. 1999, PASP, 111, 1
- Laor & Davis (2011) Laor, A., & Davis, S. 2011, preprint arXiv:1110.0653
- Laor et al. (1997) Laor, A., Fiore, F. Elvis, M., Wilkes, B. J., McDowell, J. C. 1997, ApJ, 477, 93
- Malkan (1983) Malkan, M. 1983, ApJ, 268, 582
- Novikov & Thorne (1973) Novikov, I. E., & Thorne, K. S. 1973, in Black Holes, Les Houches, ed. C. DeWitt & B. DeWitt (New York: Gordon & Breach).
- Osterbrock & Ferland (2006) Osterbrock, D. E. & Ferland, G. J. 2006, Astrophysics of Gaseous Nebulae and Active Galactic Nuclei (2nd ed.; Sausalito, CA: University Science Books)
- Poutanen et al. (2007) Poutanen, J., Lipunova, G., Fabrika, S., Butkevich, A. G., & Abolmasov, P. 2007, MNRAS, 377, 1187
- Richards et al. (2006) Richards, G. T., Lacy, M., Storrie-Lombardi, L. J., Hall, P. B., Gallagher, S. C., Hines, D. C., Fan, X., Papovich, C. et al. 2006, ApJS, 166, 470
- Salviander et al. (2007) Salviander, S., Shields, G. A., Gebhardt, K., & Bonning, E. W. 2007, ApJ, 662, 131
- Shakura & Sunyaev (1973) Shakura, N. I., & Sunyaev, R. A. 1973 A&A, 24, 337
- Shields (1978) Shields, G. A. 1978, Nature, 272, 706
- Shields (1989) Shields, G. A. 1989, New York Academy Sciences Annals, 571, 110
- Shields et al. (2003) Shields, G. A. 2003, et al., ApJ, 583, 124
- Thorne (1974) Thorne, K. S. 1974, ApJ, 191, 507