Finding Car Analogs in Nearby Galaxies Using Spitzer:
I. Candidate Selection
Abstract
The late-stage evolution of the most massive stars such as Carinae is controlled by the effects of mass loss, which may be dominated by poorly understood eruptive mass ejections. Understanding this population is challenging because no true analogs of Car have been clearly identified in the Milky Way or other galaxies. We utilize Spitzer IRAC images of 7 nearby ( Mpc) galaxies to search for such analogs. We find 34 candidates with a flat or rising mid-IR spectral energy distributions towards longer mid-infrared wavelengths that emit L⊙ in the IRAC bands (3.6 to 8.0 ) and are not known to be background sources. Based on our estimates for the expected number of background sources, we expect that follow-up observations will show that most of these candidates are not dust enshrouded massive stars, with an expectation of only surviving candidates. Since we would detect true analogs of Car for roughly 200 years post-eruption, this implies that the rate of eruptions like Car is less than the ccSN rate. It is possible, however, that every M M⊙ star undergoes such eruptions given our initial results. In Paper II we will characterize the candidates through further analysis and follow-up observations, and there is no barrier to increasing the galaxy sample by an order of magnitude.
1 Introduction
Despite being very rare, massive stars such as luminous blue variable (LBVs), red super giants (RSGs), and Wolf-Rayet stars (WRs) play a pivotal role in enriching the interstellar medium (ISM) through mass loss (e.g., Maeder 1981). Understanding the evolution of these massive (M M⊙) stars is challenging even when mass loss is restricted to continuous winds (e.g., Fullerton et al. 2006), but poorly understood impulsive mass ejections are probably an equally important, if not dominant mass loss mechanism (Humphreys & Davidson 1984; Smith & Owocki 2006; Kochanek 2011b). Mass loss also determines the structure of the star at death and hence the observed properties of the final core-collapse supernova (ccSN). In addition, there is also evidence that some supernova (SN) progenitors undergo major mass ejection events shortly before exploding (e.g., Gal-Yam et al. 2007; Smith et al. 2008), further altering the properties of the explosion and implying a connection between some eruptive mass-loss events and death (Gal-Yam et al. 2007; Smith & McCray 2007; Kochanek 2011a; Chevalier & Irwin 2012). In two cases, eruptions were observed shortly before the ccSN: Type Ib SN 2006jc was spatially coincident with a bright optical transient that occurred in 2004 (Pastorello et al. 2007), and SN 2009ip underwent a series of outbursts in 2009, 2010, and 2011 before probably exploding as a Type IIn SN (see Mauerhan et al. 2012; Prieto et al. 2012; Pastorello et al. 2012). These processes are likely metallicity dependent (Meynet et al. 1994; Heger et al. 2003) and there is good evidence that the SNe requiring a dense circumstellar medium (the hyperluminous Type IIn) predominantly occur in lower metallicity galaxies (e.g., Stoll et al. 2011; Neill et al. 2011).
Traditional studies of these massive stars search for them optically and then characterize them spectroscopically (e.g., Bonanos et al. 2009, 2010; Clark et al. 2012). This approach is not ideal for probing the episodes of major mass-loss because of dust formation in the ejecta. Dense winds tend to form dust, although for hot stars the wind must be dense enough to form a pseudo-photosphere in the wind (Davidson 1987) that shields the dust formation region from the UV emission of the star (Kochanek 2011b). The star will then be heavily obscured by dust for an extended period after the eruption (see, e.g., Humphreys & Davidson 1994). The great eruption of Car between 1840 and 1860 is the most famous case of a stellar outburst, ejecting material before reappearing as a hot star in the 1950s (see, e.g., Humphreys et al. 1997). The ejecta are now seen as a dusty nebula around the star absorbing and then reradiating of the light in the mid-IR. This means that dusty ejecta are a powerful and long-lived signature of eruption. The emission from these dusty envelopes peaks in the mid-IR with a characteristic red color and a rising or flat spectral energy distribution (SED) in the Spitzer IRAC (Fazio et al. 2004) bands.
In the Galaxy, stars with resolved shells of dust emission primarily at 24 are easily found (Wachter et al. 2010; Gvaramadze et al. 2010). The advantage of the 24 band is that it can be used to identify dusty ejecta up to years after its formation. A minority of these objects are very luminous stars (L L⊙) with massive ( M⊙) shells (see summaries by Humphreys & Davidson 1994; Humphreys et al. 1999; Smith & Owocki 2006; Smith 2009; Vink 2012). These include AG Car (Voors et al. 2000), the Pistol Star (Figer et al. 1999), G79.290.46 (Higgs et al. 1994), Wray 1796 (Egan et al. 2002), and IRAS 185760341 (Ueta et al. 2001). These systems are far older ( years) than Car, which makes it difficult to use the ejecta to probe the rate or mechanism of mass-loss. Still, the abundance of Galactic shells implies that the rate of Car-like eruptions is on the order of a modest fraction of the ccSN rate (Kochanek 2011b). Their emission peaks in the shorter IRAC bands when they are relatively young ( years) because, as the ejected material expands, the dust becomes cooler and the emission shifts to longer wavelengths (Kochanek et al. 2012a). It is difficult to quantify searches for such objects in our Galaxy as it is difficult to determine the distances to the sources and the survey volume because we have to look through the crowded and dusty disk of the Galaxy. Surveys of nearby galaxies are both better defined and build larger samples of younger systems whose evolution can be studied to better understand the mechanism.
With Spitzer it is difficult to use the 24 observations that have proved so successful in the Galaxy because of the poor angular resolution. However, we have shown that such surveys can be done with IRAC (3.6–8.0 ). In Thompson et al. (2009) and Khan et al. (2010), we characterized the extreme AGB star populations that appear to be the progenitors of the SN 2008S-like transients (Prieto et al. 2008; Prieto 2008) using archival IRAC images of nearby galaxies. These studies empirically confirmed that these L⊙ dusty stars are rare but are also relatively easy to identify in IRAC images despite the modest angular resolution. Next, we examined all the other bright, red mid-IR sources in M 33, and in Khan et al. (2011) we discovered Object X, the brightest mid-IR star in M 33. Object X is a L L⊙, M evolved star obscured by dust formed during mass loss events over the last century. Its properties are similar to those of the Galactic OH/IR star IRC+10420 (Humphreys et al. 1997; Blöcker et al. 1999; Humphreys et al. 2002), which has a complex dusty circumstellar structure resulting from episodic, low-velocity mass ejections. We proposed that Object X may emerge from its current ultra-short evolutionary phase as a hotter post-RSG star analogous to M 33 Var A (Hubble & Sandage 1953; Humphreys et al. 2006).
While Object X is intriguing, it likely underwent a period of enhanced, but relatively steady, mass loss from the parent star rather than the short transient episode of mass loss usually associated with so called “supernova impostors” (Van Dyk et al. 2000). It is also an order of magnitude less luminous and several times less massive than Car, one of the most luminous ( L⊙) and massive () stars known (Humphreys & Davidson 1994). No true analog of Car in mass, luminosity, energetics, mass lost and age has been found (see Smith et al. 2011; Kochanek et al. 2012a). Quantifying the population of Car analogs, or their rarity, in the local universe can allow us to investigate the rate of giant eruptions of the most massive stars. It may also help us answer open questions about the evolution of massive stars such as: (1) the frequency of major mass ejection events, (2) the number of events per star, (3) whether the frequency depends on the metallicity or other stellar properties, and (4) whether there is really any relation between mass ejections and the so called “supernova impostors” (see Smith et al. 2011; Kochanek et al. 2012a).
Here we carry out a pilot study of 7 nearby galaxies within ( Mpc) to search for analogs of Car. We concentrate on galaxies with recent star formation, as only these will have large numbers of the short-lived, very massive stars that we want to study, but we also include one small, low-mass galaxy (NGC 6822) as a test case (see Table 1). Section 2 describes our methodology for identifying potential Car analogs in nearby galaxies using archival Spitzer data and sources of contamination. Section 3 discusses the nature of the candidates, although a detailed study is deferred to Paper II. Section 4 shows how our search method allows us to quantify the selection criteria and to set an interesting limit on the rate of events similar to the Great Eruption of Car in the local universe even before we have completed Paper II. Finally, in Section 5 we outline the future of our approach.
2 A Search for Car Analogs
In this section, we present the methodology of our search for Car analogs. First we discuss our data sources and the properties of the targeted galaxies. Next we describe the photometry and candidate selection procedures. Then we consider contamination due to non-stellar sources. Finally we consider if an Car analog in a nearby galaxy could be hidden in a compact stellar cluster.
2.1 Targeted Galaxies
| Galaxy | Distance | SFR (H) | Known ccSN | |||
|---|---|---|---|---|---|---|
| (Mpc) | (erg/s) | (M ⊙/yr) | ( years) | |||
| NGC 6822 | 0.46 | 0.24 | 39.1 | 0.01 | … | |
| M 33 | 0.96 | 0.04 | 40.6 | 0.33 | … | |
| NGC 300 | 1.9 | 0.01 | 40.1 | 0.11 | … | |
| NGC 2403 | 3.1 | 0.04 | 40.8 | 0.44 | SN 2004dj (IIP) | |
| M 81 | 3.6 | 0.08 | 40.8 | 0.46 | SN 1993J (IIb) | |
| NGC 247 | 3.6 | 0.02 | 40.3 | 0.17 | … | |
| NGC 7793 | 4.1 | 0.02 | 40.6 | 0.33 | SN 2008bk (IIP) | |
There are a number of sources of archival Spitzer data for nearby galaxies. In the Local Group, SAGE (Surveying the Agents of a Galaxy’s Evolution) and SAGE-SMC (Meixner et al. 2006; Gordon et al. 2007) surveyed the LMC and SMC. Barmby et al. (2006) surveyed M 31 with first results for massive stars discussed by Mould et al. (2008). M 33 was observed at several epochs which allowed for mid-IR variability studies of M 33 stars (McQuinn et al. 2007; Thompson et al. 2009). The Spitzer Infrared Nearby Galaxies Survey (SINGS, Kennicutt et al. 2003) made a comprehensive mid-IR imaging and spectroscopic survey of 75 galaxies, many of them within Mpc. The Local Volume Legacy Survey (LVL, Dale et al. 2009) surveyed a total of 256 nearby galaxies, including all known galaxies inside a sub-volume bounded by Mpc and an unbiased sample of S-Irr galaxies within a larger, and more representative, Mpc sphere. The ongoing Spitzer Survey of Stellar Structure in Galaxies (, Sheth et al. 2008) is collecting data for galaxies within Mpc using the warm Spitzer ( and ) bands.
For our paper, we selected 7 galaxies spanning a range of mass, morphology, distance, and star formation history. Since this is a pilot study, the sample is deliberately eclectic rather than focused on a sample maximizing the star formation rate per galaxy. Ultimately we would like to examine all nearby galaxies rather than just a few. Table 1 summarizes the properties of the targeted galaxies. The absolute magnitude and H luminosity L(H) are from Kennicutt et al. (2008), and L(H) is converted to star formation rate (SFR) following Equation 2 of Kennicutt (1998). The foreground Galactic extinctions are from Schlafly & Finkbeiner (2011). The targeted galaxies have an integrated SFR of M year-1. For the assumed Salpeter IMF of Kennicutt (1998), we can convert this to the massive (M⊙) star formation rate of year-1. The observed ccSN rate over that 20 years is year-1 ( year-1, at 90% confidence). Since the ccSN rate should agree with the massive-star formation rate, this is a significant discrepancy for which we have no obvious explanation, and such mismatches are also found in other contexts (e.g., Horiuchi et al. 2011).
The nearest of our targeted galaxies, NGC 6822 (D Mpc, Gieren et al. 2006), is a barred irregular galaxy (de Vaucouleurs et al. 1991). We included this small galaxy in our sample as an interesting nearby test case for examining large numbers of smaller, lower metallicity systems. M 33 (D Mpc, Bonanos et al. 2006) was previously studied by both Thompson et al. (2009) and Khan et al. (2010) to search for dusty stars that are much redder but less luminous than the stars we are searching for in this paper. NGC 300 (D Mpc, Gieren et al. 2005) and M 81 (D Mpc, Gerke et al. 2011) were also studied by Khan et al. (2010). NGC 2403 (D Mpc, Saha et al. 2006) contains two sources sometimes classified as SN impostors, SN 1954J and SN 2002kg (see the review by van Dyk 2005), but any star associated with SN 1954J must be relatively low mass (M⊙ rather than M⊙) and shows no strong evidence for mid-IR emission, while SN 2002kg is simply a luminous variable star with little mass loss (see Kochanek et al. 2012a). Unlike the other large galaxies we studied, NGC 247 (D Mpc, Madore et al. 2009) is highly inclined. NGC 7793 (D Mpc, Tully et al. 2009) is the most distant galaxy studied.
For M 33, we used the six co-added epochs of IRAC data from McQuinn et al. (2007) that were used by Thompson et al. (2009) and Khan et al. (2010), and the MIPS data retrieved from the Spitzer Heritage Archive. For NGC 300 and NGC 247, we used the data from the LVL survey (Dale et al. 2009). For NGC 6822, NGC 2403, M 81, and NGC 7793, we used the data from the SINGS survey (Kennicutt et al. 2003). We utilize the full mosaics available for each galaxy. Table 2 shows the different pixel scales of the images retrieved from the Spitzer archive for M 33, and those provided by the SINGS and LVL surveys for the other six galaxies.
2.2 Candidate Selection
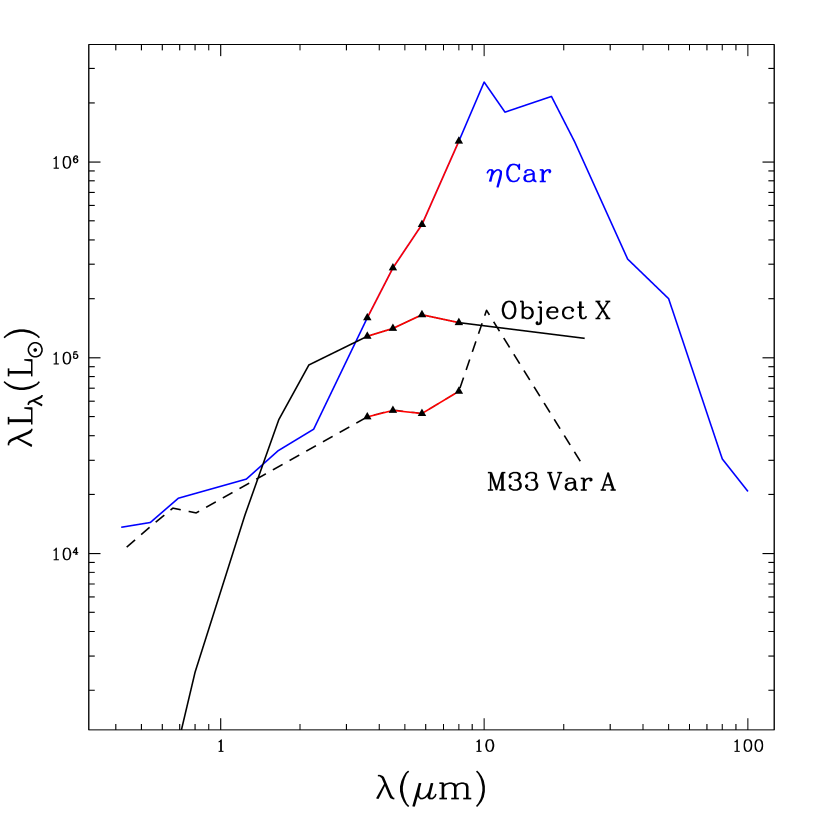
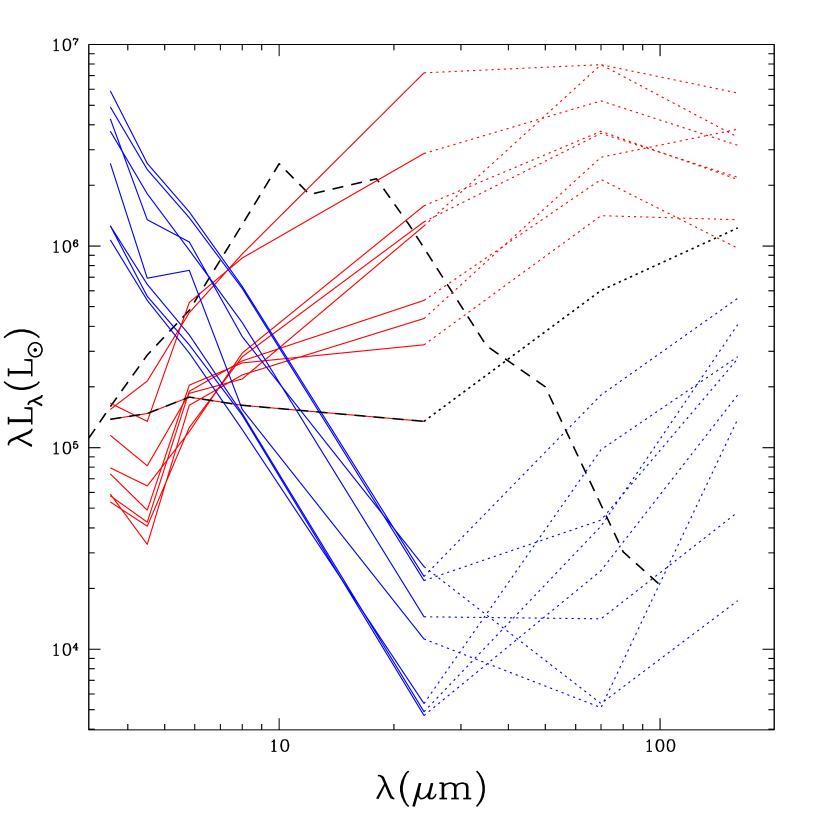
The SED of a hot dust-obscured star will generally have two peaks — a dust obscured optical peak, which could be absent altogether given enough absorption, and a mid-IR peak whose location in wavelength depends on the radius of the dust shell around the star. In the IRAC bands, the SED will be flat or rising towards longer wavelengths. For example, Car has a steeply rising SED towards longer mid-IR wavelengths (e.g., Robinson et al. 1973) and the luminosity of the star exceeds L⊙ in each IRAC band (see Figure 1). At extra-Galactic distances, an Car analog would appear as a bright, red point source in IRAC images with a relatively fainter optical counterpart due to the self-obscuration.
We used the Daophot/Allstar PSF-fitting and photometry package (Stetson 1992) to identify point sources in all four IRAC bands and then performed photometry at the source location using both aperture and PSF photometry. We used the IRAF111IRAF is distributed by the National Optical Astronomy Observatory, which is operated by the Association of Universities for Research in Astronomy (AURA) under cooperative agreement with the National Science Foundation. ApPhot/Phot tool for the aperture photometry. The aperture fluxes were transformed to Vega-calibrated magnitudes following the procedures described in the Spitzer Data Analysis Cookbook222http://irsa.ipac.caltech.edu/data/SPITZER/docs/dataanalysistools/ and aperture corrections of 1.213, 1.234, 1.379, and 1.584 for the four IRAC bands. The choice of extraction aperture aperture () as well as the inner () and outer () radii of the local background annulus are reported in Table 2. We estimate the local background using a outlier rejection procedure in order to exclude sources located in the local sky annulus, and correct for the excluded pixels assuming a Gaussian background distribution. Using a background annulus immediately next to the signal aperture minimizes the effects of background variation in the crowded fields of the galaxies. We used the Daophot/Allstar package for PSF photometry. The PSF photometry fluxes were transformed to Vega-calibrated magnitudes by applying zero point offsets determined from the difference between the calibrated aperture magnitudes and the initial PSF magnitude estimates of the bright stars in each galaxy.
| Band | Pixel Scale | ||||
|---|---|---|---|---|---|
| (m) | (Archive) | (Survey) | |||
| 3.6-8.0 | |||||
| 24 | |||||
| 70 | |||||
| 160 | |||||
For the 3.6 and 4.5 bands, after verifying consistency with the aperture magnitudes, we only use the Vega-calibrated PSF magnitudes. For 5.8 , we switch to aperture magnitudes when Allstar fails to fit the PSF to a point source at the location identified by Daophot due to the decreasing resolution. PSF photometry performs very poorly at 8.0 , leading to both inaccurate photometry and many false sources because Daophot frequently splits up extended regions of PAH emission into spurious point sources. Thus, at 8.0 we only use aperture photometry at positions determined for sources identified in the other three bands. We do not use this band for building our initial source list.
We define our initial source list as all point sources that have L⊙ in any one of the 3.6, 4.5, and 5.8 bands, excluding regions near saturated stars and, in the case of M 81, the high surface brightness core of the galaxy. We identify sources in each of these three bands, and cross-match the catalogs using a 1 pixel matching radius. We then adopt the position determined at the shortest wavelength (highest resolution) with a detection, and we use this position for the 8.0 aperture photometry. We fit the mid-IR SED of each object as a power law in wavelength
| (1) |
to determine the slope (, ) and intercept (). We can crudely relate the slope () to a dust temperature as
| (2) |
where and are the shortest and longest band-centers assuming a blackbody spectrum and ignoring Planck factors. We define the total mid-IR luminosity () as the trapezoid rule integral of across the band centers
| (3) |
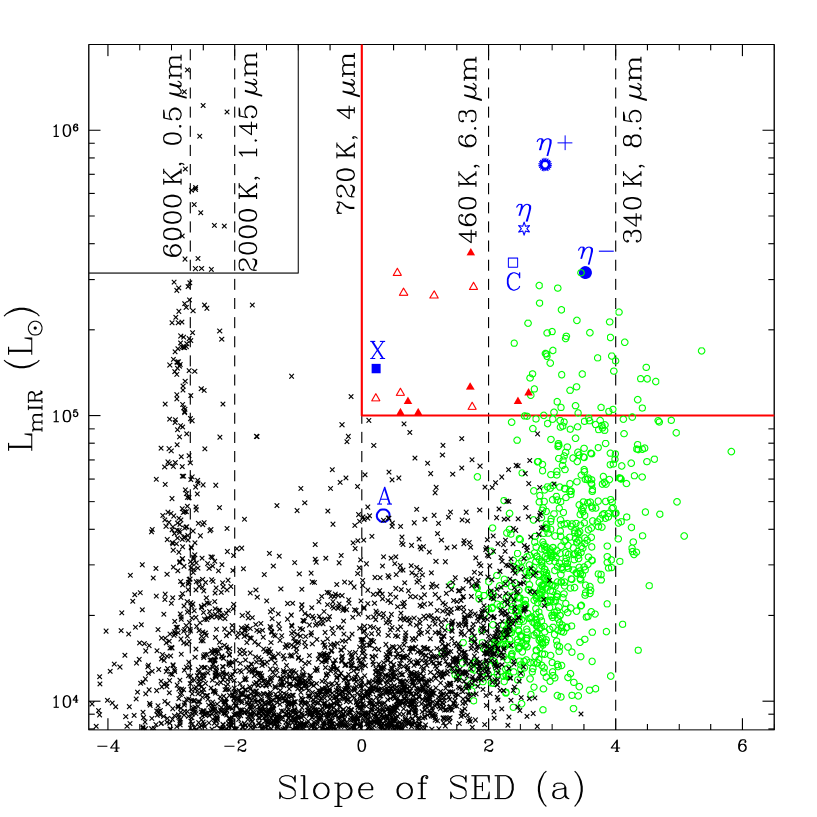
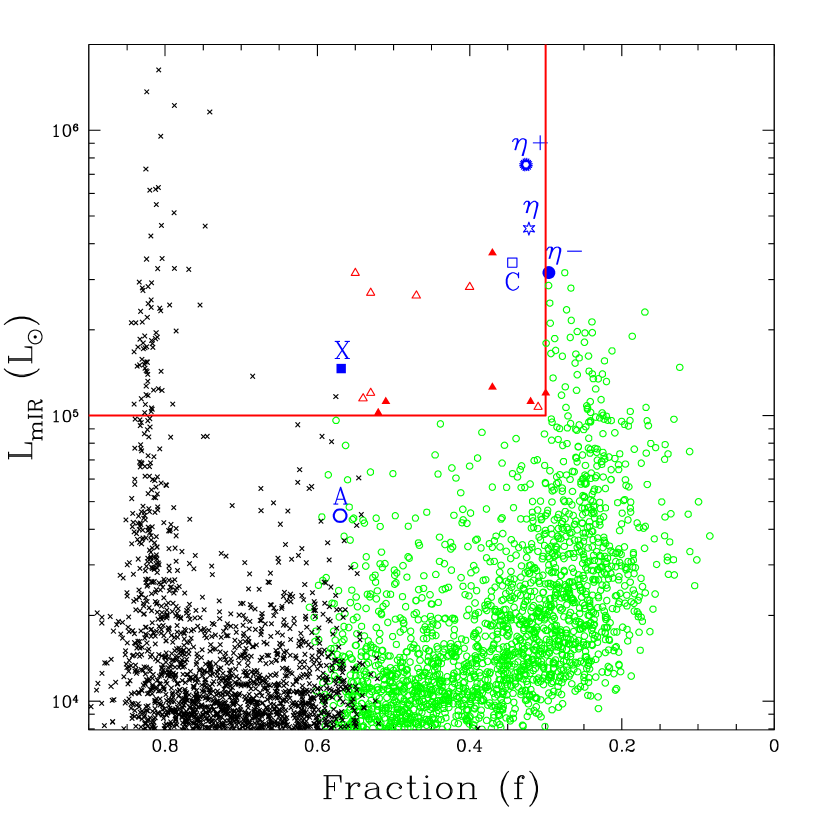
where 3.6, 4.5, 5.8, and 8.0 . We also calculate the fraction of that is emitted in the first three IRAC bands. We define as the ratio of the energy emitted between 3.6 and 5.8 (first two terms of the integral), to (all three terms of the integral). The approximate values of , , and for Car are L⊙, , and , and those for Object X are L⊙, , .
We defined candidates as sources with mid-IR luminosity L⊙, a mid-IR SED slope , and . Figures 2 and 3 show the distribution of point sources in M 81 with L⊙ in at least one of the 3.6, 4.5, and 5.8 IRAC bands as a function of , , and . The open red triangles in these figures correspond to candidates that are known to be non-stellar in nature (see Section 2.3), and the solid red triangles represent the surviving candidates. While a few hundred sources in M 81 are bright enough in the mid-IR to be included in these figures, only a handful of these even remotely resemble Car, and not a single one of them is as luminous and as red (cold) as Car. The other targeted galaxies show similar distributions of sources. These distributions illustrate that our selection criteria for identifying potential Car analogs are robust and allows for selecting objects that are significantly less luminous in the mid-IR and have much warmer circumstellar dust than Car. Table 5 reports the survey area and the number of candidates found for each galaxy.
We used aperture photometry to estimate the MIPS 24, 70, and 160 band luminosities of the objects that meet our selection criteria. For point sources that do not have a flux that is above the local sky, we determine the detection limit for each aperture location using the local background estimate. Due to the poor spatial resolution of these bands, which forces us to choose increasingly large apertures at longer wavelengths (see Table 2), these measurements have limited utility. Figure 5 shows the mid-IR SEDs of the candidates we identified in M 33 along with normal stars in the M 33 image selected from top left region of Figure 5. At 24 , the SEDs of the normal stars show the expected slope for the Rayleigh-Jeans tail of their SEDs, followed by an unphysical rise at 70 and 160 . Essentially, due to the poor resolution, the apertures used for these two bands include many objects other than the intended target, and even normal stars appear to have rising far-IR SEDs. This means that we can generally use the 24 fluxes while the 70 and 160 measurements should be treated as upper limits regardless of their origin. Nevertheless, the MIPS bands are useful as a qualitative constraint on an object’s physical nature (i.e. if it is a galaxy, QSO, cluster etc.).
2.3 Sources of Contamination
While our selection criteria are designed to identify dust obscured individual stars, there are several classes of contaminating sources as well. QSOs have red mid-IR SEDs compared to stars (e.g., Stern et al. 2005), as do star forming galaxies with strong PAH emission at 8.0 (e.g. the SED models in Assef et al. 2010). Sources in the galaxies such as dusty star clusters and H II regions can also appear as candidates. We used the SIMBAD333http://simbad.u-strasbg.fr/ and VizieR444http://vizier.u-strasbg.fr/ services to search for previous classifications and near-IR counterparts from the 2MASS point source catalog (Cutri et al. 2003). We also noted other significant pieces of information, such as a candidate location coinciding with known radio and X-ray sources. For example, many of the candidates in M 33 are associated with known supernova remnants (SNRs). We reject a source as “non-stellar” if it is a galaxy or QSO with a measured redshift or if archival images clearly show that it is a galaxy. The rejected sources that meet our selection criteria are described in Section 3.1.
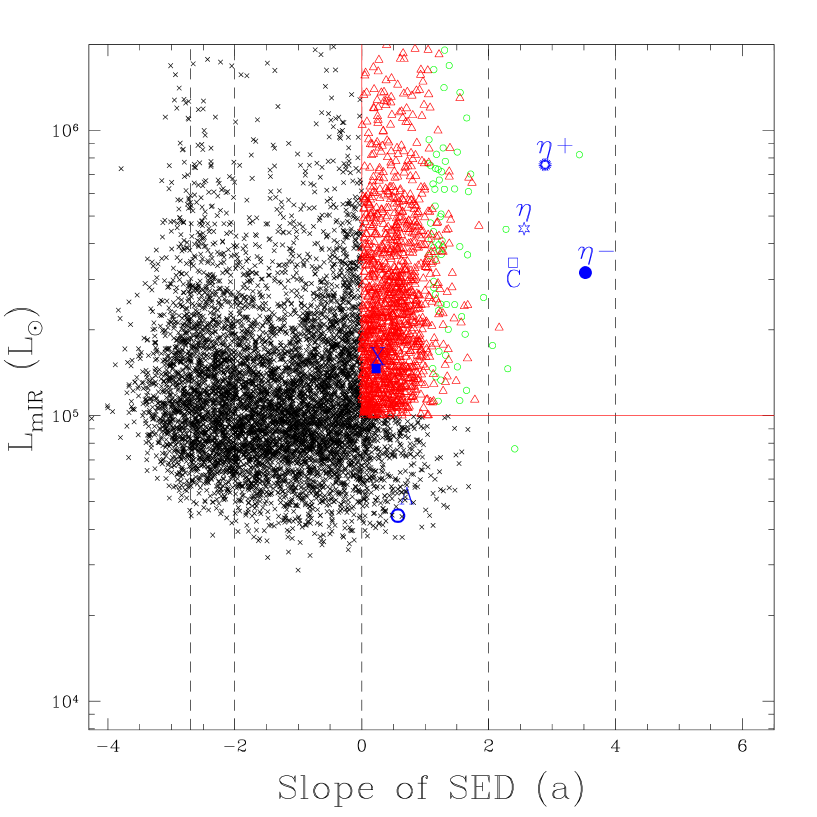
We estimate the expected number of extragalactic contamination for each galaxy using the SDWFS survey (Ashby et al. 2009) where the nature of the sources, particularly AGNs, is also well understood from the AGES redshift survey (Kochanek et al. 2012b). We transform the apparent magnitudes of all sources in a 6 deg2 region of SDWFS to luminosity using each target galaxy’s distance modulus, determine how many of them would meet our selection criteria, and correct that count for our survey area around each galaxy. Table 3 reports the expected surface density of extragalactic contaminants and the number expected given the survey area around each galaxy. We expect a total of extragalactic sources to pass our selection criteria across the targeted galaxies, as compared to 46 initial candidates. Figure 4, which has the same format as Figure 2, illustrates this for M 81’s distance. In the 6 deg2 SDWFS area, 449 ( deg-2) sources pass our selection criteria, indicating that we should expect background sources meeting our selection criteria given our 0.17 deg2 survey region around M 81, as compared to the 14 initial candidates selected. Indeed, as we discuss in Section 4, we can already identify 11 of the 46 initial candidates as extragalactic. Statistically, this means that only are likely associated with the galaxies. Also note in Figure 4 that none of the contaminating background sources have properties directly comparable to Car. The expected numbers of contaminating sources are generally consistent with the observed numbers with the exception of NGC 247, which we investigated but appears to surely be a statistical fluke. The angular distribution of the candidates relative to the galaxies is also strongly suggestive of a dominant contribution for background sources.
| NGC | M 33 | NGC | NGC | M 81 | NGC | NGC | |
|---|---|---|---|---|---|---|---|
| 6822 | 300 | 2403 | 247 | 7793 | |||
| Survey Area (deg2) | 0.1 | 0.73 | 0.17 | 0.12 | 0.17 | 0.2 | 0.044 |
| Candidates | 0 | 9 | 1 | 5 | 14 | 3 | 14 |
| Expected Background (deg-2) | 0.17 | 1.67 | 11 | 47 | 75 | 75 | 110 |
| Expected Contamination | 0 | 1 | 2 | 6 | 13 | 15 | 5 |
| Rejected Candidates | 0 | 0 | 0 | 0 | 7 | 1 | 3 |
| Remaining Candidates | 0 | 9 | 1 | 5 | 7 | 2 | 11 |
Many of the candidate SEDs show a “dip” from 3.6 to 4.5 before rising again at 5.8 (see Figure 5). This is a common feature of star cluster SEDs created by strong PAH emission at 3.6 (Whelan et al. 2011). In total galaxy spectra, this is a weaker effect and the dominant PAH emission feature is at and comes more from the diffuse ISM rather than individual stars or clusters. The SEDs of Car and Object X do not show this dip at 4.5 . We treat the presence of this dip as a qualitative indicator that the source may be a cluster or lie in a cluster. Deep Hubble Space Telescope (HST) images of these regions, where available, can help us distinguish single bright red stars from clusters of fainter stars that may be merged into a single bright source in the lower resolution Spitzer images. Whether these clusters can potentially hide Car analogs is discussed in Section 2.4.
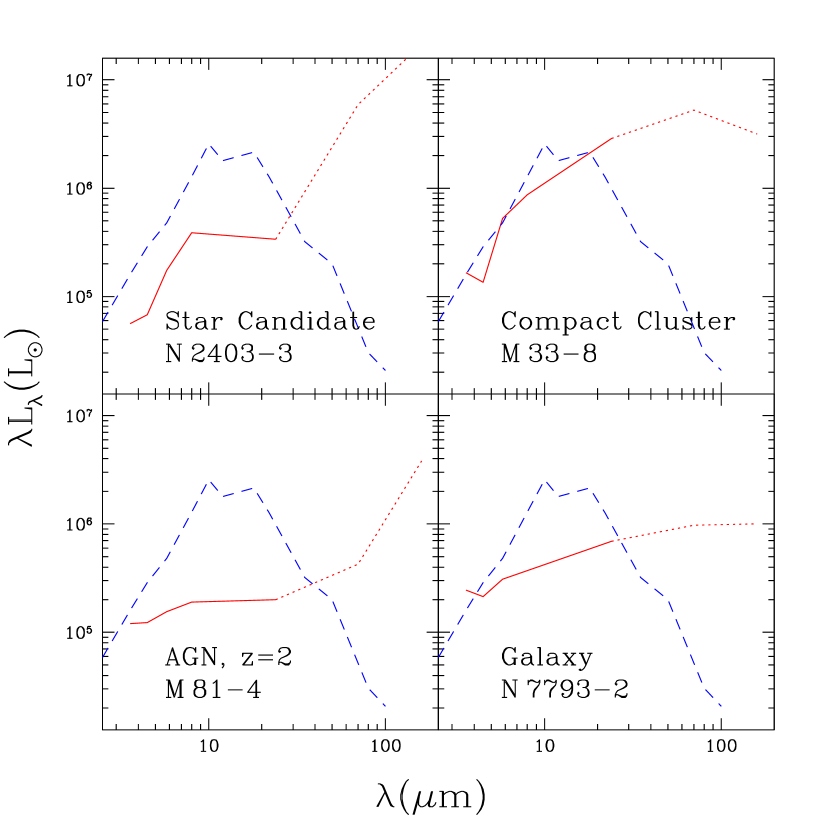
In Figure 7, we present SEDs of four different types of objects that met our selection criteria — a likely dusty star in NGC 2403, a star-cluster in M 33, a QSO behind M 81, and a galaxy behind NGC 7793. Although all four objects met our selection criteria, the detailed shapes of their SEDs are very different from each other. The likely stellar source, N 2403-3, has a very steeply rising mid-IR SED that peaks between 8 and 24 . While the compact cluster (M 33-8) SED looks quite similar to that of Car in the IRAC bands, it continues to rise steeply up to 24 , and the MIPS 70 and 160 upper limits show that it peaked between 24 and 70 . The SED of the QSO (M 81-4) remains relatively flat from 3.6 to 24 . The MIPS 70 and 160 upper limits for N 7793-2 (a galaxy) are quite stringent, because the source is far from the center of the galaxy, and would rule out an Car analog model. For some cases, such as N 7793-2, HST images clearly determine the nature of the source (Figure 10, bottom panel).
2.4 Star Clusters
One concern with star clusters as a source of contamination is the possibility of “hiding” a luminous dusty star in a dusty star cluster. To explore this problem we estimated what the SED of the star cluster containing Car would look like if it were located in one of the targeted galaxies. We combined the SED of Car from Humphreys & Davidson (1994) with the SED of the Carina nebula from Smith & Brooks (2007) to produce an SED of the entire complex (Figure 6). The combined SED is clearly a multi-component SED, which is not typical of our candidates. Moreover, the Carina nebula is roughly in extent (Smith & Brooks 2007), which at the distance of M 33 becomes and would be easily resolved by IRAC. Even at the distance of NGC 7793 it would still subtend and be resolved. At all these distances it would be very easily resolved by HST or JWST (Gardner et al. 2006).
In Figures 2 and 3, we show the mid-IR luminosity , SED slope , and fraction of Car (“”), the Carina nebula excluding Car (“”), and the entire complex including Car (“”). It is apparent from these figures that even if the Carina nebula was not resolved: (1) we would select analogs of Car and unresolved dusty stellar complexes hosting such analogs, (2) while it is close, we would not select a stellar complex that is identical to the Carina nebula excluding Car, and (3) there are no sources with , , and comparable to Car in M 81. Indeed, this last point is true for each galaxy we studied.
There are, however, far more compact star clusters among the candidates such as M 33-5, M 33-8 and M 81-10 (see Section 3) where HST images are required to recognize their spatial extent. Even in these cases it is unlikely we would lose a candidate. First, it would require a “conspiracy” of a sort, namely that the SED of the hotter circumstellar dust around the star (with characteristic K and ) seamlessly merges with the colder SED of the interstellar dust (with characteristic K and ) in the cluster. Typically we find that this leads to SEDs with “bumps” which we do not observe.
Possibly more constraining is the requirement that for a compact cluster to hide an Car analog it must still contain large amounts of interstellar gas and dust several million years after the cluster formed to allow for the time that even the most massive stars require to evolve away from the main sequence. However, a cluster sufficiently luminous to hide an Car analog must host many luminous stars with strong UV radiation fields and winds, which will likely clear the cluster of gas and dust needed to produce strong mid-IR emission. For example, 30 Dor, which harbors stars possibly as massive as and is about years old (e.g., Crowther et al. 2010), is a weak source of emission (see, e.g., Figure 1 of Zhang & Stanek 2012).
3 Inventory of Candidates
In this section we discuss the initial results of our search for Car analogs. A total of 46 sources passed our basic mid-IR selection criteria (L⊙, , ). First we discuss the eleven candidates that can be rejected as known non-stellar sources. Their properties are reported in Table 4. Then we list the remaining 35 candidates, including Object X, in Table 5. Table 6 presents the near-IR photometry for the 9 sources with counterparts in the 2MASS point-source catalog (Cutri et al. 2003).
3.1 Rejected Candidates
| ID | RA | Dec | Slope | Spectral Energy Distribution [L] | ||||||||
|---|---|---|---|---|---|---|---|---|---|---|---|---|
| () | [3.6] | [4.5] | [5.8] | [8.0] | [24] | [70] | [160] | |||||
| M 81-1 | 149.21474 | 69.12843 | 0.56 | 5.50 | 0.55 | 5.46 | 5.55 | 5.61 | 5.66 | 5.46 | 5.28 | 5.81 |
| M 81-2 | 148.91331 | 69.29649 | 0.22 | 5.06 | 0.54 | 5.21 | 5.15 | 4.95 | 5.33 | 5.13 | 5.53 | 5.97 |
| M 81-3 | 149.25626 | 68.91674 | 0.66 | 5.43 | 0.53 | 5.37 | 5.45 | 5.57 | 5.59 | 5.58 | 5.50 | 5.60 |
| M 81-4 | 149.15222 | 69.00780 | 0.61 | 5.08 | 0.53 | 5.08 | 5.09 | 5.19 | 5.28 | 5.30 | 5.63 | 6.58 |
| M 81-8 | 149.17365 | 68.80576 | 1.14 | 5.42 | 0.47 | 5.30 | 5.32 | 5.57 | 5.66 | 5.60 | 5.51 | 5.60 |
| M 81-9 | 148.85034 | 69.24746 | 1.76 | 5.45 | 0.40 | 5.18 | 5.38 | 5.45 | 5.83 | 5.52 | 6.46 | 6.27 |
| M 81-13 | 148.99657 | 69.26839 | 1.74 | 5.03 | 0.31 | 4.90 | 4.85 | 4.78 | 5.54 | 5.10 | 6.14 | 5.99 |
| N 247-2 | 11.90806 | 20.51950 | 1.35 | 5.10 | 0.36 | 5.13 | 4.85 | 5.01 | 5.55 | 5.46 | 6.89 | … |
| N 7793-2 | 359.47302 | 32.47820 | 0.62 | 5.37 | 0.51 | 5.39 | 5.33 | 5.49 | 5.57 | 5.84 | 5.99 | 6.00 |
| N 7793-5 | 359.34467 | 32.62253 | 0.76 | 5.15 | 0.42 | 5.33 | 4.96 | 5.05 | 5.54 | 5.24 | 6.13 | 6.47 |
| N 7793-7 | 359.46878 | 32.63801 | 1.17 | 5.04 | 0.37 | 5.09 | 4.87 | 4.87 | 5.49 | 5.59 | 6.08 | 6.80 |
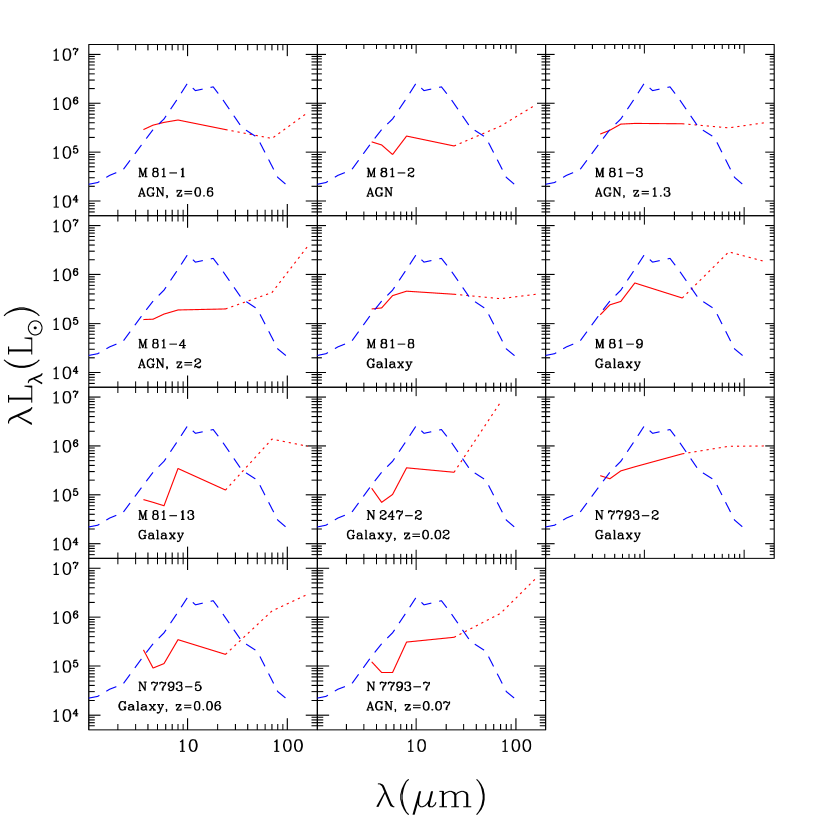
Of the 11 rejected candidates, six are AGNs or galaxies with a redshift measurement. Four have been photometrically classified as galaxies by the SDSS survey (Abazajian et al. 2009) and visual inspections of the SDSS images find diffuse extended sources consistent with this classification. One of these sources is also 04 away from a radio and X-ray source and is likely a low redshift AGN. One candidate is a well-resolved galaxy in HST images. The SEDs of the rejected candidates are shown in Figure 8 and their luminosities, SED slope, and are listed in Table 4. In detail, we find that:
-
•
M 81-1 is an AGN. It is 0362 from a quasar at (Richards et al. 2009).
- •
-
•
M 81-3 is an AGN. It is 038 from a quasar at (Schneider et al. 2010).
-
•
M 81-4 is an AGN. It is 065 from a quasar at (Schneider et al. 2010).
-
•
M 81-8, M 81-9, and M 81-13 are classified as galaxies by SDSS (Abazajian et al. 2009) and visual inspections of the SDSS images finds extended sources consistent with these classifications.
-
•
N 247-2 is a galaxy at (Jones et al. 2009).
-
•
N 7793-2 is unambiguously a galaxy in HST images (Figure 10, bottom panel).
-
•
N 7793-5 is a galaxy at (Jones et al. 2009).
-
•
N 7793-7 is an AGN. It is 15 from a QSO at (Véron-Cetty & Véron 2010).
While the astrometric matches are sometimes imperfect, we are dealing with objects with such low surface densities that a mismatch is extraordinarily unlikely. Essentially, this search recapitulates aspects of the Kozłowski et al. (2010) search for quasars behind the Magellanic clouds as red mid-IR sources following the extragalactic mid-IR search criteria of Stern et al. (2005). The red mid-IR colors created by the power-law SEDs of quasars mimic aspects of the red SEDs of dusty stars.
3.2 Remaining Candidates
| ID | RA | Dec | Slope | Spectral Energy Distribution [L] | ||||||||
|---|---|---|---|---|---|---|---|---|---|---|---|---|
| () | [3.6] | [4.5] | [5.8] | [8.0] | [24] | [70] | [160] | |||||
| M 33-1a,ba,bfootnotemark: | 23.35015 | 30.42626 | 0.24 | 5.11 | 0.57 | 5.14 | 5.17 | 5.25 | 5.21 | 5.13 | 5.78 | 6.09 |
| M 33-2aaIdentified as point sources in the 2MASS catalog (Cutri et al. 2003). See Table 6 for near-IR magnitudes. | 23.39209 | 30.69071 | 1.06 | 5.10 | 0.46 | 5.06 | 4.91 | 5.27 | 5.34 | 6.10 | 6.90 | 6.76 |
| M 33-3 | 23.43939 | 30.61357 | 1.98 | 5.10 | 0.39 | 4.87 | 4.69 | 5.31 | 5.42 | 5.51 | 6.15 | 6.13 |
| M 33-4 | 23.55650 | 30.56175 | 2.17 | 5.01 | 0.36 | 4.77 | 4.52 | 5.21 | 5.36 | 5.64 | 6.44 | 6.58 |
| M 33-5 | 23.31891 | 30.88054 | 2.32 | 5.57 | 0.36 | 5.19 | 5.33 | 5.67 | 5.96 | 6.86 | 6.90 | 6.54 |
| M 33-6 | 23.36988 | 30.67363 | 1.79 | 5.05 | 0.36 | 4.90 | 4.81 | 5.08 | 5.47 | 6.20 | 6.57 | 6.33 |
| M 33-7 | 23.39793 | 30.65805 | 2.33 | 5.08 | 0.36 | 4.76 | 4.63 | 5.28 | 5.43 | 5.73 | 6.33 | 5.99 |
| M 33-8aaIdentified as point sources in the 2MASS catalog (Cutri et al. 2003). See Table 6 for near-IR magnitudes. | 23.50089 | 30.67987 | 2.40 | 5.56 | 0.35 | 5.22 | 5.13 | 5.72 | 5.94 | 6.46 | 6.72 | 6.50 |
| M 33-9 | 23.37096 | 30.67276 | 2.34 | 5.02 | 0.32 | 4.73 | 4.61 | 5.10 | 5.45 | 6.12 | 6.56 | 6.34 |
| N 300-1 | 13.71123 | 37.67159 | 0.96 | 5.27 | 0.50 | 5.17 | 5.27 | 5.37 | 5.50 | 5.28 | 6.23 | 6.30 |
| N 2403-1aaIdentified as point sources in the 2MASS catalog (Cutri et al. 2003). See Table 6 for near-IR magnitudes. | 114.32964 | 65.59473 | 1.37 | 5.22 | 0.38 | 5.20 | 5.03 | 5.20 | 5.63 | 5.96 | 6.96 | 7.37 |
| N 2403-2 | 114.20582 | 65.60922 | 2.00 | 5.11 | 0.36 | 4.93 | 4.68 | 5.25 | 5.49 | 5.31 | 7.03 | 7.57 |
| N 2403-3 | 114.09702 | 65.61411 | 2.56 | 5.16 | 0.33 | 4.75 | 4.83 | 5.24 | 5.59 | 5.53 | 6.77 | 7.33 |
| N 2403-4aaIdentified as point sources in the 2MASS catalog (Cutri et al. 2003). See Table 6 for near-IR magnitudes. | 114.22210 | 65.59257 | 2.20 | 5.17 | 0.32 | 4.98 | 4.71 | 5.24 | 5.61 | 5.24 | 6.71 | 7.45 |
| N 2403-5 | 114.22632 | 65.59669 | 2.14 | 5.20 | 0.30 | 4.98 | 4.89 | 5.15 | 5.69 | 5.44 | 6.90 | 7.50 |
| M 81-5 | 148.75421 | 69.12405 | 0.61 | 5.01 | 0.52 | 5.01 | 4.99 | 5.13 | 5.20 | 5.22 | 6.06 | 7.12 |
| M 81-6 | 148.83128 | 68.95947 | 0.89 | 5.01 | 0.52 | 4.88 | 5.02 | 5.15 | 5.19 | 5.08 | 5.50 | 6.56 |
| M 81-7 | 148.72035 | 69.14713 | 0.73 | 5.05 | 0.51 | 5.03 | 5.07 | 5.11 | 5.29 | 5.31 | 6.74 | 7.07 |
| M 81-10 | 148.97075 | 68.98440 | 1.72 | 5.57 | 0.37 | 5.39 | 5.43 | 5.54 | 5.99 | 6.25 | 7.20 | 7.43 |
| M 81-11 | 149.00545 | 68.98351 | 1.71 | 5.10 | 0.37 | 4.95 | 4.89 | 5.12 | 5.51 | 5.20 | 6.70 | 7.46 |
| M 81-12 | 149.01479 | 68.98553 | 2.46 | 5.05 | 0.32 | 4.71 | 4.65 | 5.15 | 5.47 | 5.45 | 6.70 | 7.46 |
| M 81-14 | 148.66461 | 69.08003 | 2.63 | 5.08 | 0.30 | 4.74 | 4.57 | 5.19 | 5.53 | 5.65 | 6.92 | 7.28 |
| N 247-1 | 11.51449 | 20.72367 | 1.12 | 5.14 | 0.50 | 4.97 | 5.15 | 5.25 | 5.38 | 5.28 | … | 5.36 |
| N 247-3aaIdentified as point sources in the 2MASS catalog (Cutri et al. 2003). See Table 6 for near-IR magnitudes. | 11.91676 | 20.90363 | 1.45 | 5.14 | 0.31 | 5.07 | 5.02 | 4.64 | 5.68 | 5.32 | 5.95 | 6.33 |
| N 7793-1 | 359.39191 | 32.54715 | 0.31 | 5.13 | 0.55 | 5.20 | 5.28 | 4.95 | 5.40 | 5.21 | 5.45 | 6.47 |
| N 7793-3 | 359.43268 | 32.60958 | 0.77 | 5.06 | 0.47 | 5.13 | 4.94 | 5.13 | 5.35 | 5.21 | 6.06 | 7.43 |
| N 7793-4aaIdentified as point sources in the 2MASS catalog (Cutri et al. 2003). See Table 6 for near-IR magnitudes. | 359.38553 | 32.66690 | 0.91 | 5.34 | 0.46 | 5.34 | 5.32 | 5.31 | 5.67 | 5.53 | 5.98 | 6.36 |
| N 7793-6aaIdentified as point sources in the 2MASS catalog (Cutri et al. 2003). See Table 6 for near-IR magnitudes. | 359.47568 | 32.60091 | 1.58 | 5.14 | 0.38 | 5.05 | 4.85 | 5.22 | 5.51 | 5.43 | 6.38 | 7.51 |
| N 7793-8aaIdentified as point sources in the 2MASS catalog (Cutri et al. 2003). See Table 6 for near-IR magnitudes. | 359.42096 | 32.65040 | 1.65 | 5.21 | 0.33 | 5.20 | 4.83 | 5.19 | 5.67 | 5.24 | 6.09 | 6.68 |
| N 7793-9 | 359.46133 | 32.58006 | 2.16 | 5.05 | 0.33 | 4.83 | 4.65 | 5.14 | 5.47 | 5.22 | 6.94 | 7.46 |
| N 7793-10 | 359.41776 | 32.61156 | 2.23 | 5.19 | 0.32 | 4.99 | 4.68 | 5.30 | 5.61 | 5.54 | 6.67 | 7.43 |
| N 7793-11 | 359.41071 | 32.60335 | 2.48 | 5.19 | 0.31 | 4.89 | 4.72 | 5.30 | 5.62 | 5.79 | 6.96 | 7.50 |
| N 7793-12 | 359.48233 | 32.60726 | 2.34 | 5.02 | 0.31 | 4.73 | 4.65 | 5.06 | 5.47 | 5.54 | 6.46 | 7.65 |
| N 7793-13 | 359.42245 | 32.59289 | 3.08 | 5.23 | 0.31 | 4.72 | 4.64 | 5.41 | 5.64 | 5.77 | 6.93 | 7.60 |
| N 7793-14 | 359.47440 | 32.57985 | 2.73 | 5.16 | 0.30 | 4.78 | 4.61 | 5.29 | 5.59 | 5.48 | 6.59 | 7.32 |
| ID | RA | Dec | ||||||||
|---|---|---|---|---|---|---|---|---|---|---|
| M 33-1 | 23.35015 | 30.42626 | 23.15 | 21.61 | 19.99 | 17.07 | 15.04 | 13.6 | ||
| M 33-2 | 23.39209 | 30.69071 | 20.61 | 21.84 | 21.14 | 20.13 | 20.48 | 15.96 | 14.68 | 14.02 |
| M 33-8 | 23.39026 | 30.69038 | 18.89 | 19.85 | 18.81 | 17.94 | 17.68 | 16.15 | 15.49 | 14.25 |
| N 2403-1 | 114.32964 | 65.59473 | … | … | … | … | … | 14.89 | 14.42 | 14.21 |
| N 2403-4 | 114.22210 | 65.59257 | … | … | … | … | … | 17.21 | 16.05 | 14.45 |
| N 247-3 | 11.91676 | 20.90363 | … | … | … | … | … | 15.73 | 14.79 | 14.58 |
| N 7793-4 | 359.38553 | 32.66690 | … | … | … | … | … | 16.30 | 15.59 | 15.17 |
| N 7793-6 | 359.47568 | 32.60091 | … | … | … | … | … | 16.45 | 15.98 | 15.58 |
| N 7793-8 | 359.42096 | 32.65040 | … | … | … | … | … | 16.07 | 15.56 | 14.14 |
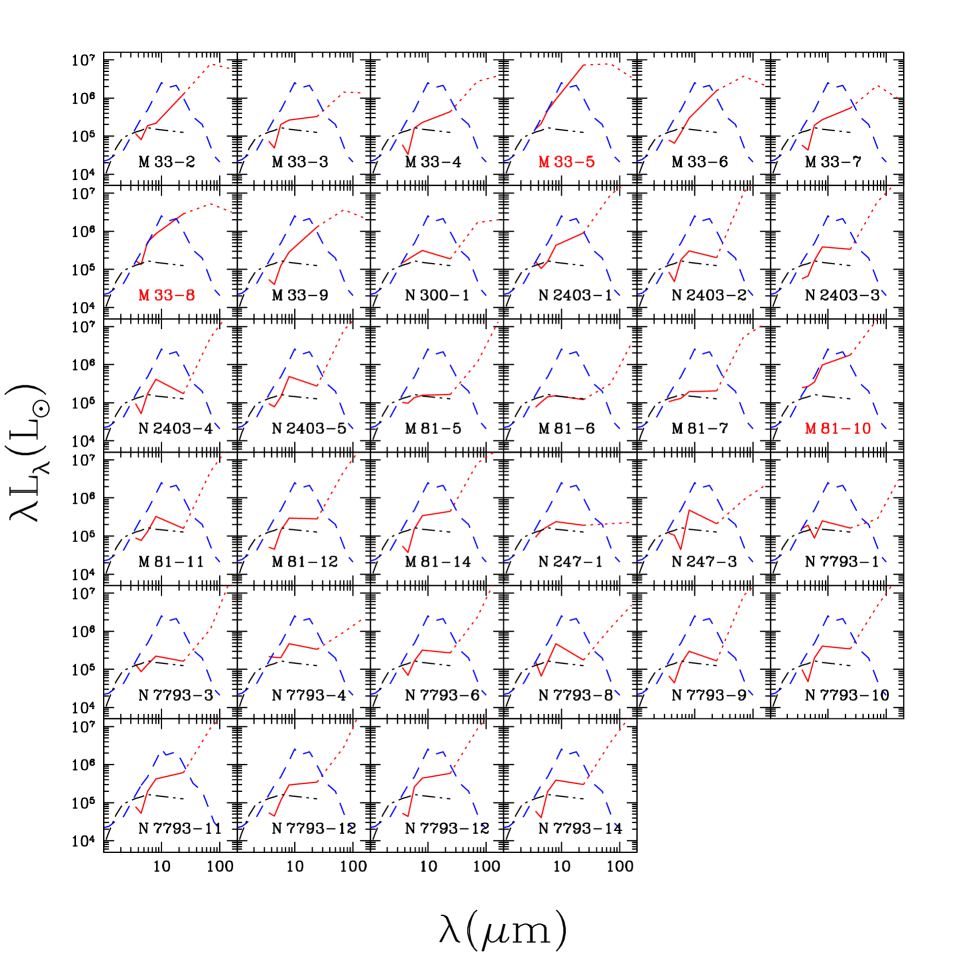
The mid-IR luminosities, slopes, and the fractions of the 35 remaining candidates, including Object X, are presented in Table 5. Of these, 9 also have 2MASS photometry and their near-IR magnitudes are presented in Table 6 along with the magnitudes of the closest optical counterparts for the three candidates in M 33 for which there is a publicly available catalog (Massey et al. 2007). We select Object X (Khan et al. 2011) as a candidate (M 33-1) but not M 33 Var A (Hubble & Sandage 1953; Humphreys et al. 2006). Although both are dust obscured stars with comparable bolometric luminosities and exist in our initial source list, it is apparent from Figure 1 that in the IRAC bands Object X is much more luminous (L⊙) than M 33 Var A (L⊙). In fact M 33 Var A recently emerged from a year dust obscured phase and is fading in the IRAC bands (Humphreys et al. 2006), and we would probably have selected it in observations at an earlier epoch.
It is apparent from the SEDs of the candidates (Figures 9) that few have mid-IR luminosities comparable to Car. Moreover, the SEDs of many sources, such as N 2403-2, N 247-3 and N 7793-10, appear so dissimilar from the SEDs of Car and Object X that they seem unlikely to be stellar sources. The MIPS band luminosity limits are also useful here. For example, the relatively low MIPS 70 and 160 luminosity limits indicate that N 247-1 must have a very flat or falling SED at these redder wavelengths and is probably an AGN, which is also suggested by its distance from the galaxy.
On the other hand, the SEDs of M 33-5, M 33-8 and M 81-10 are similar to Car while N 300-1, M 81-5, M 81-6 and M 81-7 are similar to Object X (M 33-1). HST images show that M 33-5, M 33-8, and M 81-10 are compact star clusters (Figure 10, top three panels). M 81-5 is 056 from a variable X-ray source with maximum luminosity of ergs s-1, which is consistent with the source being an X-ray binary (Remillard & McClintock 2006). M 81-7 has been classified as a galaxy by the SDSS survey but with a photometric redshift comparable to that of M 81 (Abazajian et al. 2009). HST images show a region of enhanced star formation consisting of at least two components. Ancillary data also shows that N 7793-3 is a High-Mass X-ray Binary (Mineo et al. 2012) with maximum X-ray luminosity of ergs s-1 (Liu 2011). Although we do not currently have an explanation, 5 of the candidates in M 33 (M 33-3 through M 33-7) are within of radio-selected supernova remnants (Gordon et al. 1999).
4 Rate Limits
One advantage of searching for eruptions in the dust obscured phase is that the process is relatively easy to simulate. We eject of material from a star of luminosity and temperature at velocity over time period and assume it forms dust with total (absorption plus scattering) visual opacity once it is sufficiently distant from the star. We can then use DUSTY (Elitzur & Ivezić 2001) to simulate the evolution of the mid-IR luminosities and determine the time during which the source would satisfy our selection criteria. Here we use cmg-1, roughly appropriate for silicate dust, but this is important only to the extent that the ejecta mass can be rescaled as . The key variable for estimating rates is the expansion velocity , because the detection period scales as . The velocities cited for the supernova impostors (e.g., Smith et al. 2011) and the velocity associated with the long axis of Car are high, km s-1. These velocities are very different from those observed for the older, massive shells in the Galaxy or the shorter axis of Car, where km s-1 (see the discussion of this difference in Kochanek 2011a). Here we scale the results to km s-1 since, for example, it results in our detecting systems with parameters similar to Car at its present age, as observed, and agrees with the expansion velocities of the other massive Galactic shells around luminous stars.
Detection of a shell at late times () is limited by its optical depth and temperature. The shell has total visual optical depth greater than for
| (4) |
and once it begins to rapidly fade in the mid-IR. Ignoring Planck factors, the spectral energy () peaks at
| (5) |
so the emission peak shifts out of the IRAC bands after several decades, and our survey is primarily limited by the shift of the emission to longer wavelengths rather than the declining optical depth. It is better to search for these sources at 24 as has been done in the galaxy (Wachter et al. 2010; Gvaramadze et al. 2010) but that would require the resolution of JWST (Gardner et al. 2006). A reasonable power-law fit to the results (, ) of the DUSTY models is that the detection period is
| (6) |
For M⊙ and L L⊙ like Car, years where may also be years or more (see the discussion in Kochanek et al. 2012a). For present purposes, we adopt years as the period over which our selection criteria would identify an analogue of Car, consistent with the fact that our selection criteria do identify Car.
We can normalize the rate of eruptions to the ccSN rate as
| (7) |
where is the supernova rate and all stars more massive than undergo eruptions. Following the rate arguments in Kochanek (2011a), we can estimate the number of eruptions per massive star needed to explain the massive Galactic shells. If there are massive Galactic shells associated with massive stars (), then
| (8) |
where is the minimum optical depth needed to detect a shell surrounding the star and /century is the Galaxy’s supernova rate. Since the Galactic shells are identified as shells primarily at m, they are easier to find at low optical depths and temperatures than in our extragalactic survey. Thus, the massive Galactic shells imply an eruption rate relative to the supernova rate of since it is unclear whether we possess a complete inventory. Note that with this normalization the rate estimate does not depend on the mass scale .
5 Conclusions
This work empirically demonstrates that true analogs of Car — massive stars that have undergone eruptive mass ejection in the recent past (centuries) — are rare. Based on the discussion in Section 4, our survey can detect close analogs of Car for roughly years, consistent with Car meeting our selection criteria. The statistics of our present sample gives us a maximum of candidate systems after correcting for the estimated extragalactic contamination. Aside from the three very compact, luminous star clusters, the candidates generally do not have SEDs that closely resemble the SED of Car. Although we keep those three compact clusters in our candidate list for now, it is highly unlikely that they could hide luminous dusty stars similar to Car. We anticipate that further analysis and follow-up observations, using HST astrometry and photometry, ground based spectroscopy and Herschel 70 photometry, will show that most, if not all, of the remaining candidates are either non-stellar or are not truly analogous to Car. Of the true stellar systems, they are clearly going to be a mixture of “eruptions” such as Car and sources with longer lived, relatively steady dusty winds such as Object X.
We will carry out the detailed consideration of the candidates in Paper II, but suppose we scale conclusions about the rates to , which would also correspond to the 95% confidence upper limit we would use for estimating rate limits if we were to eliminate all the remaining candidates. This implies that we are probing eruption rates of order
| (9) |
for this sample of galaxies (roughly 1 per 200 years per galaxy), and fractional rates compared to the ccSN rate of order
| (10) |
that are in the appropriate regime. In fact, it seems likely that we should not find at the end of Paper II, and in some senses we already have that since our present sample contains Object X.
Alternatively, we could estimate the expected number of candidates from ccSN rate and the statistics of Galactic shells as discussed in Section 4. For the galaxies in our pilot study, we have two rather inconsistent estimates of the ccSN rate. Empirically, there were three ccSN over the last 20 years, which implies a rate of year-1 ( year-1, at 90% confidence). On the other hand, the integrated star formation rate of the targeted galaxies implies a massive star formation rate, which is equivalent to the ccSN rate, of roughly year-1. year-1 implies that the expected number of candidates in the targeted galaxies should be ( for and years) with a chance of finding at least 1. On the other hand, year-1 reduces the probability to only about 40% and implies that we need to study galaxies with an integrated star formation rate of 20 year-1 (10 times greater than what we have now) to have a chance of finding at least 1 massive dust obscured star.
In either case, our survey can be easily expanded to at least 10 times as many galaxies (and integrated star formation rate) simply using archival data from the SINGS, LVL, and surveys, which then probes rates far below those necessary to explain the Galactic sources. In such an expanded survey, additional means of suppressing contamination are important. The simplest method is to use the time variability of the mid-IR emission, since expanding shells of ejecta will also show a well defined pattern of fading (see Kochanek et al. 2012a) in the warm Spitzer bands (3.6 and 4.5 ) and new Spitzer observations would provide a time baseline of 5–10 years to search for such changes. Since the principle background in our present survey appears to be extragalactic, time variability is a powerful means of suppressing it. Galaxies are not variable, and the mid-IR variability of quasars is both relatively weak and stochastic, with a structure function of roughly mag (Kozłowski et al. 2010). Two epochs separated by 6–12 months would further help to separate source classes by constraining variability on shorter time scales.
References
- Abazajian et al. (2009) Abazajian, K. N. et al. 2009, ApJS, 182, 543
- Ashby et al. (2009) Ashby, M. L. N. et al. 2009, ApJ, 701, 428
- Assef et al. (2010) Assef, R. J. et al. 2010, ApJ, 713, 970
- Barmby et al. (2006) Barmby, P. et al. 2006, ApJ Letters, 650, L45
- Blöcker et al. (1999) Blöcker, T., Balega, Y., Hofmann, K., Lichtenthäler, J., Osterbart, R., & Weigelt, G. 1999, A&A, 348, 805
- Bonanos et al. (2006) Bonanos, A. Z. et al. 2006, ApJ, 652, 313
- Bonanos et al. (2009) —. 2009, AJ, 138, 1003
- Bonanos et al. (2010) —. 2010, AJ, 140, 416
- Chevalier & Irwin (2012) Chevalier, R. A. & Irwin, C. M. 2012, ApJ, 747, L17
- Clark et al. (2012) Clark, J. S. et al. 2012, A&A, 541, A146
- Crowther et al. (2010) Crowther, P. A., Schnurr, O., Hirschi, R., Yusof, N., Parker, R. J., Goodwin, S. P., & Kassim, H. A. 2010, MNRAS, 408, 731
- Cutri et al. (2003) Cutri, R. M. et al. 2003, 2MASS All Sky Catalog of point sources., ed. R. M. Cutri et al.
- Dale et al. (2009) Dale, D. A. et al. 2009, ApJ, 703, 517
- Davidson (1987) Davidson, K. 1987, ApJ, 317, 760
- de Vaucouleurs et al. (1991) de Vaucouleurs, G. et al. 1991, Third Reference Catalogue of Bright Galaxies.
- Egan et al. (2002) Egan, M. P., Clark, J. S., Mizuno, D. R., Carey, S. J., Steele, I. A., & Price, S. D. 2002, ApJ, 572, 288
- Elitzur & Ivezić (2001) Elitzur, M. & Ivezić, Ž. 2001, MNRAS, 327, 403
- Fazio et al. (2004) Fazio, G. G. et al. 2004, ApJS, 154, 10
- Figer et al. (1999) Figer, D. F., McLean, I. S., & Morris, M. 1999, ApJ, 514, 202
- Flesch (2010) Flesch, E. 2010, PASA, 27, 283
- Fullerton et al. (2006) Fullerton, A. W., Massa, D. L., & Prinja, R. K. 2006, ApJ, 637, 1025
- Gal-Yam et al. (2007) Gal-Yam, A. et al. 2007, ApJ, 656, 372
- Gardner et al. (2006) Gardner, J. P. et al. 2006, Space Sci. Rev., 123, 485
- Gerke et al. (2011) Gerke, J. R., Kochanek, C. S., Prieto, J. L., Stanek, K. Z., & Macri, L. M. 2011, ApJ, 743, 176
- Gieren et al. (2005) Gieren, W. et al. 2005, ApJ, 628, 695
- Gieren et al. (2006) —. 2006, ApJ, 647, 1056
- Gordon et al. (2007) Gordon, K. et al. 2007, in Spitzer Proposal ID #40245, 40245–+
- Gordon et al. (1999) Gordon, S. M., Duric, N., Kirshner, R. P., Goss, W. M., & Viallefond, F. 1999, ApJS, 120, 247
- Gvaramadze et al. (2010) Gvaramadze, V. V., Kniazev, A. Y., & Fabrika, S. 2010, MNRAS, 405, 1047
- Heger et al. (2003) Heger, A., Fryer, C. L., Woosley, S. E., Langer, N., & Hartmann, D. H. 2003, ApJ, 591, 288
- Higgs et al. (1994) Higgs, L. A., Wendker, H. J., & Landecker, T. L. 1994, A&A, 291, 295
- Horiuchi et al. (2011) Horiuchi, S., Beacom, J. F., Kochanek, C. S., Prieto, J. L., Stanek, K. Z., & Thompson, T. A. 2011, ApJ, 738, 154
- Hubble & Sandage (1953) Hubble, E. & Sandage, A. 1953, ApJ, 118, 353
- Humphreys & Davidson (1984) Humphreys, R. M. & Davidson, K. 1984, Science, 223, 243
- Humphreys & Davidson (1994) —. 1994, PASP, 106, 1025
- Humphreys et al. (1999) Humphreys, R. M., Davidson, K., & Smith, N. 1999, PASP, 111, 1124
- Humphreys et al. (2002) —. 2002, AJ, 124, 1026
- Humphreys et al. (1997) Humphreys, R. M. et al. 1997, AJ, 114, 2778
- Humphreys et al. (2006) —. 2006, AJ, 131, 2105
- Jones et al. (2009) Jones, D. H. et al. 2009, MNRAS, 399, 683
- Kennicutt (1998) Kennicutt, Jr., R. C. 1998, ApJ, 498, 541
- Kennicutt et al. (2003) Kennicutt, Jr., R. C. et al. 2003, PASP, 115, 928
- Kennicutt et al. (2008) —. 2008, ApJS, 178, 247
- Khan et al. (2011) Khan, R., Stanek, K. Z., Kochanek, C. S., & Bonanos, A. Z. 2011, ApJ, 732, 43
- Khan et al. (2010) Khan, R., Stanek, K. Z., Prieto, J. L., Kochanek, C. S., Thompson, T. A., & Beacom, J. F. 2010, ApJ, 715, 1094
- Kochanek (2011a) Kochanek, C. S. 2011a, ApJ, 741, 37
- Kochanek (2011b) —. 2011b, ApJ, 743, 73
- Kochanek et al. (2012a) Kochanek, C. S., Szczygiel, D. M., & Stanek, K. Z. 2012a, ArXiv e-prints, 1202.0281
- Kochanek et al. (2012b) Kochanek, C. S. et al. 2012b, ApJS, 200, 8
- Kozłowski et al. (2010) Kozłowski, S. et al. 2010, ApJ, 708, 927
- Liu (2011) Liu, J. 2011, ApJS, 192, 10
- Madore et al. (2009) Madore, B. F., Freedman, W. L., Catanzarite, J., & Navarrete, M. 2009, ApJ, 694, 1237
- Maeder (1981) Maeder, A. 1981, A&A, 101, 385
- Massey et al. (2007) Massey, P. et al. 2007, AJ, 134, 2474
- Mauerhan et al. (2012) Mauerhan, J. C. et al. 2012, ArXiv e-prints, 1209.6320
- McQuinn et al. (2007) McQuinn, K. B. W. et al. 2007, ApJ, 664, 850
- Meixner et al. (2006) Meixner, M. et al. 2006, AJ, 132, 2268
- Meynet et al. (1994) Meynet, G., Maeder, A., Schaller, G., Schaerer, D., & Charbonnel, C. 1994, A&AS, 103, 97
- Mineo et al. (2012) Mineo, S., Gilfanov, M., & Sunyaev, R. 2012, MNRAS, 419, 2095
- Mould et al. (2008) Mould, J. et al. 2008, ApJ, 687, 230
- Neill et al. (2011) Neill, J. D. et al. 2011, ApJ, 727, 15
- Pastorello et al. (2007) Pastorello, A. et al. 2007, Nature, 447, 829
- Pastorello et al. (2012) —. 2012, ArXiv e-prints, 1210.3568
- Prieto (2008) Prieto, J. L. 2008, The Astronomer’s Telegram, 1550, 1
- Prieto et al. (2012) Prieto, J. L., Brimacombe, J., Drake, A. J., & Howerton, S. 2012, ArXiv e-prints, 1210.3347
- Prieto et al. (2008) Prieto, J. L. et al. 2008, ApJ, 681, L9
- Remillard & McClintock (2006) Remillard, R. A. & McClintock, J. E. 2006, ARA&A, 44, 49
- Richards et al. (2009) Richards, G. T. et al. 2009, ApJS, 180, 67
- Robinson et al. (1973) Robinson, G., Hyland, A. R., & Thomas, J. A. 1973, MNRAS, 161, 281
- Saha et al. (2006) Saha, A. et al. 2006, ApJS, 165, 108
- Schlafly & Finkbeiner (2011) Schlafly, E. F. & Finkbeiner, D. P. 2011, ApJ, 737, 103
- Schneider et al. (2010) Schneider, D. P. et al. 2010, AJ, 139, 2360
- Sheth et al. (2008) Sheth, K. et al. 2008, in Spitzer Proposal ID #60007, 60007
- Smith (2009) Smith, N. 2009, ArXiv e-prints, 0906.2204
- Smith & Brooks (2007) Smith, N. & Brooks, K. J. 2007, MNRAS, 379, 1279
- Smith et al. (2011) Smith, N., Li, W., Silverman, J. M., Ganeshalingam, M., & Filippenko, A. V. 2011, MNRAS, 415, 773
- Smith & McCray (2007) Smith, N. & McCray, R. 2007, ApJ, 671, L17
- Smith & Owocki (2006) Smith, N. & Owocki, S. P. 2006, ApJ, 645, L45
- Smith et al. (2008) Smith, N. et al. 2008, ApJ, 686, 467
- Stern et al. (2005) Stern, D. et al. 2005, ApJ, 631, 163
- Stetson (1992) Stetson, P. B. 1992, 25, 297
- Stoll et al. (2011) Stoll, R. et al. 2011, ApJ, 730, 34
- Thompson et al. (2009) Thompson, T. A., Prieto, J. L., Stanek, K. Z., Kistler, M. D., Beacom, J. F., & Kochanek, C. S. 2009, ApJ, 705, 1364
- Tully et al. (2009) Tully, R. B., Rizzi, L., Shaya, E. J., Courtois, H. M., Makarov, D. I., & Jacobs, B. A. 2009, AJ, 138, 323
- Ueta et al. (2001) Ueta, T., Meixner, M., Dayal, A., Deutsch, L. K., Fazio, G. G., Hora, J. L., & Hoffmann, W. F. 2001, ApJ, 548, 1020
- van Dyk (2005) van Dyk, S. D. 2005, in Astronomical Society of the Pacific Conference Series, Vol. 332, The Fate of the Most Massive Stars, ed. R. Humphreys & K. Stanek, 47
- Van Dyk et al. (2000) Van Dyk, S. D. et al. 2000, PASP, 112, 1532
- Véron-Cetty & Véron (2010) Véron-Cetty, M.-P. & Véron, P. 2010, A&A, 518, A10
- Vink (2012) Vink, J. S. 2012, 384, 221
- Voors et al. (2000) Voors, R. H. M. et al. 2000, A&A, 356, 501
- Wachter et al. (2010) Wachter, S., Mauerhan, J. C., Van Dyk, S. D., Hoard, D. W., Kafka, S., & Morris, P. W. 2010, AJ, 139, 2330
- Whelan et al. (2011) Whelan, D. G., Johnson, K. E., Whitney, B. A., Indebetouw, R., & Wood, K. 2011, ApJ, 729, 111
- Zhang & Stanek (2012) Zhang, D. & Stanek, K. Z. 2012, Acta Astron., 62, 23