Dynamic response of open cell dry foams
Abstract
We study the mechanical response of an open cell dry foam subjected to periodic forcing using experiments and theory. Using the measurements of the static and dynamic stress-strain relationship, we derive an over-damped model of the foam, as a set of infinitesimal non-linear springs, where the damping term depends on the local foam strain. We then analyse the properties of the foam when subjected to large amplitudes periodic stresses and determine the conditions for which the foam becomes optimally absorbing.
Foams of different types form an important part of our daily lives having diverse applications depending on their material properties, e.g. density and flexibility Gibson:97 ; Wearie:99 ; Christensen:00 . Thus while open cell polymeric low density foams are used for car cushions, semi-rigid foams form packaging materials while rigid foams can be engineered to provide thermal insulation. An important physical property of foams is the efficiency with which energy is dissipated in these systems that make them ideal as shock absorbers Gibson:97 ; Ashby:00 . Since material properties are intrinsically connected to the underlying microstructure Kraynik:08 , current research has focussed on its classification Kraynik:03 ; Kraynik:04 and an exploration of mechanical properties using experiments Papka:99 ; Gong:05 , numerical simulations Kraynik:08 ; Kraynik:10 and theory Warren:88 ; Warren:91 ; Warren:97 .
X-ray microtomography Gong:05 and scanning electron microscopy of foams reveal their microstructure as connected random polyhedra with their bulk mechanical properties governed by Gibbs elasticity of the faces for closed cells, or nonlinear elasticity of struts for open cell foams respectively Warren:88 . Recently Kraynik et al. Kraynik:03 ; Kraynik:04 have performed detailed numerical calculations to classify foam microstructure for monodisperse and polydisperse foams. These simulations indicate that cells having an average number of faces and edges are the most probable polyhedra occurring in monodisperse foams in agreement with experiments by Matzke Matzke:46 . The surface energy of such random foams have been estimated using scaling arguments and are in good agreement with simulations Kraynik:04 .
Analysis of strut deformation incorporating bending, stretching Gent:59 ; Warren:88 , and torsion Warren:97 have been employed to investigate the linear and nonlinear elastic behavior of foams Warren:91 . The nonlinearity arises as a result of the coupling between geometry and strut elasticity. The micro-mechanics of foams where constitutive models for struts are inherently nonlinear have garnered recent interest Kraynik:12 . The nonlinear mechanical response has many fascinating features including strain localisation Gioia:01 ; Pampolini:08 , crushing Papka:99 ; Papka2:99 , energy dissipation, and shock mitigation Avalle:01 .
A complementary approach to the finite element simulations as a mean to connect microscopic structure to mechanical properties is modelling foams as a hyperelastic continuum Ogden:72 ; Ogden:03 . Motivated by these studies, in this Letter we propose and validate a phenomenological constitutive equation to model the mechanical response of open cell solid foams subject to dynamic loading White:00 . While preparing this manuscript we came across recent work in this area by Del Piero et al. DelPiero:09 . Our model is qualitatively different from prior approaches in having a nonlinear constitutive equation and a dynamic friction coefficient that is dependent upon the local stress of the system . Using this model we find excellent agreement between experimental data for dynamic loading experiments for two model foams, for low amplitude, low frequency oscillations. This leads to several interesting results, namely the identification of a scale factor that can be used to predict system size dependence of foam properties within the validity of the continuum approximation. We then explore, high amplitude, high frequency forcing of model foams theoretically and obtain optimal values of for energy dissipation and phase decoherence.
We carried out static and dynamic uniaxial compression tests for two foams with densities and (called dense and light respectively). The densities were measured using gravimetric method with cuboid volumes measured using digital callipers and its mass using a precision balance (Precisa B 320M) with an accuracy of milligrams. Static compression tests were carried out using an Instron model Extra between two steel plates having an upper plate diameter mm, and a lower plate diameter mm. The tests were carried out at relative humidity and at a temperature of . Cylindrical samples of light and dense foams having diameter mm and mm and heights mm, and mm respectively were used. A compressive displacement rate of mm/s which translates to a compressive strain rate of . The voltage output was fed into a Pico ADC- data logger and compressive stress-strain curves calculated. Dynamic measurements were carried out in compression using a Rheometrics RSA II solids analyzer. The samples were cut to a diameter of mm and a length of mm and tested between two steel plates whose diameter was mm. Initially a static compressive strain between and was applied. The system was equilibrated for min following which a dynamic test with a strain amplitude of and frequency Hz was applied. The storage and loss modulii and as well as their relative phases were calculated for each value of base compressive strain (increased in increments of ).
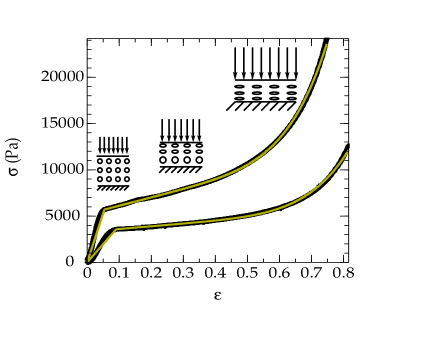
Fig. 1 shows constitutive relation between the compressive stress and strain for the static light (circles) and dense (diamonds) respectively. The experimental data is fitted (solid line) to a nonlinear function of the form
| (3) |
where, , , , for the dense foam and , , and for the light foam. As is expected the stress-strain behavior is linear for strains less than a critical threshold: and . For strains above the threshold the stress exhibits a large plateau as the foam cells undergo “collapse”, signalled by a large change in strain at a nearly constant stress. Upon increasing the strain further the foam undergoes progressive densification as the opposite faces of foam cells meet, inducing the observed nonlinear stress-strain response.
We model the foam as a homogeneous material made of nonlinear elastic elements obeying the force-extension relation given by Eq.(3), translationally invariant in and directions. The foam is held fixed at and a stress of the form
| (4) |
is applied at .
As shown in the supplementary material, the equation describing the non-linear foams considered here is given by
| (5) |
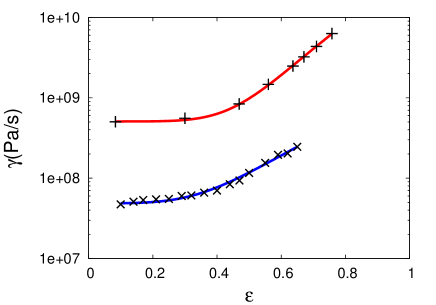
where is the local displacement relative to the unstrained configuration of the foam; is a friction coefficient which, a priori, can depend on the strain. We neglect the inertial term as in our set up it is orders of magnitudes smaller than the damping term due to the low density of the foam. Notice that the boundary conditions above are such that , for compression and . To determine , we have measured for the two foams using a dynamic strain of and simulated these experiments using eq (5). The strain dependent damping coefficient was fitted to the experimental data using
| (6) |
with and for the dense foam and and for the light foam, with very good agreement as shown in figure 2.
To study the properties of a foam subjected to a large amplitude periodic strain of period , it is worth noting that eq (5) can be rescaled as follow:
| (7) |
where, defining , and we have , , and . The scaling parameter allows us to relate the length scale, time scale and damping parameter of the foam. We thus see immediately that increasing the period of the load, , decreasing the sample length or the foam friction are equivalent in this rescaled system and correspond to a variation of . For the dense foam we have , , and
The amount of energy transferred, , to the foam by the excitation can be easily evaluated as
| (8) |
The energy dissipated by the foam, , on the other hand, is given by
| (9) |
Then, the absorption quality of the foam will be given by the ratio which corresponds to the relative amount of absorbed energy.
To analyse the properties of a foam under large amplitude periodic stress, we have considered the dense foam subjected to a sinusoidal pulse . The maximum stress correspond to a load of for the dense foam and as can be seen from fig 1, this correspond to a strain . We are thus probing the full range of the foam strain.
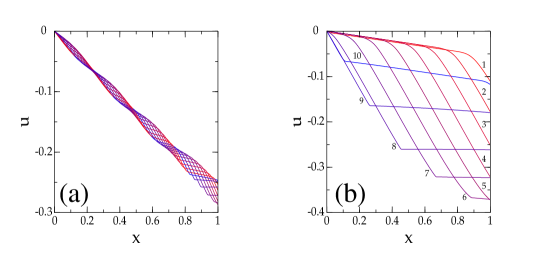
On figure 3 we present snapshots of the foam displacement at regular interval during one period of oscillation, when subjected to the sinusoidal pulse described above. Fig 3.a corresponds to while 3.b corresponds to . It is interesting to notice that the displacement profile is not sinusoidal as one might expect but instead progresses inside the foam as small plateaux. Small values of correspond to large values of . One thus sees that in that case, the amplitude of excitations are decreasing as one moves towards the origin. When , the foam deformation progresses as a pulse, exhibiting large regions where the strain, , is very small. At the base of the foam, one notices that the strain is very small for the first half of the cycle and then large and constant for the second half.
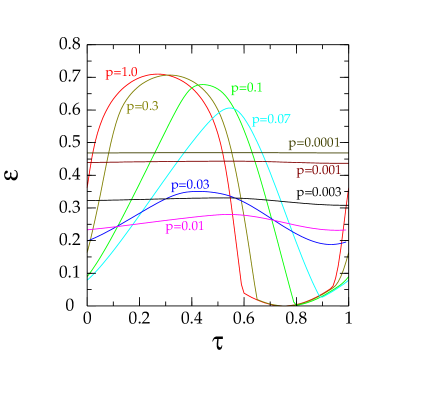
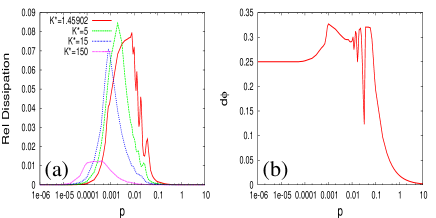
On figure 4 we present the time evolution of the foam strain during one cycle. For large values of , the strain oscillates between and while for very small value it is nearly constant, just below . In the former case, the foam does not dissipate much and the load is transferred nearly unaffected by the foam. In the later case, on the other hand, the foam is very dissipative and the foam adopts a constant strain effectively averaging over the load it is subjected to. It is also interesting to note that there is a range of values around where the strain of the foam is nearly constant but with a very small value (). This is the value of such that the inside deformation of the foam are attenuated over a length scale comparable to the thickness of the foam. As a result, the foam is optimally absorbing. This is well illustrated on figure 5 where we show the relative absorption of the foam as a function of for various values of the nonlinear elasticity parameter . The maximum, which does not vary much with , lies mostly in the range to . When the foam is very stiff and the penetration much smaller, explaining the small absorption. Moreover, we can see from Figure 5.b that the phase difference between the excitation and the foam deformation is larger than degrees in the region of maximum absorption. There is thus a partial phase opposition between the stress and the induced strain which results in the nearly constant low strain of the foam as described above.
We have also considered a square pulse given by and and we have observed a similar behaviour of the foam. While of the oscillation profile inside the foam changed, the absorption properties of the foam was very similar to the one obtained for a sinusoidal excitation.
In conclusion, we have derived an heuristic continuum model of dry foam deformation characterised by a non linear elastic response as well as a strain dependant friction term. We have fitted the value of our model to the experimental data of two foams which both exhibited a 6th order term for the inelastic term but a 6th and 4th power term for the strain dependence of the friction coefficient.
We have also studied the properties of the foam under large amplitude, periodic oscillation and have characterised a regime where the foam is optimally absorbing. The optimal range is frequency dependant and can be achieved by changing the thickness or the friction of the foam. This is potentially relevant for the design of protective foam pads to protect fragile objects during transport. One should use a foam where the amplitude of the stress is such that it strains the foam in its non-linear regime. This will depend mostly on and . If one can estimate the frequency of the excitations to which the object to protect will be subjected, for example for a parcel being transported, then one can determine the optimal thickness of the protective pad after measuring for the selected foam.
I Acknowledgements
BC thanks EPSRC for support via grant EP/I013377/1 and BBSRC via grant BB/J017787/1.
References
- (1) L. J. Gibson, and M. F. Ashby, Cellular Solids: Structure and Properties, Cambridge University Press, Cambridge (1997).
- (2) D. Wearie, and S. Hutzler, The Physics of Foams, Clarendon Press, Oxford (1999).
- (3) R. M. Christensen, Int. J. Solid. Struct., 37, 93 (2000).
- (4) M. F. Ashby et al. Metal Foams: A Design Guide, Butterworth-Heinemann, London (2000).
- (5) W. -Y. Jang, A. M. Kraynik, and S. Kyriakidis, Int. J. Solids Struct., 45, 1845 (2008).
- (6) A. M. Kraynik, D. A. Reinelt, and F. van Swol, Phys. Rev. E 67, 031403 (2003).
- (7) A. M. Kraynik, D. A. Reinelt, and F. van Swol, Phys. Rev. Lett., 93, 208301 (2004).
- (8) S. D. Papka, and S. Kyriakidis, Int. J. Sol. Struc., 36, 4367 (1999).
- (9) L. Gong, S. Kyriakidis, and W. -Y. Jang, Int. J. Solids Struct., 42, 1335 (2005).
- (10) W. -Y. Jang, S. Kyriakidis, and A. M. Kraynik, Int. J. Solids Struct., 47, 2872 (2010).
- (11) W. E. Warren, and A. M. Kraynik, J. App. Mech., 55, 341 (1988).
- (12) W. E. Warren, and A. M. Kraynik, J. Appl. Mech., 58, 367 (1991).
- (13) W. E. Warren, and A. M. Kraynik, J. Appl. Mech., 64, 787 (1997).
- (14) E. B. Matzke, Am. J. Botany, 33, 130 (1946).
- (15) A. N. Gent, and A. M. Thomas, J. Appl. Polymer Sci., 1, 107 (1959).
- (16) S. Gaitanaros, S. Kyriakidis, and A. M. Kraynik, Int. J. Solids Struct., 49, 2733 (2012).
- (17) G. Gioia, Y. Wang, and A. M. Cutiño, Proc. R. Soc. Lond. A, 457, 1079 (2001).
- (18) G. Pampolini, and G. Del Piero, J. Mech. Mater. Struct., 3, 969 (2008).
- (19) S. D. Papka, and S. Kyriakidis, Int. J. Sol. Struc., 36, 4397 (1999).
- (20) M. Avalle, G. Belingardi, and R. Montanini, Int. J. Impact Engng., 25, 455 (2001).
- (21) R. W. Ogden, Proc. Roy. Soc. A London, 326, 545 (1972).
- (22) A. Dorfman, and R. W. Ogden, Int. J. Solids Struct., 40, 2699 (2003).
- (23) S. W. White, S. K. Kim, A. K. Bajaj, and P. Davis, Nonlinear Dynamics, 22, 281 (2000).
- (24) G. Del Piero, and G. Pampolini, http://hal.archives-ouvertes.fr/docs/00/46/22/05/PDF/ICMM1_Pampolini_Dl_Piero.pdf