Observations of 6 200 m emission of the Ophiuchus cloud LDN 1688††thanks: Based on observations made with ISO, an ESA project with instruments funded by ESA member states (especially the PI countries: France, Germany, the Netherlands and the United Kingdom) and with the participation of ISAS and NASA. Herschel is an ESA space observatory with science instruments provided by European-led Principal Investigator consortia and with important participation from NASA.
Abstract
We examine two positions, ON1 and ON2, within the Ophiuchus cloud LDN 1688 using observations made with the ISOPHOT instrument aboard the ISO satellite. The data include mid-infrared spectra (6–12 m) and several photometric bands up to 200 m. The data probe the emission from molecular PAH-type species, transiently-heated Very Small Grains (VSGs), and large classical dust grains.
We compare the observations to earlier studies, especially those carried out towards an isolated translucent cloud in Chamaeleon (Paper I). The spectra towards the two LDN 1688 positions are very similar to each other, in spite of position ON1 having a larger column density and probably being subjected to a stronger radiation field. The ratios of the mid-infrared features are similar to those found in other diffuse and translucent clouds. Compared to paper I, the 7.7/11.3 m band ratios are lower, 2.0, at both LDN 1688 positions. A continuum is detected in the 10 m region. This is stronger towards the position ON1 but still lower than on any of the sightlines in Paper I. The far-infrared opacities are higher than for diffuse medium. The value of the position ON2, , is twice the value found for ON1.
The radiation field of LDN 1688 is dominated by the two embedded B type double stars, Oph AB and HD 147889, with an additional contribution from the Upper Sco OB association. The strong heating is reflected in the high colour temperature, 24 K, of the large grain emission. Radiative transfer modelling confirms a high level of the radiation field and points to an increased abundance of PAH grains. However, when the hardening of the radiation field caused by the local B-stars is taken into account, the observations can be fitted with almost no change to the standard dust models. However, all the examined models underestimate the level of the mid-infrared continuum.
keywords:
Infrared: ISM – ISM: clouds – ISM: molecules – dust, extinction1 Introduction
1.1 Background
The mid- to far-infrared (MIR, FIR) emission spectrum of the diffuse interstellar medium (ISM) and interstellar clouds has frequently been described via a three-component IR dust model (e.g. Puget & Léger 1989). Such models typically feature a mixture of (i) large aromatic organic ions or molecules producing the so-called Unidentified Infrared Bands (UIBs or UIR bands, also termed Infrared Emission Features, or IEFs) (Bakes et al. 2001 and references therein), (ii) a population of transiently-heated Very Small Grains, or VSGs, (Sellgren, 1984) generating mid- to far-IR emission, and (iii) larger ( Å) “classical” dust grains in thermal equilibrium emitting in the far-IR (m; e.g. Mathis 1996, Li & Greenberg 1997).
In Rawlings et al. (2005) (hereafter Paper 1), we presented an analysis of the relative contributions of these three components for G 300.2 -16.8, a local, isolated, high-latitude translucent cloud. Through a comparison of the relative contributions of the three components, it was demonstrated that the energy requirements of both the observed emission and optical scattered light could be accounted for by the incident local interstellar radiation field (ISRF) alone.
At the same time that G 300.2 -16.8 was observed, comparable observations were taken of other Galactic IR emission regions using the ISOPHOT instrument (Lemke et al., 1996) aboard the Infrared Space Observatory (ISO) (Kessler et al., 1996), to allow direct comparisons to be made between environments with strongly differing ambient ISRF strengths. One such region was LDN 1688, the main molecular cloud of the Ophiuchi cloud complex. There have been relatively few studies of high radiation field environments such as LDN 1688 in which a single dataset has been used to compare the mid- to far- IR emission spectra. Besides its wide wavelength coverage 3 – 240 m, ISOPHOT also had a large number of filter bands covering the mid- to far-IR wavelength range more uniformly than its successors (e.g. Spitzer, Werner et al. 2004 and Herschel, Pilbratt et al. 2010), important for specifying the different dust components.
1.2 LDN 1688 and its dust emission
The Oph star-forming cloud complex has been a target of many studies (for a review of the properties of the region, see e.g. Wilking, Gagné & Allen 2008), and contains numerous newly formed stars and embedded YSOs (Bontemps et al., 1996). It is now known to contain a star-forming cluster with 100 stars with ages Myr old (Padgett et al., 2008). Due to a combination of the presence of associated stars and large column densities of gas and dust, LDN 1688 exhibits strong multiple-component IR emission. Detailed analysis and modelling of IRAS observations of this region have been conducted by Bernard, Boulanger & Puget (1993).
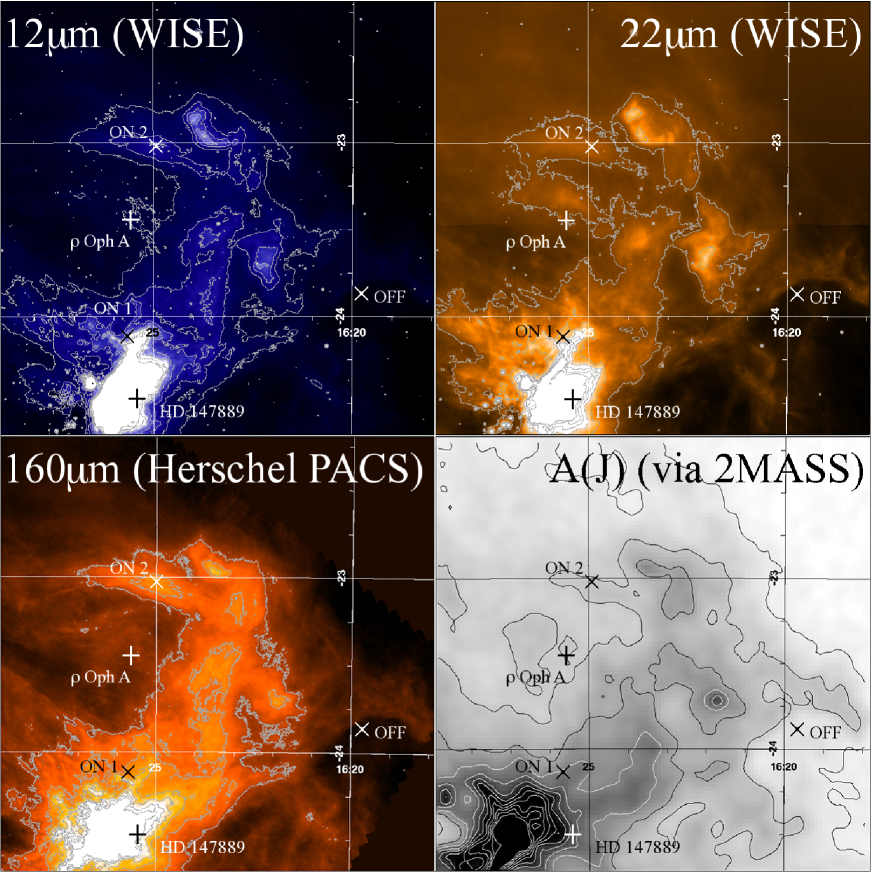
We present here ISOPHOT data between 6 and 240 m, showing observations of two ON-source positions in LDN 1688 and a nearby OFF position (see Fig. 1). In the spirit of the aforementioned three-component dust model, imaging at 12, 22 and 160 m are shown in Fig. 1 to reflect the distributions of the PAH, VSG and large, classical grains, respectively. Position ON1 is close to the central brightness maximum of the cloud containing the embedded star cluster. This position was previously found to exhibit a high IRAS / ratio (Bernard, Boulanger & Puget, 1993). The second sightline, ON2, is located in a dense filament at the Northern edge of the LDN 1688 cloud and is exposed to the external radiation from the Upper Scorpius OB association. It exhibited a low IRAS / ratio, implying that the local dust in this position has perhaps been subjected to different environmental effects, such as additional photoprocessing.
We present an analysis of the three dust components along the two sightlines. Section 2 details the observations and data reduction. Section 3 summarizes the main observing results and describes a semi-empirical modelling of the emission across the broad ISOPHOT wavelength range. FIR opacities and gas column densities are also estimated. In Sect. 4 we present a more detailed physical modelling of the mid- and far-IR emission based on radiative transfer calculations. The discussion of the results in Sect. 5 contains two main issues, (i) the radiation field in LDN 1688 and its role for the IR emission, and (ii) the properties of the dust components, especially as compared to the diffuse/translucent sightlines in G 300.2 -16.8 (Paper 1). On the basis of several basic assumptions about geometry and extinction, Appendix 5.1 presents a plausible description of the local ISRF components.
2 Observations and data reduction
2.1 Spectroscopic observations
22 raster spectra were obtained using PHT-S spectrophotometry mode (AOT 40) (Klaas et al., 1994).
The TDTs for these observations were 63901741 (OFF), 63901742 (ON2) and 63901743 (ON1).
The data reduction was performed using the ISOPHOT Interactive Analysis Program (PIA) Version V9.0 (Gabriel, 2000).
The OFF position spectrum only exhibited Zodiacal Light (ZL) emission, and no PAH features were seen.
The data were reduced to the AAP level, and then had the OFF position results subtracted.
Single PHT-SL spectra were obtained by using PIA to perform a statistically-weighted
average over the four positions. The final errors were generated automatically by PIA via the
propagation of the initial observational errors. It was found that significant deviation from the
averages of both the continuum and peak levels was seen at the OFF (1,1) raster position. This
was attributed to detector memory effects. The data at this single raster position were therefore
rejected, and the final averaged spectra were instead generated using the three remaining raster
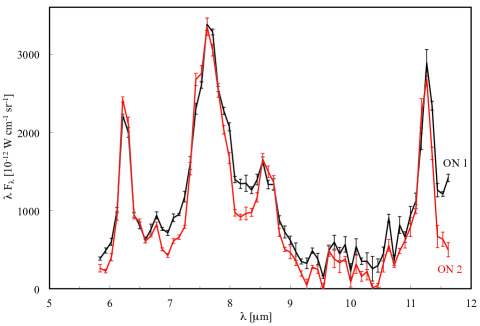
positions. The resultant spectra are shown in Fig. 2.
To obtain an independent check on the overall properties and calibration of the ISOPHOT dataset, a comparison with ISOCAM-CVF spectroscopy data obtained covering the ON1 position was conducted. The reduced and recalibrated ISOCAM datacube (Boulanger et al. 2005; Boulanger, private communication) was analysed using the Starlink Gaia software.
| Filter | Aperture | TDT | / | Absolute | Filter-To-Filter | Adopted Combined | ||||
| On-source (Off-source) | Accuracy | Relative Accuracy | Accuracy | |||||||
| [m] | [m] | [MJy sr | [MJy sr | [per cent] | [per cent] | [per cent] | [per cent] | |||
| (1) | (2) | (3) | (4) | (5) | (6) | (7) | (8) | (9) | (10) | (11) |
| ON1: 16h 25m 40.95s -24∘ 06’ 47.0”; (J2000.0) | ||||||||||
| P1_12.8 | 12.83 | 2.33 | 52” diam. | 83600152 (83600150) | 23.16a | 0.98a | 8 | 20 | 10 | 18 |
| P1_16 | 15.14 | 2.86 | 52” diam. | 83600155 (83600153) | 12.09a | 1.93a | 14 | 20 | 10 | 24 |
| P2_20 | 21.08 | 9.43 | 52” diam. | 83300258 (83300256) | 25.23a | 1.46a | 20 | 20 | 10 | 30 |
| P2_25 | 23.81 | 9.18 | 52” diam. | 83300261 (83300259) | 22.86a | 2.32a | 22 | 20 | 10 | 32 |
| C1_60 | 60.8 | 23.9 | 135”135” | 83300267 (83300265) | 169.66 | 1.04 | 8 | 25 | 20 | 33 |
| C1_70 | 80.1 | 49.5 | 135”135” | 84000170 (84000168) | 261.93 | 42.92 | 5 | 25 | 20 | 30 |
| C1_100 | 103.5 | 43.6 | 135”135” | 84000173 (84000171) | 484.99 | 3.63 | 2 | 25 | 20 | 27 |
| C2_135 | 150 | 82.5 | 181”181” | 84000176 (84000174) | 463.28 | 3.16 | 2 | 20 | 10 | 22 (12)b |
| C2_200 | 204.6 | 67.3 | 181”181” | 84000179 (84000177) | 359.95 | 5.03 | 2 | 20 | 10 | 22 (12)b |
| ON2: 16h 24m 55.52s -23∘ 00’ 50.3”; (J2000.0) | ||||||||||
| P1_16 | 15.14 | 2.86 | 52” diam. | 83600154 (83600153) | 6.89a | 1.89a | 14 | 20 | 10 | 24 |
| P2_20 | 21.08 | 9.43 | 52” diam. | 83300257 (83300256) | 18.61a | 1.52a | 20 | 20 | 10 | 30 |
| P2_25 | 23.81 | 9.18 | 52” diam. | 83300260 (83300259) | 13.21a | 2.20a | 22 | 20 | 10 | 32 |
| C1_60 | 60.8 | 23.9 | 135”135” | 83300266 (83300265) | 217.43 | 1.06 | 8 | 25 | 20 | 33 |
| C1_70 | 80.1 | 49.5 | 135”135” | 84000169 (84000168) | 322.84 | 50.90 | 5 | 25 | 20 | 30 |
| C1_100 | 103.5 | 43.6 | 135”135” | 84000172 (84000171) | 440.40 | 3.65 | 2 | 25 | 20 | 27 |
| C2_135 | 150 | 82.5 | 181”181” | 84000175 (84000174) | 409.28 | 3.08 | 2 | 20 | 10 | 22 (12)b |
| C2_200 | 204.6 | 67.3 | 181”181” | 84000178 (84000177) | 265.56 | 5.19 | 2 | 20 | 10 | 22 (12)b |
| OFF: 16h 19m 40.24s -23∘ 51’ 50.9”; (J2000.0) | ||||||||||
-
Column descriptions:
(1) Filter name; (2) Central wavelength, ; (3) Filter width, ; (4) Aperture size and shape; “diam.” denotes the diameter of a circular aperture, ‘135”135”’ and ‘181”181”’ denote the size of a square detector pixel; (5) ISO TDTs of observations, on-source and off-source; (6) (ON OFF) surface brightness, ; (7) Mean PIA-propagated internal error, , as described in Sect. 2.4 of Paper 1; (8) Mean external error (adopted from Paper 1, Sect. 2.4), , as a fraction of ; (9) Absolute accuracy (see Klaas et al. 1994); (10) Filter-to-filter relative calibration accuracy (see Paper 1); (11) Adopted combined accuracy. For the ZL-calibrated PHT-P data, this is taken to be + Filter-to-filter relative calibration accuracy. For the PHT-C data, in the absence of an independent (ZL) calibration curve, this is taken to be + absolute accuracy.
-
a
Values listed for the P1 and P2 bands are after ZL calibration.
-
b
The filter-to-filter relative calibration accuracy values listed for the C2 data were used to produce the error estimates in parentheses. These were used when estimating uncertainties on FIR temperatures (see Sect. 5.1 of Paper 1). These smaller values are justified for this purpose, as the two sets of measurements all use the same detector configuration and only differ in the filter used, and are thus not susceptible to cross-detector calibration uncertainties. The quoted values are based on an estimate of upper limits on remaining uncertainties due to responsivity variations derived in Paper 1.
-
c
Errors are listed in parentheses.
2.2 Photometric observations
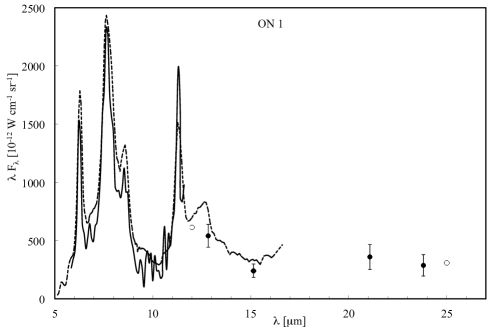
The photometric observations were performed in the filters that are listed in Table 1, along with their corresponding PHT-P aperture diaphragm sizes or the PHT-C camera field sizes and the observation TDTs. The region corresponding to the ON1 position was sampled over a square area matching the ISOPHOT aperture in both size and position, enabling an averaged spectrum to be extracted. The results are shown in Fig. 3. If an ISO-typical error of 17 per cent on the absolute flux levels is assumed for both spectroscopy datasets, the spectra are found to be in agreement, both in the IR band peaks and the continuum regions. The sparse map observing templates (AOTs 17/18/19: PHT-P and 37/38/39: PHT-C) were used for photometry (Klaas et al., 1994) for each filter.
2.3 Photometry reduction and error analysis
The photometric data reduction was performed using PIA Version V9.0 (Gabriel, 2000). The data reduction process as described in Paper 1 was used: the data were calibrated against the on-board calibration source FCS1, and the ZL. This latter was achieved via the ISOPHOT ZL template spectra of Leinert et al. (2002) and the colour-corrected monochromatic COBE/DIRBE fluxes at 3.5, 5, 12 and 25 m, under the assumption of blackbody behaviour. Signal drift correction and foreground subtraction were also performed as in Paper 1. In all of the filter bands, a clear excess signal is seen towards the ON positions. As in this earlier work, we list here estimate of internal and external errors. Unlike for the G 300.2 -16.8 photometry dataset, only single ON and OFF photometry measurements were obtained, making a statistical average calculation of the external errors, , not viable. However, the fractional external systematic errors are not expected to be larger than those in Paper 1. Since both these errors and the systematic calibration errors (Klaas et al., 2002) here arise from the same causes, we therefore adopt the statistical and systematic error estimates used in Paper 1 for the corresponding data in this work.
The adopted combined errors for the average (ON – OFF) signal listed in column 11 of Table 1 were obtained by arithmetically adding the statistical external errors (column 8) and the filter-to-filter systematic (calibration) errors (column 10).
When estimating the filter-to-filter accuracies at m and the absolute accuracies at all wavelengths, the results of the Klaas et al. (2002) investigation of ISOPHOT accuracies were adopted. The estimated absolute accuracies are given in column 9 of Table 1. As in Paper 1, although the absolute accuracies for m are 20 25 per cent, the filter-to-filter uncertainties for a single detector (e.g. C2) may be substantially smaller due to the elimination of most of the sources of error (see del Burgo et al. 2003, Sect. 4). Unlike the shorter-wavelength data, the absence of any independent calibration curve to aid cross-calibration for the m data dictated that the adopted combined errors for the average (ON – OFF) signal listed in column 11 of Table 1 be obtained by arithmetically adding the statistical external errors (column 8) and the absolute errors (column 9).
2.4 Extinction Mapping of LDN 1688
Although LDN 1688 is expected to be opaque at and , the 2MASS data can be used to derive near-infrared (NIR) colour excesses of stars visible through LDN 1688, and hence the NIR extinction. As in Lombardi, Lada & Alves (2008) and Paper 1, we have applied the optimized multi-band technique of Lombardi & Alves (2001), adopting and , following the extinction curve of Mathis (1990). The reference area for setting the absolute extinction levels was a 10’-radius region at 16h 0m 10.0s -24∘ 32’ 0.0”; (J2000.0). The resultant extinction map is shown in the lower-right panel of Fig. 1. The extinction for each map pixel was derived from the individual extinction values of stars by applying the sigma-clipping smoothing technique of Lombardi & Alves (2001) and using a Gaussian with FWHM = 4’ as a weighting function for the individual extinctions. This produced extinctions of at the ON1 position and at the ON2 position. The measured extinction at the OFF reference position was . Subtracting this from the ON position extinction values yielded for (ON1 – OFF) and for (ON2 – OFF).
3 ISOPHOT results and semi-empirical modelling
Figs. 2 – 4 show the data for the two observed positions as spectral energy distributions. The MIR spectra exhibit strong 7.7- and 11.3-m features. The underlying continuum emission, longward of 10 m and noted in Paper 1, is also present in LDN 1688.
As detailed in Paper 1, a semi-empirical fit to the MIR spectra is performed using a combination of Cauchy curves and a silicate continuum to model the molecular-level IR band emission, together with a modified blackbody fit for the thermal emission at longer wavelengths by large grains.
For the IR band emission, the fits are minimization fits to the PHT-SL data wherever available. For wavelengths longward of the PHT-SL wavelength coverage, the areas under the fitted curve were constrained to fit the colour-corrected integrated 12.8 (where available) and 16m ISOPHOT filter fluxes. For both sightlines, the resultant fits (shown in Fig. 4) reproduce the in-band integrated fluxes within 20 per cent of the photometrically-measured values.
The three longest-wavelength photometry points, C100, C135 and C200 are fitted using a modified blackbody function of the form . This function is individually convolved with each of the three ISOPHOT filter response curves in turn, and the temperature and scaling are adjusted to best fit the photometry. At positions ON1 and ON2, the temperatures of 23.5 K and 24.8 K, respectively, were obtained (Table 2).
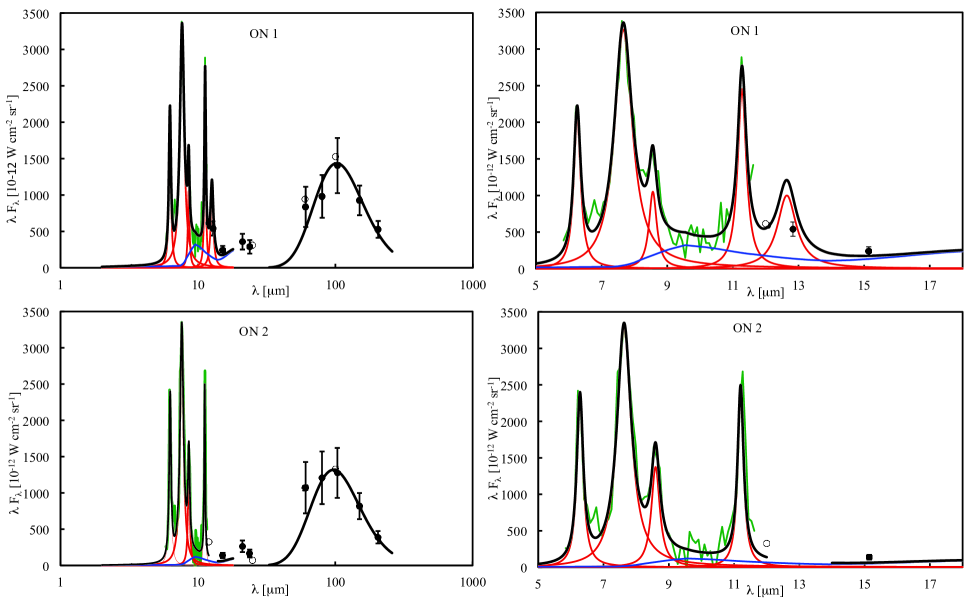
The resulting fits are shown in Fig. 4 and the parameters are listed in Table 2. It can be seen from Fig. 4 that in both cases, the middle range of the spectrum (25 70 m) exhibits additional emission that can be explained by the presence of a transiently-heated grain component. Physical grain population modelling is therefore required, and is described in Sect. 4. We also note that the continuum near 10 m appears to be a much less significant contribution than in Paper 1.
| Feature | Fit parameter | ON1 | ON2 |
|---|---|---|---|
| 6.2- | Central | 6.25 | 6.28 |
| band | Width | 0.26 | 0.24 |
| Height | 329.5 | 364.4 | |
| 7.7– | Central | 7.65 | 7.62 |
| band | Width | 0.66 | 0.53 |
| Height | 426.6 | 430.0 | |
| 8.6– | Central | 8.56 | 8.59 |
| band | Width | 0.28 | 0.31 |
| Height | 122.9 | 160.0 | |
| 11.3– | Central | 11.28 | 11.20 |
| band | Width | 0.32 | 0.22 |
| Height | 217.7 | 212.5 | |
| 12.7– | Central | 12.64 | – |
| band | Width | 0.7 | – |
| Height | 79.1 | – | |
| 7.7/11.3- band ratio | |||
| 10- continuum level | |||
| (average of over range) | |||
| Classical grains: equilibrium | 23.5 | 24.8 | |
| temperature, [K] | |||
| ON1 | ON2 | |
|---|---|---|
| cm | ||
| [MJy sr-1] | ||
| [MJy sr-1] | ||
3.1 Far-Infrared Opacity
We derive here an estimate of the ratio between the FIR optical depth at 200 m and the J-band optical extinction , , as well as the average absorption cross section per H-nucleon, .
For the case of optically thin emission and an isothermal cloud, the observed surface brightness is . Using the dust temperature values for ON1 and ON2 as given in Table 2, we have hence calculated the optical depths.
The total hydrogen column density is obtained from the values using the the vs. relationship as determined by Vuong et al. (2003) from X-ray absorption measurements of background stars in LDN 1688, . The resulting N(H) and values are given in Table 3. Vuong et al. (2003) noted that the ratio for the the general Galactic ISM is , i.e. some 15 to 40 per cent higher than for LDN 1688 (a effect).
4 Physical modelling
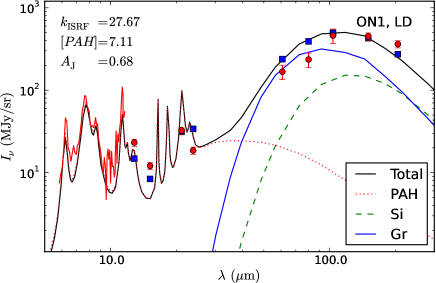
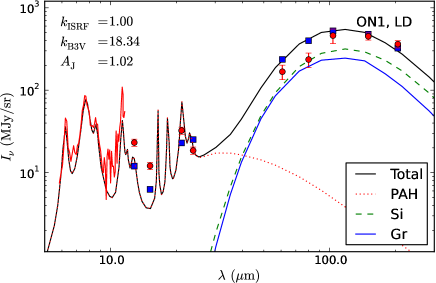
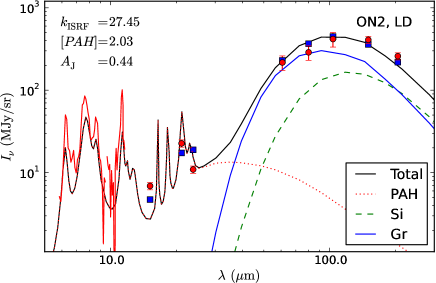
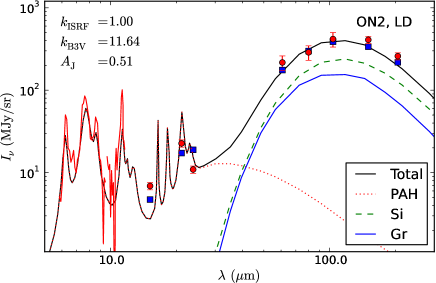
As an alternative to the semi-empirical fits presented above, we construct here radiative transfer models to explain the observations of the positions ON1 and ON2. We use spherically symmetric models that are intended to describe the average properties of these regions. The radiation field consists of the standard ISRF (Mathis, Mezger & Panagia, 1983) that is scaled, as necessary, to represent the higher intensities found in the cloud. We also examine the effect of an additional radiation field component that corresponds to the spectrum of a B3V star (Bruzual & Charlot, 2003). The modelling is completed using the dust model of Li & Draine (2001), hereafter referred to as the LD model. The LD model consists of PAHs, graphite grains, and silicate grains.
The radiative transfer models were optimised to reproduce the observations of dust emission and extinction. In the minimisation, the photometric measurements were weighted according to the error estimates. Below 12 m, we use the PHT-SL spectrum. Its weight is divided by the number of the frequency points to reduce its overall influence on the fits. We require that the opacity of the models (as measured through the centre of the model clouds) corresponds to observations. The weight of this constraint was determined by assuming a 20 per cent relative uncertainty for the observed values.
The LD models were constructed in part similarly to Paper 1. The model column density was kept as a free parameter although restricted by the measurements. In the first models, the scaling of the ISRF, , and the relative abundance of the PAHs are treated as additional free parameters (upper frames in Figs. 5 and 6). In the best fits, the PAH abundance and the radiation field intensity are raised far above the default values. For ON1, the best fit is obtained with and with the PAH abundance increased by a factor of 5. For the ON2 position, the corresponding numbers are 27 and 2. The opacity of the model clouds, as measured by , is less than half of the target value for ON1, while for ON2, is 10 per cent above the value derived from observations.
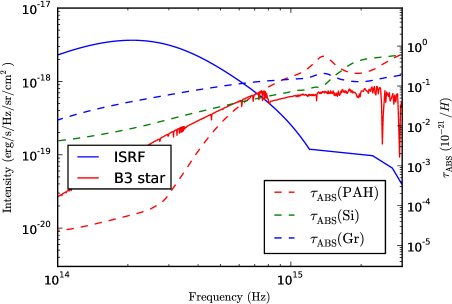
In the second set of models, the ISRF was fixed to the Mathis et al. (1983) value but we added another radiation field component that corresponds to the spectrum of a star with a spectral class of B3V. Fig. 7 compares the SED of the local ISRF with the spectrum of a B3V star. The same figure shows the extinction cross-sections for the dust components of the LD models. B3V star is clearly an efficient source of dust heating, especially in the case of the PAHs. In the modelling, the intensity of the B3V component was scaled with a factor , where a value of 1.0 corresponds to a radiation field energy equal to that integrated over the full ISRF spectrum (Mathis, Mezger & Panagia, 1983). The free parameters are thus the column density of the model and the factor (as indicated in the lower frames of Figs. 5 and 6). For ON1, the minimum is reached with = 18, while for ON2, the value is = 12. For the position ON1, the value is now within 20 per cent of the observed value, while for ON2 the value is 30 per cent above the observed value. The difference in the quality of the fits between the first and second set of models is not very significant. Nevertheless, the values are lower by 25 per cent for both ON1 and ON2.
We also tested the case in which both and were kept as free parameters. The results are very similar to the case in which only was varied but the value of decreases below one. However, the values are no longer well constrained because the radiation field is completely dominated by the B3V component.
5 Discussion
5.1 The Interstellar Radiation Field in LDN 1688
Our modelling in Section 4 of the 6 - 200 m emission at the two sight lines ON1 and ON2 (Figs. 5 and 6) indicated that, in order to fit the far-IR region, a radiation field enhanced by a factor of 20 - 30 is needed if a normal Solar Neighbourhood ISRF SED shape (Mathis, Mezger & Panagia, 1983) is assumed. The LDN 1688 cloud is, however, known to contain embedded early B type stars with an SED strongly increasing towards UV.
There are two other sources contributing to the ISRF in LDN 1688:
(i) near to mid-IR radiation from the rich embedded cluster of newly formed stars in the central molecular and dust core (Wilking, Gagné & Allen, 2008), and
(ii) external UV-optical illumination from bright early type stars of the Upper Sco OB association, mainly from the northern side of the Ophiuchus cloud complex.
Estimates of the three ISRF components are presented in Appendix A.
Among the three local components the dominating one is the radiation of the two embedded stars Oph AB and HD 147889. The local ISRF also dominates over the general ISRF (Mathis, Mezger & Panagia, 1983) by one order of magnitude. It is difficult to get an estimate for the intervening effective extinction in a scattering and clumpy medium between star and the line-of-sight dust. Therefore, we are not able to get a quantitative estimate better than within a factor of 3 – 4 of the modelled ISRF. Within these uncertainties, however, the ISRF model and the observationally derived values (Sect. 4) are in qualitative agreement with each other.
5.2 The dust properties
The ISOPHOT dataset for LDN 1688 describes the IR emission spectrum over a large wavelength range, encompassing emission from at least three dust grain populations, as also seen in Paper 1 in the case of the cloud G 300.2 -16.8. The column densities on the LDN 1688 lines-of-sight are higher, but by no more than a factor of 2 – 3. The radiation field is significantly higher in LDN 1688, however, as indicated by the FIR emission that is one order of magnitude higher than that of the the cloud G 300.2 -16.8 (see also Boulanger et al. 1996a). The different environments could be reflected in the properties of the emission from the (possibly ionized) aromatic molecular species, transiently-heated VSGs and big grains.
5.2.1 Mid-infrared emission features.
The MIR spectra at the positions ON1 and ON2 (see Fig. 2) show some differences but no large deviations are observed even compared to other diffuse and translucent sightlines (the cloud G 300.2 -16.8 included). The locations and widths of the PAH features are typical of those found in the ISM, including regions illuminated by nearby stars (see Tielens 2008). A comparison of the semi-empirical fitting results, listed for LDN 1688 in Table 2, and the diffuse sightlines examined by Kahanpää et al. (2003) also show good agreement between the central wavelengths and widths of the emission features with the only exception that the width of the 7.7-m feature is smaller in LDN 1688. The 12.7-m peaks also appear to be narrow in LDN 1688 but the feature is outside the ISOPHOT spectroscopic range, and is also the most likely feature to be affected by uncertainties associated with the presence of underlying small grain continuum emission.
In LDN 1688, the 7.7 / 11.3 m band ratio (ratio of the peaks of the features) is in both positions. This is lower that the values 2.6 – 3.4 found in G 300.2 -16.8. The result can be affected by details in the fit of the underlying continuum which is very strong in the case of G 300.2 -16.8. In G 300.2 -16.8, the continuum estimates depend mainly on the 10 m photometric measurements whose relative uncertainty was 25 per cent. The differences between LDN 1688 and G 300.2 -16.8 7.7 / 11.3 m ratios therefore remain significant. It is well within the variation seen on other Galactic ISM lines-of-sight (Chan et al., 2001; Tielens, 2008), however, and is small compared to the variation between galaxies (Galliano et al., 2008). The ratios can be attributed to differences in the ionization / recombination rates of the carrier species arising from the differences in ambient radiation field strengths.
5.2.2 Mid-infrared continuum.
As in Paper 1, our semi-empirical modelling includes a small grain component to accommodate the presence of a continuum around 10 m. This appears to be correlated with the mid-IR emission at 16 - 25 m of the aromatic emission features. The region around 10 m is traced more reliably thanks to the availability of PHT-SL spectra and the additional corroboration from the ISOCAM-CVF measurement at the position ON1 (Boulanger et al. 1996a). The continuum level is higher at position ON1 than at ON2. This is most clearly visible in the 10 m region, but can also be recognised as higher values around 7.0 m and 8.1 m between the PAH features. In contrast, the total signals (continuum + feature) at the peak positions of the PAH features (6.2, 7.7, 8.6, and 11.3 m) are practically the same for both ON1 and ON2.
Kahanpää et al. (2003) studied a number of Galactic diffuse lines-of-sight and, using the average spectrum, derived an upper limit of 10 per cent for the 10m continuum relative to the peak flux density of the 7.7 m feature. Using the average signal between 9.5 and 10.5 m as the continuum value for comparison, the ratio in LDN 1688 is 9 per cent for ON1 and 5 per cent for ON2. There is therefore no indication that the LDN 1688 sightlines significantly differ from the general ISM in this respect. In terms of the column density, G 300.2 -16.8 falls between LDN 1688 and the case of diffuse sightlines. There, however, the ratios of the 10 m continuum and the 7.7 m peak flux density were 20 per cent or above.
The stronger continuum at the ON1 positions of both LDN 1688 and (especially) G 300.2 -16.8 must be produced by VSGs or possibly even PAH-sized particles. The increased emission could result either from a higher abundance of such particles or from a greater radiation field intensity. In LDN 1688, the strong radiation of early B-type stars combined with the high extinction at the ON1 position could conceivably change the relative intensity of the MIR continuum and the UV-excited PAH features. A strong effect cannot be expected, however, because both emission components cover the same wavelength range. In G 300.2 -16.8, the radiation field is normal, and any explanation of the continuum must involve changes in the dust properties.
5.2.3 Comparison of MIR and FIR emission
The 12 m / 100 m and (especially) the 25 m/100 m surface brightness ratios had suggested strong differences between the LDN 1688 sightlines, with the ON2 position showing lower MIR emission. Boulanger et al. (1996a) already estimated that at position ON1, 60 per cent of the 12 m signal could be attributed to the continuum. The data are generally consistent with the higher spatial resolution ISO data. However, the 25 m measurement of the ON2 position is low compared to ISOPHOT P2_20 and P2_25 filter measurements and, therefore, the difference between ON1 and ON2 is smaller than in data. The difference in the spatial resolution should not play a significant role. The higher resolution WISE and Herschel maps show that the ON2 position coincides with a peak in the surface brightness (see Fig. 1) but the values vary by less than 20 per cent within the larger area covered by the IRAS beam.
We can compare the LDN 1688 and G 300.2 -16.8 sightlines quantitatively using the ISOPHOT filters C_100, C_135, and C_200 to trace the FIR emission and the filters P_16, P_20, and P_25 to trace the MIR emission longward of the main PAH features. With the in-band power values (see Table 2 in Paper I), we obtain MIR/FIR ratios of , , and for the three positions in G 300.2 -16.8. In LDN 1688, the corresponding ratios are and for positions ON1 and ON2, respectively. Thus, the LDN 1688 sightlines are very similar to the position ON3 in G 300.2 -16.8 regarding the ratio of MIR and FIR intensity, in spite of the very different radiation field. In LDN 1688, the MIR / FIR ratio is lower in position ON2 than in position ON1, the difference being only at a level. Using the FIR part of the spectra, we derived a large grain temperature of 24 K in both LDN 1688 positions. Based on the SED shape alone, there would not seem to be a large difference in the intensity of the heating radiation field. However, one must also take into account the difference in the opacities. For position ON1, the total optical depth was estimated to be twice as high as for the ON2 sightline. This would allow for a larger amount of cooler dust that is shielded from the external UV field.
5.2.4 Dust properties and the radiation field.
The physical modelling of Sect. 4 helps us to address the question of the relative importance of the intensity and spectrum of the heating radiation field and the possible variations in dust properties. By taking into account dust temperature variations within the model cloud, it could also result in slightly different estimates of . We examined the heating by B stars relative to the illumination by a similarly energetic radiation field with an SED corresponding to the normal ISRF. The spectra of both LDN 1688 sightlines could be fitted satisfactorily by assuming a normal ISRF-type SED scaled by a factor , and by increasing the relative abundance of PAH grains. For position ON1, the PAH abundance had to be increased almost by a factor of , whereas for position ON2, a factor of was sufficient. As discussed above, however, the radiation field is known to be affected by the high mass stars inside the Oph cloud and by the Upper Scorpius OB association. This justified the alternative models in which the radiation field contained a significant harder component corresponding to a B3V star. With this additional radiation field component, not only could the observations be fitted equally well, but in addition, no modification was needed in the dust model. This demonstrates the general degeneracy between the properties of the radiation field and the dust grain abundance. In the case of LDN 1688, it also suggests that the differences in the environmental conditions (the radiation field in particular) are not necessarily strongly reflected in the relative abundances of large grains, VSGs and PAHs. Nevertheless, one can note that the models underestimate the intensity between 10–20 m, i.e., a stronger continuum component is needed. Furthermore, while the models with a B3V stellar component and normal PAH abundance could fit the shortest wavelengths very well, the observed intensities at ON1 are underestimated towards the long wavelength end of the PHT-SL spectrum. The effect is rather subtle but may be another indication of the need for a larger VSG contribution. It could also suggest that the employed radiation field is already too hard, making the continuum too flat below 10 m. The actual LDN 1688 spectra may thus require not only a more intense UV field, but also some increase in the abundance of the PAH and VSG grains. In the models, this would decrease the values and probably improve the fits in the FIR regime where the observations appear to be more consistent with a lower large grain temperature.
In Sect. 3.1, we derived 200 m optical depths of and for the ON1 and ON2 positions respectively. The radiative transfer models including the B3V star radiation component resulted in similar values, for ON1 and for ON2, and thus do not significantly alter the previous estimates that were cm2 / H for ON1 and cm2 / H for ON2. The opacity is thus higher for the lower column density sightline ON2. Both numbers are higher than the values cm2 / H derived for high latitudes (Boulanger et al., 1996b). For the ON2 position, the value is actually similar to what has been reported for apparently much denser clouds (Hildebrand 1983; Beckwith et al. 1990; Martin et al. 2012; Lehtinen et al. 1998; see Table 8 in Paper I). It can be conjectured (for example) that photoevaporation caused by the strong UV fields has decreased the grain sizes at the ON1 position. This is not necessarily the case, however, because the dust opacities at both positions are still higher than in diffuse medium and, because of the lower opacity, ON2 should be even more susceptible to this process. It is more likely that differences in volume density play a role. The ON2 position lies at the centre of a filamentary structure and actually coincides with a local column density peak that is visible in (for example) the map (see Fig. 1). On the other hand, ON2 passes through a envelope of LDN 1688 that is likely to be more extended along the line of sight. In spite of the higher column density, the volume density along the ON1 sightline could be lower than for ON2. In this case, the difference in opacities could be explained by the growth of grain sizes in a dense environment. Both sources have similarly high colour temperatures, K, and the values are too low to completely shield the dust from the external UV field. Thus, these do not seem to be suitable sites for the formation of either ice mantles or large dust aggregates. In the case of ON2, however, the peak extinction could be underestimated because was derived from 2MASS stars at a relatively low spatial resolution. In the radiative transfer models, the dust temperatures were 20 K or higher, but if the density distribution is strongly peaked, the central extinction could be several times higher. This would allow the existence of a significant amount of dust below 15 K without it having a large effect on the SEDs.
6 Conclusions
Our ISOPHOT spectroscopic and spectrophotometric data for two positions within LDN 1688 have probed the properties of the main dust populations: PAH-like molecular species, transiently-heated VSGs and large, classical grains.
The mid-infrared molecular emission band spectra are not markedly different from those seen in other ISM environments, in spite of the strong local radiation field. The 7.7 m / 11.3 m band height ratio is 2.0 at both positions. This is lower than the values observed toward G 300.2 -16.8.
As in Paper 1, a population of molecular species and/or VSGs is needed to fit the 10 m continuum emission. The continuum is higher at the position ON1 than at the position ON2. Taking into account the high continuum levels in G 300.2 -16.8, this suggests that the variation is due to dust properties, rather than a direct effect of a high radiation field.
The strong local radiation field is reflected in the FIR colour temperature that is 24 K for both ON1 and ON2. However, regarding the the MIR/FIR emission ratios, LDN 1688 is still similar to the G 300.2 -16.8 ON3 position (Paper 1). The FIR opacity (/ and ) towards ON2 is approximately twice as high as towards ON1.
With plausible assumptions of the relative positions of the stars and the intervening extinction (see Appendix A), we conclude that the stars Rho Oph AB and HD 147889 dominate the local ISRF. The nearby Upper Sco OB association has a smaller contribution, mainly at the ON2 position. The total radiation field intensity is probably at least one order of magnitude above the value in the solar neighbourhood.
In radiative transfer models, the spectra at ON1 and ON2 can be fitted by increasing the local ISRF by a factor of 20 – 30 and the abundance of PAHs by a factor of a few. However, the modelling also reveals a strong degeneracy between the assumptions of the radiation field and the dust properties. The best fits are obtained by taking into account the harder radiation originating in the B-type stars, almost without any modification of the PAH abundance. However, all models underestimate the 10-m continuum.
The small differences between the sightlines can be understood by the higher optical depth of the sightline ON1 counter-balancing the higher intensity of the radiation field. The higher dust opacity towards ON2, in spite of the lower column density, could be related to higher volume density along that line-of-sight.
Acknowledgments
The authors wish to warmly thank the anonymous referee for the very thorough and constructive criticism which led to substantial improvements to this paper. The authors would like to thank François Boulanger for providing us with the correctly-calibrated ISOCAM-CVF datacube and Peter Ábrahám for use of his ZL template spectra. MGR gratefully acknowledges support from the Finnish Academy (grant No. 174854), the Magnus Ehrnrooth Foundation, the Joint Astronomy Centre, Hawaii (UKIRT), and the ALMA project. MJ acknowledges support by Academy of Finland grants 127015 and 250741. ISOPHOT and the Data Centre at MPIA, Heidelberg, are funded by the Deutsches Zentrum für Luft- und Raumfahrt DLR and the Max-Planck-Gesellschaft. KL acknowledges support by Academy of Finland grant 132291. DL is indebted to DLR, Bonn, the Max-Planck-Society and ESA for supporting the ISO Active Archive Phase. This research has made use of NASA’s Astrophysics Data System. This research has made use of the SIMBAD database, operated at CDS, Strasbourg, France. This publication makes use of data products from the Wide-field Infrared Survey Explorer, which is a joint project of the University of California, Los Angeles, and the Jet Propulsion Laboratory/California Institute of Technology, funded by the National Aeronautics and Space Administration.
References
- Bakes et al. (2001) Bakes E. L. O., Tielens A. G. G. M., Bauschlicher C. W., Jr., Hudgins, D. M., Allamandola, L. J., 2001, ApJ, 560, 261
- Bernard, Boulanger & Puget (1993) Bernard J. -P., Boulanger F., Puget J. L., 1993, A&A, 277, 609
- Bontemps et al. (1996) Bontemps S., André P., Tereby S., Cabrit S., 1996, A&A, 311, 858
- Beckwith et al. (1990) Beckwith, S. V. W., Sargent, A. I., Chini, R. S., Guesten, R., 1990, AJ, 99, 924
- Boulanger et al. (1996a) Boulanger F., et al., 1996, A&A, 315, L325
- Boulanger et al. (1996b) Boulanger F., et al., 1996, A&A, 312, 256
- Boulanger et al. (2005) Boulanger F. et al., 2005, A&A, 436, 1151
- Bruzual & Charlot (2003) Bruzual G., Charlot, S., 2003, MNRAS, 344, 1000
- Carrasco, Strom & Strom (1973) Carrasco L., Strom S. E., Strom K. M., 1973, ApJ, 182, 95
- Casassus et al. (2008) Casassus S., et al., 2008, MNRAS, 391, 1075
- Chan et al. (2001) Chan, K.-W., Roellig, T. L., Onaka, T., Mizutani, M., Okumura, K., Yamamura, I., Tanabé, T., Shibai, H., Nakagawa, T., Okuda, H., 2001, ApJ, 546, 273
- del Burgo et al. (2003) del Burgo C., Lauerijs R. J., Ábrahám P., Kiss, Cs., 2003, MNRAS, 346, 403
- de Jager & Nieuwenhuijzen (1987) de Jager C., Nieuwenhuijzen H., 1987, A&A, 177, 217
- de Zeeuw et al. (1999) de Zeeuw P. T., Hoogerwerf R., de Bruijne J. H. J., Brown A. G. A., Blaauw A., 1999, AJ, 117, 354
-
Gabriel (2000)
Gabriel C., 2000, PHT Interactive Analysis User Manual (V9.0)
www.iso.vilspa.esa.es/manuals/PHT/pia/um/pia_um.html - Galliano et al. (2008) Galliano F., Madden S. C., Tielens A. G. G. M., Peeters E., Jones A. P., 2008, ApJ, 679, 310
- Habing (1968) Habing H. J., 1968, BAN, 19, 421
- Hildebrand (1983) Hildebrand R. H., 1983, QJRAS, 24, 267
- Kahanpää et al. (2003) Kahanpää J., Mattila K., Lehtinen K., Leinert C., Lemke D., 2003, A&A, 405, 999
- Kessler et al. (1996) Kessler M. F. et al., 1996, A&A, 315, L27
- Klaas et al. (1994) Klaas U., Krüger H., Heinrichsen I., Heske A., Laureijs, R., eds, 1994, ISOPHOT Observers Manual, version 3.1.1
- Klaas et al. (2002) Klaas U. et al., 2002, ISOPHOT Calibration Accuracies, Version 5.0, SAI/1998-092/Dc
- Laureijs et al. (1995) Laureijs R. J., Fukui Y., Helou G., Mizuno A., Imaoka K., Clark F. O., 1995, ApJS, 101, 87
- Lehtinen et al. (1998) Lehtinen K., Lemke D., Mattila K., Haikala L.K., 1998, A&A, 333, 702
- Leinert et al. (2002) Leinert C., Ábrahám P., Acosta-Pulido J., Lemke D., Siebenmorgen R., 2002, A&A, 393, 1073
- Lemke et al. (1996) Lemke D. et al., 1996, A&A 315, L64
- Li & Draine (2001) Li A., Draine, B. T., 2001, ApJ, 554, 778
- Li & Greenberg (1997) Li A., Greenberg J. M., 1997, A&A, 323, 566
- Loinard et al. (2008) Loinard, L., Torres, R. M., Mioduszewski, A. J., Rodr guez, L. F., 2008, ApJ, 675, L29
- Lombardi, Lada & Alves (2008) Lombardi M., Lada C. J., Alves J., 2008, A&A, 489, 143
- Lombardi & Alves (2001) Lombardi M., Alves J., 2001, A&A, 377, 1023
- Martin et al. (2012) Martin, P. G. et al., 2012, ApJ, 751, 28
- Mathis (1990) Mathis J. S., 1990, ARA&A, 28, 37
- Mathis (1996) Mathis J. S., 1996, ApJ, 472, 643
- Mathis, Mezger & Panagia (1983) Mathis J. S., Mezger P. G., Panagia N., 1983, A&A, 128, 212
- Padgett et al. (2008) Padgett D. L. et al., 2008, ApJ 672, 1013
- Pilbratt et al. (2010) Pilbratt, G. L., Riedinger, J. R., Passvogel, T., Crone, G., Doyle, D., Gageur, U., Heras, A. M., Jewell, C., Metcalfe, L., Ott, S., Schmidt, M., 2010, A&A, 518, L1
- Poglitsch et al. (2010) Poglitsch, A. et al., 2010, A&A, 518, L2
- Puget & Léger (1989) Puget J. L., Léger A., 1989, ARA&A, 27, 161
- Rawlings et al. (2005) Rawlings, M. G., Juvela M., Mattila K., Lehtinen K., Lemke D., 2005, MNRAS 356, 810, Paper 1
- Sellgren (1984) Sellgren K., 1984, ApJ, 277, 623
- Sujatha et al. (2005) Sujatha N. V., Shalima P., Murthy J., Henry R. C., 2005, ApJ, 633, 257
- Tielens (2008) Tielens, A. G. G. M., 2008, ARA&A, 46, 289
- van Leeuwen (2007) van Leeuwen F., 2vanleeuwen007, A&A, 474, 653
- Vuong et al. (2003) Vuong M. H., Montmerle T., Grosso N., Feigelson E. D., Verstraete L., Ozawa H., 2003, A&A 408, 581
- Werner et al. (2004) Werner, M. et al., 2004, ApJS, 154, 1
- Whittet (1974) Whittet D. C. B., 1974, MNRAS, 168, 371
- Whittet et al. (2001) Whittet, D. C. B., Gerakines, P., Hough, J. H., Shenoy, S. S., 2001, ApJ, 547, 872
- Wilking, Gagné & Allen (2008) Wilking, B. A., Gagné, M., Allen, L. E., ed., Handbook of Star Forming Regions, Volume II: The Southern Sky. Astron. Soc. Pac., San Francisco, p. 351
- Wright, E. L. et al. (2010) Wright E. L. et al., 2010, AJ, 140, 1868
Appendix A The Interstellar Radiation Field in LDN 1688
The local ISRF in LDN 1688 is dominated by two B-type double stars.
Their distances, spectral types, luminosities, and extinctions are:
Oph AB: pc, B2V+B2V, 5800 L☉, mag,
HD 147889 AB: pc, B2IV+B3IV, 7800 L☉, mag.
The distances are from the revised HIPPARCOS catalogue of van Leeuwen (2007), spectral types from SIMBAD and Casassus et al. (2008), corresponding luminosities from de Jager & Nieuwenhuijzen (1987), and extinctions based on Carrasco, Strom & Strom (1973); Whittet (1974).
Using VLBA parallax measurements of two embedded stars, DoAr21 and S1, located close to HD 147889, Loinard et al. (2008) derived the distance pc, which we adopt here as the distance to LDN 1688.
The extinctions through the cloud at the sightlines of the stars (cf. Sect. 2.4), for Oph AB and for HD 147889, are clearly larger than the extinctions of the stars. Oph AB and HD147889 are surrounded by bright and extended blue reflection nebulae, vdB 105 and vdB 106 (cf. Fig. 1 of Wilking, Gagné & Allen 2008). We conclude that both Oph AB and HD147889 must be embedded in the cloud. Their distances are compatible with that of LDN 1688, i.e. 120 pc. Assuming that the stars and the dust in ON1 and ON2 are at the same distance of 120 pc from the Earth (i.e. all are in the plane of sky) we obtain the following values for their separations:
Oph AB to ON1 1.44 pc, to ON2 0.97 pc;
HD147889 to ON1 0.75 pc, to ON2 3.05 pc.
The presence and extension of the blue reflection nebulae also demonstrate that ON1 and ON2 are exposed
to substantial optical illumination from Oph AB. ON1 is exposed to illumination mainly from HD 147889.
In order to estimate more quantitatively the contribution to the ISRF by the stars, we make use of results by Habing (1968) for the ISRF at Å. For different spectral types, Table 3 of Habing (1968) lists the distance, , from a star at which the stellar contribution to the radiation density equals the average Solar neighbourhood ISRF value between Å (often denoted by ). For Oph AB and HD 147889, pc and 9.6 pc, respectively. We thus find the following ISRF contributions in Habing units for the case of no intervening extinction:
Oph AB at ON1 , at ON2 ;
HD147889 at ON1 , at ON2 .
For an estimate of the intervening extinction at 2000 Å influencing the light passing from each of the stars to position ON1 or ON2, we adopt, somewhat arbitrarily, half of the line-of-sight extinction through the cloud: for Oph AB both for ON1 and ON2, and for HD 147889 for ON2 but, because of the shorter traversed distance, (i.e. 1/3 of the full-distance value) for ON1. These values correspond to a model in which the cloud’s optical depth is transversely as large as along the line of sight. For the transformation from to (2000 Å ) we use the extinction parameter value , valid for the Oph cloud (Whittet et al., 2001). Part of the stellar light lost by extinction is returned to the forward direction by scattering. For complete forward scattering with albedo , the effective extinction is . With 0.4 and fairly strong forward scattering with at 2000 Å (Li & Draine, 2001), a substantial part of the scattering is not directed forwards. We nevertheless use the estimate which is motivated by the phenomenon that the penetration of scattered light is substantially favoured by a clumpy medium. The effective extinctions (2000 Å ) are thus:
Oph AB to ON1 and ON2 1.7 mag;
HD147889 to ON1 1.8 mag, to ON2 5.8 mag.
With these extinction corrections the the ISRF contributions by the two stars obtain the following estimates:
Oph AB at ON1 , at ON2 ; HD147889 at ON1 , at ON2 .
These values refer to the wavelength region 1000 - 2200 Å (Habing, 1968). The corresponding values referring to the total UV-to-near-IR ISRF as defined in Sect. 4, and added up for contributions from both stars, are the following:
(ON1) = 6.2 and (ON2) = 2.7.
The uncertainty is at least factor of 2 and is caused mainly by the uncertainty in the intervening extinction estimate. With no intervening extinction the values would be:
(ON1) = 26 and (ON2) = 11.
The radiation field estimates obtained in Sect. 4 (Figs. 5 and 6, lower panels) are larger by a factor of 3 – 4 when extinction is included. For the (unrealistic) case with no extinction, the agreement would be within 30 per cent.
Besides Oph AB and HD 147889, other members of the Upper Scorpius OB association also contribute to the radiation field in LDN 1688. With a distance of 144 pc to the centroid ( deg, deg) of the early type stars in the association (de Zeeuw et al., 1999) and using the radiation parameter pc as given in Habing (1968) we find a contribution of for no intervening extinction. Because the treatment with a point source at its centroid is not a good approximation for the widely distributed association of stars, we have also calculated separately the contributions of the following eight dominating early B type stars: Oph, Oph, Sco A, Sco, Sco, Sco, Sco, Lib (Sujatha et al., 2005). The result is for ON1 and for ON2, the largest contribution of coming from the O9 V type star Oph. Thus, the contribution by the Upper Scorpius OB association falls clearly below that of Oph AB and HD 147889 but may be relevant for ON2 which is close to the northern surface of LDN 1688 at which most of the radiation from the association is impinging.
We note that Laureijs et al. (1995) have estimated the contribution of Upper Sco OB to the radiation field impinging the L134/183 dark cloud complex, located on the northern side (at deg, deg, pc) of the association but further away from it ( pc) than LDN 1688. Using Habing’s (1968) results they found a contribution at 1000 – 2200 Å corresponding to .
The cluster of newly-born stars (Wilking, Gagné & Allen, 2008) embedded in the dense molecular core ’ West of HD 147889 is also a potential source of additional ISRF, at least for position ON1. Its near- and mid-IR radiation could be sufficient to contribute to the heating of the big grains. Using / DIRBE maps we determined the mean surface brightness of the cluster at 2 – 240 m within a circle of radius. An observer located at position ON1 would see this same surface brightness over about half the sky (2 steradians). When multiplied with the absorption coefficient of the Li & Draine (2001) dust model, we find that the total absorbed energy from this radiation source corresponds to half of the energy absorbed from an isotropic Mathis, Mezger & Panagia (1983) ISRF (i.e. ). We therefore conclude that this radiation field component is not important for the dust heating in LDN 1688.