Radio and -ray follow-up of the exceptionally high activity state of PKS 1510089 in 2011
Abstract
We investigate the radio and -ray variability of the flat spectrum radio quasar PKS 1510089 in the time range between 2010 November and 2012 January. In this period the source showed an intense activity, with two major -ray flares detected in 2011 July and October. During the latter episode both the -ray and the radio flux density reached their historical peak. Multiwavelength analysis shows a rotation of about 380∘ of the optical polarization angle close in time with the rapid and strong -ray flare in 2011 July. An enhancement of the optical emission and an increase of the fractional polarization both in the optical and in radio bands is observed about three weeks later, close in time with another -ray outburst. On the other hand, after 2011 September a huge radio outburst has been detected, first in the millimeter regime followed with some time delay at centimeter down to decimeter wavelengths. This radio flare is characterized by a rising and a decaying stage, in agreement with the formation of a shock and its evolution, as a consequence of expansion and radiative cooling. If the -ray flare observed in 2011 October is related to this radio outburst, then this strongly indicates that the region responsible for the -ray variability is not within the broad line, but a few parsecs downstream along the jet.
keywords:
radiation mechanisms: non-thermal - gamma-rays: observations - radio continuum: general - galaxies quasars: individual (PKS 1510089)1 Introduction
Relativistic jets are one of the most powerful manifestations of the
release of energy produced by supermassive black holes in active
galactic nuclei (AGN). Their emission
is observed across the entire electromagnetic spectrum,
from the radio band to rays, and it is due to relativistic
particles producing synchrotron radiation in low energy bands (from
radio to optical/X-rays), which may also give rise to high-energy
emission by inverse Compton processes.
The discovery of -ray emission from
relativistic jets in AGN represented a breakthrough in our understanding
of the physical processes involved.
Important clues on the jet physics have been obtained by the study of
the blazar population. Blazars are radio-loud AGN whose jet axis is closely
aligned with our line of sight. In these objects the jet emission is highly
amplified due to Doppler boosting effects, and a high level of
variability is detected at all wavelengths. In particular, blazars
with strong -ray emission are brighter and more luminous at
radio frequencies (Kovalev et al., 2009), have faster jets
(Lister et al., 2009a), and
higher variability Doppler factors (Savolainen et al., 2010) with respect to
those without significant -ray emission.
Despite decades of efforts, many aspects of the physics of
relativistic jets remain elusive. In
particular, the location and the mechanisms responsible for the high-energy
emission and the connection of the variability at different
wavelengths
are among the greatest challenges in the study of AGN. Recently,
observations performed with the Very Long Baseline Array (VLBA),
which allow sub-milliarcsecond angular resolution,
suggested that the region responsible for the high-energy emission
is located downstream along the jet at a distance of a few parsecs
from the central AGN (e.g. Marscher et al., 2008; Larionov et al., 2008).
On the contrary, following the causality argument, the
very short time scale variability detected at rays
may imply that high energy emission is produced in a small region. If
the size of the emitting region is related to the jet cross sectional
radius, this suggests a location within the Broad Line Region (BLR, 1 pc)
(e.g. Tavecchio et al., 2010).
If we consider that the entire cross section of the jet is responsible for the -ray emission,
this scenario is rather difficult to
reconcile with its location at a distance of several parsecs from the
central black hole (e.g. Sikora et al. 2008; Marscher et al. 2010), unless
the collimation angle of the jet is extremely small.
For example, in the case of PKS 1510089 Jorstad et al. (2005) derived a half-opening angle of 0∘.2 and the corresponding radius of the jet cross section at about ten pc is 1017 cm (Marscher et al., 2010).
Another explanation may involve turbulence in the jet flow.
Marscher (2011) suggested that a
turbulent multi-zone model may be able to describe the
high-energy emission produced along the
jet, several parsecs away from the central engine. In this model, the
short -ray variability may be caused by a turbulent
jet plasma that passes through a standing shock along the jet.
Recent multiband studies of
blazars suggested that the high-energy emitting region is at parsec-scale
distances from the central black hole. For example, in the blazar OJ 287
two major outbursts at millimeter wavelengths
from a jet feature occurred almost
simultaneously with both optical and -ray flares, suggesting that
radio, optical and -ray variability is produced in a
single region along the jet located about 14 pc downstream from the
central engine (Agudo et al., 2011a). Further evidence for a
location of the high-energy variability at few parsecs from the broad
line region was provided by the study of
the multiwavelength outbursts in the blazars AO 0235+164 and 3C 345
(Agudo et al., 2011b; Schinzel et al., 2012).
Among the blazar population, the flat spectrum radio quasar (FSRQ)
PKS 1510089 is one of the most
active objects where quiescent periods are interspersed with high
activity states with abrupt flux density increase at all wavebands
(e.g. Venturi et al., 2001; Jorstad et al., 2001; Tornikoski et al., 1994). PKS 1510089 was
discovered as a -ray source by EGRET, and
it is one of the three FSRQs detected at very-high-energy (VHE, E 100
GeV) by MAGIC and H.E.S.S. (Cortina 2012, Wagner 2010).
During the EGRET era the -ray emission of
PKS 1510089 was found to be only slightly
variable (Hartman et al., 1999).
However, since 2008 the source has entered a very active period and
many rapid and intense flaring episodes have been detected by AGILE
and Fermi
(e.g. Pucella et al., 2008; D’Ammando et al., 2009; Abdo et al., 2010a; D’Ammando et al., 2011).
Moreover, the high
variability level detected in rays has been observed
across the entire electromagnetic spectrum.
Optical and radio outbursts seem to follow the high activity
states in rays with time delays of a few days in the
optical, up to a few months as we consider the longer wavelengths of
the radio band (Abdo et al., 2010a). Furthermore the strong -ray
flares observed in 2008 September and 2009 April are likely related to
the ejection of a new superluminal jet component
(Marscher et al., 2010). However, not all the -ray flares have
the same characteristics in the various energy bands
(e.g. D’Ammando et al., 2011) making the interpretation of the mechanism
responsible for the high-energy emission not trivial.
Of particular interest is the second half of 2011, when some intense
rapid -ray flares were detected.
The first rapid flare was observed on
July 4 by AGILE and Fermi (Donnarumma et al., 2011; D’Ammando & Gasparrini, 2011).
The second episode started on October 17 and reached the maximum on
October 19 (Hungwe et al., 2011).
During the latter flare the source reached its highest -ray flux,
becoming the second brightest AGN ever observed by Fermi.
Triggered
by this extreme -ray activity, multifrequency radio VLBI and
single-dish observations
in the centimeter and millimeter bands were performed. In this paper we
investigate the connection of the -ray activity detected by the
Fermi Gamma-ray Space Telescope with the
emission at lower frequencies, focusing on the two main -ray
flares which occurred in 2011 July and October.
The paper
is organized as follows: in Section 2 we describe the radio
data from VERA, VLBA, Medicina, F-GAMMA,
and OVRO observations.
In Section 3 we report the analysis of the Fermi-LAT
data.
In Section 4 we present the results of the radio and -ray comparison,
while discussion and concluding remarks
are presented in Sections 5 and 6, respectively.
Throughout this paper, we assume the following cosmology: , and
, in a flat Universe.
At the redshift of the target, = 0.361 (Thompson et al., 1990),
the luminosity distance is
1913.2 Mpc, and 1 arcsec = 5.007
kpc.
2 Radio data
2.1 VERA observations
From 2010 November to 2012 January, PKS 1510089 was observed with
four VERA (VLBI Exploration of Radio Astrometry)
stations at 22 GHz using the left hand circular polarization (LHCP)
feed only, typically twice per month,
for a total of 32 observing epochs, within the framework of the
Gamma-ray Emitting Notable-AGN monitoring by Japanese VLBI (GENJI)
programme (for more details see Nagai et al., 2012a).
Observations of PKS 1510089 were
spread into several scans of about 5 minutes each, for a total
on-source observing time of about 15–30 minutes for each run.
Data reduction was performed using the NRAO’s Astronomical Image
Processing System (AIPS). A-priori amplitude calibration was
derived with the AIPS task APCAL
on the basis of the measurements of the system temperatures
and the antenna gain information for each VERA antenna. Uncertainties
on the amplitude calibration are within 10%. The source is
strong enough to allow the fringe fitting with a solution interval of
one minute to preserve the phase coherence. Final images were produced
after a number of phase self-calibration iterations. The flux density
was derived by means of the AIPS task JMFIT which performs a Gaussian
fit on the image plane. The typical resolution is about
(1.51.0) milliarcsecond. Total intensity flux densities are reported in
Table 1.
2.2 MOJAVE data
We investigated the pc-scale morphology and
flux density variability at 15 GHz by means of 14-epoch VLBA
data from the MOJAVE programme (Lister et al., 2009b). The datasets span the
time interval between 2010 November and 2012 March. In addition,
we included also
observations performed in 2012 April and May,
in order to better characterize the
proper motion of the jet components likely ejected close in time with
the -ray flares.
We imported the calibrated uv-data into the NRAO AIPS
package.
For a proper comparison with the VERA data,
in addition to the full-resolution images, we produced
also low-resolution images in total intensity
considering the same uv-range of
the VERA data (i.e. from 50 to 170 M) and the same resolution.
To derive the polarization information we also produced
Stokes’ Q and U images. The flux density of
the core region
was derived by means of the AIPS task JMFIT which performs a Gaussian
fit on the image plane. Total intensity flux density and polarization
information are reported in Table 2.
2.3 Medicina observations
Since 2011 July, after the -ray flare detected by Fermi-LAT (D’Ammando & Gasparrini, 2011), PKS 1510089 has been monitored
almost once per month
with the Medicina single-dish telescope at 5 and 8.4 GHz.
Observations have been performed with the new Enhanced Single-dish
Control System (ESCS), which provides enhanced sensitivity and supports
observations with the cross scan technique. At each frequency the
typical on source time is 40 seconds and the flux density was
calibrated with respect to 3C 286. The flux densities at 5 and 8.4 GHz
measured with the Medicina telescope are listed in Table 3.
2.4 F-GAMMA observations
The cm/mm radio light curves of PKS 1510089 have been obtained within the
framework of a Fermi related monitoring program of
-ray blazars (F-GAMMA program, Fuhrmann et al. 2007, Angelakis
et al. 2008). The millimeter observations are closely coordinated with
the more general flux monitoring conducted by IRAM, and data from both
programs are included in this paper. The
overall frequency range spans from 2.64 GHz to 142 GHz using the
Effelsberg 100-m and IRAM 30-m telescopes and observations are
performed roughly once per month.
The Effelsberg measurements were conducted with the secondary focus
heterodyne receivers at 2.64, 4.85, 8.35, 10.45, 14.60, 23.05, and 32.0 GHz.
The observations were performed quasi-simultaneously with cross-scans,
that is slewing over the source position, in azimuth and elevation
direction with adaptive number of sub-scans for reaching the desired
sensitivity (for details see Fuhrmann et al., 2008; Angelakis et al., 2008).
Pointing off-set correction, gain correction,
atmospheric opacity correction and
sensitivity correction have been applied to the data.
The IRAM 30-m observations were carried out with calibrated cross-scans using the new EMIR horizontal and vertical polarization receivers operating at 86.2 and 142.3 GHz. The opacity corrected intensities were converted into the standard temperature scale and finally corrected for small remaining pointing offsets and systematic gain-elevation effects. The conversion to the standard flux density scale was done using the instantaneous conversion factors derived from frequently observed primary (Mars, Uranus) and secondary (W3(OH), K3-50A, NGC 7027) calibrators.
2.5 OVRO observations
PKS 1510089 is part of an ongoing blazar monitoring program at 15 GHz, the Owens Valley
Radio Observatory (OVRO) 40-m radio telescope. This
monitoring program includes over 1500 confirmed and candidate -ray loud
blazars above declination (Richards et al., 2011). The sources in this
program are observed in total intensity twice per week with a 4 mJy
(minimum) and 3% (typical) uncertainty. Observations are performed
with a dual-beam (each 2.5 arcmin FWHM) Dicke-switched system using
cold sky in the off-source beam as the reference. Additionally, the
source is switched between beams to reduce atmospheric variations. The
absolute flux density scale is calibrated using observations of
3C 286, adopting the flux density (3.44 Jy) from Baars et al. (1977).
This results in about a 5% absolute scale uncertainty, which is not
reflected in the plotted errors.
3 Fermi-LAT Data: Selection and Analysis
The Large Area Telescope (LAT) on board Fermi
is a -ray telescope operating from MeV to
GeV. The instrument is an array of identical towers, each
one consisting of a tracker (where the photons are pair-converted) and a
calorimeter (where the energies of the pair-converted photons are
measured). The entire instrument is covered with an anticoincidence detector
to reject the charged-particle background. The LAT has a large peak effective
area ( cm2 for GeV photons), an energy resolution
typically about , and a field of view (FoV) of about sr
with an angular resolution ( containment angle) better than 1∘ for
energies above GeV. Further details about the LAT are given by
Atwood et al. (2009).
The LAT data reported in this paper were collected over 15 months of Fermi operation, from 2010 November 1 (MJD 55501) to 2012 January 31 (MJD
55957). During this time the LAT instrument operated almost entirely in survey
mode. The analysis was performed with the ScienceTools software
package version v9r23p1. The LAT data were extracted within a
Region of Interest (RoI) centered at the radio location of
PKS 1510089.
Only events belonging to the ‘Source’ class were used. In
addition, a cut on the zenith angle111The zenith angle is
defined as the angle of a photon’s apparent origin to the
Earth-spacecraft vector. () was also applied to
reduce contamination from the Earth limb rays, which are produced by cosmic rays interacting with the upper atmosphere. The spectral analysis (from which we
derived spectral fits and photon fluxes) were performed with the post-launch instrument response functions (IRFs) P7SOURCE_V6 using an
unbinned maximum likelihood method implemented in the Science tool
gtlike.
The background model used to extract the -ray signal includes a Galactic diffuse emission component and an isotropic component. The model that
we adopted for the Galactic component is given by the file gal_2yearp7v6_v0.fits, and the isotropic component, which is the sum of the extragalactic diffuse
emission and the residual charged particle background, is parametrized by the file
iso_p7v6source.txt222http://fermi.gsfc.nasa.gov/ssc/data/access/lat/Background
Models.html. The
normalizations of both components in the background model were allowed
to vary freely during the spectral point fitting.
We examine the significance of the -ray signal from the sources by means of the Test Statistics (TS) based on the likelihood ratio test. The Test
Statistic TS = 2log(likelihood) between models with and without the source is a measure of the probability to having a -ray source at the
localization specified, which compares models whose parameters have
been adjusted to maximize the likelihood of the data given the model (Mattox et al., 1996). The source model used in gtlike includes all the point sources from the second Fermi-LAT catalogue (2FGL; Nolan et al. 2012) that fall within 20∘ from PKS 1510089.
In addition in the model we included also
the FSRQ TXS 1530131, at from the source, detected in flare by
Fermi-LAT on 2011 August 22 (Gasparrini & Cutini, 2011). The spectra of these
sources were parametrized by power-law functions, except for
2FGL J1504.31029, for which we used a log-parabola for its
spectral
modeling as
in the 2FGL catalogue. We removed from the model the sources having test
statistic TS 25 and/or fluxes below 1.010-8 photons cm-2s-1 over 15 months and repeated the fit. Thus a final fitting procedure has been performed with the sources within 10∘ from PKS 1510089 included with the normalization factors and the photon indices left as free parameters. For the sources located between 10∘ and 15∘ we kept the normalization and the photon index fixed to the values obtained in the previous fitting procedure.
The RoI model includes also sources at distances between 15∘ and
20∘ from the
target source, which can contribute to the total counts observed in the RoI due to the energy depended size of the point spread function of the instrument. For these
additional sources, normalizations and indices were fixed to the values of
the 2FGL catalogue.
Following the 2FGL catalogue the spectral model used for PKS 1510089
is a log-parabola,
dN/dE E/E (Landau et al., 1986; Massaro et al., 2004), where the parameter is the spectral
slope at the energy E0 and the parameter measures the curvature around the peak. We fixed the reference energy E0 to 259.6
MeV as in the 2FGL catalogue. The fit over the entire period 2010
November–2012 January (MJD 55501–55957)
in the 0.1–100 GeV energy range results in a TS = 20678, with
0.02, 0.01, and an integrated average
flux of (88.3 1.4) 10-8 photons cm-2
s-1. Using a power-law model the fit yielded to a TS = 20155,
with a photon index 0.02 and an integrated average flux of (90.1 1.3) 10-8
photons cm-2 s-1, corresponding to an isotropic -ray
luminosity of 1.61047 erg s-1. As a comparison
the isotropic
-ray luminosity over the first two years of Fermi operation is
1.81047 erg s-1, indicating that the source activity
remained quite high throughout the Fermi era.
Fig. 1 shows the Fermi-LAT -ray light curve
of PKS 1510089 during the 15 months considered in this paper using 1-week time
bins and the log-parabola spectral model. For each time bin the and
parameters were frozen to the value resulting from the likelihood
analysis over the entire period. If TS 10 the value of the fluxes were replaced by the 2- upper limits. The systematic uncertainty in
the flux is energy dependent: it amounts to at 100 MeV, decreasing to
at 560 MeV, and increasing to above 10 GeV (Ackermann et al., 2012).
Several prominent -ray peaks are clearly visible in the 1-week light
curve over 15 months. We produced two additional light curves focused on
the periods when the largest flares occurred:
2011 July 1–30 (MJD 55743–55773) and
2011 October
3–November 28 (MJD 55837–55893), using the log-parabola spectral
model with either 1-day (close to the peaks, corresponding to the time
bins with higher statistics) or 3-day time bins
(Fig. 2 and Fig. 3). The 2011 July and October flares are
characterized by a doubling time scale () of 2 days and 1
day, respectively.
The daily peak isotropic -ray luminosities are
1.61048 erg s-1 on July 4, 3.71048 erg s-1
on October 19, and 2.31048 erg s-1 on November 2, with an
increase of a factor of 10, 23, and 14, with respect to the average value. To
calculate these values we used the photon index obtained from a power-law
model estimated over the relative 1-week time bin: 0.05, 0.03, and
0.04, respectively.


| Obs. date | Obs. date | ||
|---|---|---|---|
| Jy | Jy | ||
| 2010/11/01 | 2.03 | 2011/08/16 | 2.29 |
| 2010/11/10 | 1.78 | 2011/08/17 | 2.29 |
| 2010/11/18 | 1.83 | 2011/08/19 | 2.41 |
| 2010/11/29 | 1.70 | 2011/09/07 | 2.78 |
| 2010/12/04 | 1.62 | 2011/09/13 | 3.23 |
| 2010/12/13 | 1.56 | 2011/09/14 | 3.04 |
| 2010/12/14 | 1.47 | 2011/09/16 | 3.27 |
| 2011/01/22 | 1.97 | 2011/10/25 | 5.82 |
| 2011/02/11 | 1.84 | 2011/10/29 | 5.97 |
| 2011/02/26 | 2.25 | 2011/11/02 | 5.92 |
| 2011/04/11 | 1.57 | 2011/11/07 | 5.78 |
| 2011/04/25 | 1.40 | 2011/12/23 | 5.45 |
| 2011/05/12 | 1.50 | 2012/01/13 | 4.63 |
| 2011/05/23 | 1.59 | 2012/01/14 | 4.53 |
| 2011/08/14 | 2.22 | 2012/01/19 | 4.45 |
| 2011/08/15 | 2.37 | 2012/01/20 | 4.49 |
| Obs. date | |||
|---|---|---|---|
| mJy | mJy ( % ) | deg | |
| 2010/11/29 | 1527 | 31 (2.0%) | 75 |
| 2010/12/24 | 1422 | 16 (1.1%) | 65 |
| 2011/02/20 | 1984 | 13 (0.7%) | 50 |
| 2011/02/27 | 1980 | 14 (0.7%) | 50 |
| 2011/03/05 | 2067 | 23 (1.1%) | 85 |
| 2011/05/21 | 1399 | 10 (0.7%) | 45 |
| 2011/07/24 | 1741 | 29 (1.7%) | 45 |
| 2011/08/26 | 2186 | 26 (1.2%) | 40 |
| 2011/10/03 | 3969 | 20 (0.5%) | 55 |
| 2011/12/12 | 6536 | 93 (1.4%) | 65 |
| 2011/12/29 | 6207 | 172 (2.8%) | 60 |
| 2012/01/14 | 5458 | 167 (3.0%) | 55 |
| 2012/03/04 | 4802 | 98 (2.0%) | 50 |
| 2012/03/27 | 4758 | 128 (2.7%) | 24 |
| Obs. date | ||
|---|---|---|
| 2011/07/12 | - | 1.300.05 |
| 2011/08/10 | 1.380.05 | - |
| 2011/09/08 | 1.360.11 | 1.440.11 |
| 2011/09/22 | 1.460.07 | 1.820.20 |
| 2011/10/13 | 1.530.05 | 2.080.05 |
| 2011/11/16 | 2.490.17 | 3.720.22 |
| 2011/12/01 | 2.850.15 | 4.100.15 |
| 2011/12/13 | 3.340.12 | 4.590.15 |
| 2012/01/03 | 3.700.20 | 5.300.40 |
| 2012/01/17 | 4.300.20 | - |
4 Results
4.1 Light curves
In 2011, PKS 1510089 showed high activity in the -ray energy
band, with
an average weekly flux between 100 MeV and 100 GeV of about
810-7 photons cm-2 s-1
(Fig. 1). The second half of 2011 is
characterized by two major flares which occurred
in July (Fig. 2) and
October (Fig. 3).
To compare the flux variability at high
( rays) and low (radio band) energies, we analyzed
millimeter/centimeter radio observations spanning a time interval between
2010 November and 2012 January, i.e. long enough to constrain any flux
density variation well before and after the main -ray
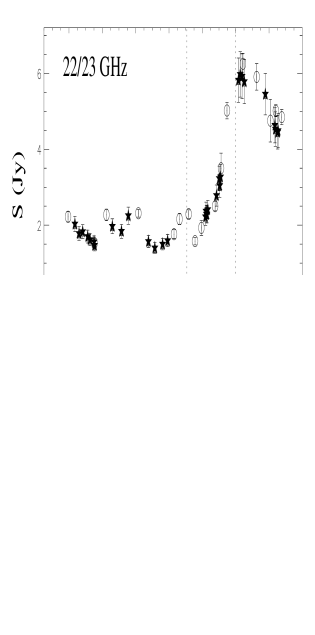
outbursts. In Fig. 4 we plot the radio light curves at
23 and 15 GHz, i.e. those frequencies with the best time sampling. The light
curves are characterized by subsequent increase and decrease of the
flux density.
Since 2011 September the flux density at both 15 and 23 GHz abruptly
increased, reaching its maximum at the beginning of November for the
23 GHz, followed with one-month delay at 15 GHz, when the peak was
observed around middle of December.
It is worth noting that the flux density on parsec scales
derived by VLBI data, i.e. VERA data at 22 GHz and VLBA data
at 15 GHz (triangles and stars in Fig. 4) strictly
follow the single-dish flux density trend, indicating that the
flux density variability is dominated by the parsec-scale emitting region.
In Fig. 5 we report the multifrequency light curves from
2.6 to 142 GHz, in order to compare the flux density behaviour at various
frequencies.
The abrupt flux density increase reported since the
beginning of September (Nestoras et al., 2011) is firstly detected above 22
GHz. At these frequencies the light curves show a structure similar to
a plateau starting from the time of the October -ray flare.
At lower frequencies the flux density increase is much smoother and
with some time delay (Orienti et al., 2011a).
4.2 Time delay
Statistical studies of the light curves of blazars showed that
the maximum flux density value reached during an outburst strictly
depends on the observing frequency and usually it is not
simultaneous at the various frequencies (e.g. Hovatta et al., 2008; Hughes et al., 2011).
In the shock scenario we expect that the peak occurs first in the
millimeter regime then followed with some time delay at the longer
wavelengths, as a consequence of jet opacity.
Time lags between
frequencies are thus important to constrain the properties of the shock at
the origin of the observed outburst.
The main problem in determining the characteristics of the light curves
depends on the time sampling of the observations at each
frequency: if observations are too sparse in time, the epochs
at which the flux density starts to rise and then peaks
cannot be constrained with adequate accuracy,
causing large uncertainties on the
parameters of the shock. This is particularly critical at
high frequencies where the variability is faster and the atmosphere
is more incoherent, making the measurements more difficult and with
larger uncertainties.
The analysis of the multifrequency light curves clearly indicates that
at the highest frequencies, 86 and 142 GHz, the flux density
reaches its maximum almost simultaneously at the end of September,
while at longer wavelengths it occurs after some time delay
(Fig. 5). In
Fig. 6 we report the peak flux density (upper panel)
and the time lag (lower panel), normalized at the 86-GHz
values, as a function of the frequency.
The time delay increases with the wavelengths, from about one month at
32 and 22 GHz, up to
several months in the decimeter regime (at 2.6 GHz). Although the
peak at 86 and 142 GHz seems to precede the high -ray
flare detected in October, the actual peak time could have been
missed during observations due to the sparse time coverage. For this
reason, we cannot exclude a simultaneity between the millimeter peak
and the -ray flare.
It is worth noting that the flux density
increase observed since 2011 September might be related to the
-ray flare detected in 2011 July. However, flares at millimeter
wavelengths often peak quasi-simultaneously with the -ray
flare (Abdo et al., 2010a), and
a delay of almost three
months at millimeter wavelengths is unusual. As a comparison, we
note that during the high activity states showed by PKS 1510089
in the first half of 2009, the peak at 230 GHz occurred about one
month after the -ray flare observed in 2009 March, and almost
simultaneously with the -ray flare detected in 2009 April (Abdo et al., 2010a).
Following the approach discussed by Valtaoja et al. (1992)
we computed the maximum relative flux
density scaled to the frequency at which the maximum occurs
(Fig. 7). Since the maximum peak flux density seems to
be at 86
GHz, we normalized the values to this frequency. In the shock scenario
we expect three different evolutionary epochs:
1) the growth stage at high frequencies, where the radiation is
optically-thin, 2) a plateau stage, where the turnover frequency moves
towards lower frequencies while the peak flux density is almost
constant, 3) a decay stage at low frequencies, where the peak flux
density is lower than in the plateau stage due to strong energy
losses. To study the evolutionary stages of the outburst that took
place in 2011 October, we fit the three parts of the
normalized spectrum with a power-law (Fig. 7). We
find a slope of 0.5, and -0.9 for the declining (between 10 and 5 GHz)
and the
rising part (between 142 and 86 GHz) respectively, and 0.06 for the
plateau (between 86 and 15 GHz).
The slope of the declining part has been
computed considering the 5 GHz as the lowest frequency, since at 2.6
GHz the flux density is still increasing in 2012 January.
The rising part is not
well-constrained due to the poor time sampling and
the large uncertainty on the flux density.


4.3 Parsec-scale properties
Single-dish observations cannot
separate the various contributions to the emission
and the flux density variability
originating in the central region, as
well as its polarization properties, may be washed out.
Observations with parsec-scale resolution are required to disentangle the
contribution of the core region from the emission arising from the jet
and extended features.
On the
parsec scale, the radio emission from PKS 1510089 is dominated by the
core component, from which the jet emerges with a position angle of
,
i.e. to the north-west direction (Fig. 8).
Fig. 9 shows the radio properties of the parsec-scale core
region obtained by means of high-resolution VLBA observations at
15 GHz. As pointed out in Section 4.1 the variability
shown by the source clearly originates in the core region. The core
light curve shows a strong increase starting from
2011 September. Simultaneously, the polarization percentage of the core
decreases, while the polarization angle remains almost constant. After
the -ray flare in 2011 October, the fractional polarization
increases from 0.5% of October, with a polarized
flux density of 20 mJy, to 3.0% measured
in 2012 January, when the polarized emission reached 170 mJy. On
the other hand, no significant changes were observed in
the electric vector position angle (EVPA), which ranges between
55∘ and 65∘ in the same period.
The analysis of the multi-epoch parsec-scale morphology of
PKS 1510089 points out that the jet component, labelled J in
Fig. 8, is moving outward from the core. To determine the
proper motion of the jet component we model-fitted
the visibility data
of each observing epoch with Gaussian components
using the model-fitting option in DIFMAP
(for a description of the model-fitting
procedure and the associated errors see Orienti et al. 2011b).
We performed the study of the
source structure using 15-GHz VLBA data from the MOJAVE programme,
since both the -coverage and
the sensitivity of the 22-GHz VERA data are not adequate.
The angular separation velocity
and time of zero-separation () from the core were derived by means of a
linear fit. In addition to the 16 MOJAVE epochs considered in this
paper, we also fit earlier epochs already published in
Orienti et al. (2011b). From this analysis we found that component J,
labelled N3 in Orienti et al. (2011b), is separating from the core with an
angular velocity of 1.50.1 mas/yr, which corresponds to an
apparent velocity of (33.42.2) (Fig. 10).
This value is larger than what was found by Orienti et al. (2011b) based on
five epochs only. The availability of additional 16 observing epochs allow
a more accurate estimate of the proper motion.
The time of zero-separation
is 2010.180.05, in agreement with the previous
estimate. Interestingly, the ejection of this component is close
in time with a -ray flare detected by AGILE on 2010 January (Striani et al., 2010).
The modelfit of the MOJAVE data sets did not reveal the ejection of a
new component until 2012 January. After this time the observations show
the presence of
a new feature that is moving away from the core. A linear fit of the
five epochs
in which the new component is detected (i.e. from 2012 January
to May), provides an angular separation rate of 0.920.35
mas/yr, which corresponds to an apparent separation velocity of
(20.57.8). From the regression fit we estimate that the time of
zero-separation occurred about 2011.83 (i.e. October 26), making the
ejection of the blob close in time with the -ray flare
detected in 2011 October. However, the large
uncertainties due to the availability of a few epochs spanning a
short time range do not
allow us to accurately constrain the precise time of zero separation,
which ranges between 2011.56 (i.e. July 23) and 2011.93 (i.e. December
5). Although the typical apparent speed measured for PKS 1510089
are usually larger than 15 supporting the idea that the new jet
component is related to the October -ray flare, we cannot
exclude that its ejection occurred close in time with the 2011 July
outburst.
4.4 Optical emission


Previous multifrequency studies of PKS 1510089
showed an irregular flux variability between -ray and
optical emission. D’Ammando et al. (2011) found that during the high
activity of 2009 March, the optical outburst occurred with about 1
day lag with respect to the -ray flare. On the other hand,
a lag of 131 days between the -ray and the optical peaks
was reported in Abdo et al. (2010a) for the 2009 January and April
flares. Furthermore, in the same period the strong -ray flare
that took place in 2009 April seems to coincide with the end of a 50 day
rotation of the optical polarization angle, suggesting a connection
between these two energy bands (Marscher et al., 2010).
To test possible connection between the -ray flaring
events with changes in the optical emission we make use of the optical
data from the Steward Observatory blazar monitoring program of the
University of
Arizona333http://james.as.arizona.edu/psmith/Fermi. A
description of this monitoring project, the calibration and the data
products can be found in Smith et al. (2009).
In Fig. 11 we show the V-band light curve and the
polarization percentage ( nm). The mean V-band
magnitude is 16.65, while the mean polarization percentage is
5%. No obvious trend between the optical emission and
the fractional polarization has been found.
Interestingly, no significant increase in the optical luminosity has been
detected just after the -ray
flare observed in 2011 July.
At the beginning of July the magnitude was 16.6
and the polarized percentage was 1%, well below the mean
value. This result is in
agreement with observations in R-band performed a few days after the
-ray flare, where the optical emission (R16.1)
is consistent with a
low activity state (Bachev et al., 2011). However, the -ray flare
occurred close in time with the end of a 7-day period during which the
optical polarization vector
rotates of about 380∘ (Fig. 12). The
beginning of the rotation of the optical polarization vector coincides
with a local maximum in the percentage of polarization, which was
about 5.7%, while the V-band magnitude was 16.4. The polarization
percentage dropped during the rotation, and it slightly increased at the end
of the period. The lack of observations after July 2
do not allow us to describe the polarization trends
soon afterward the -ray flare.
An increase in both the
optical emission and fractional polarization is detected a few weeks
later, at the end of July, when the V magnitude reached 16.4. The polarized
emission increased up to 8.6% and the optical polarization angle
rotates of about 60∘ in a 4-day period.
This optical outburst was more prominent in the R-band, where
the source magnitude reached 15.3 (Hauser et al., 2011).
This event occurred close in time with an enhancement of the -ray
flux (Fig. 2), and an increase of the radio polarization
percentage, while the radio polarization angle does not show
significant variation remaining stable between 40∘ and 60∘
(Fig. 8).
Unfortunately, during the huge -ray flare occurred in 2011 October
the source was not observable in the optical and no information is
available.
It is interesting to note the presence of an optical flare at the
beginning of 2011 January, when the V-band emission reached a
magnitude of 15.75 and the fractional polarization was about
25%. Then both the optical emission and polarization decreased
reaching a V-band magnitude of about 16.5 and a polarization percentage of
6.8%. During this 7-day period the optical polarization angle
rotates of about 40∘. Although
no high -ray activity was detected in this period, the optical
flare is close in time with a local maximum in the 22-GHz light curve
(Fig. 4).


5 Discussion
Multiwavelength monitoring
campaigns suggest a relation between -ray flares and
the radio variability,
explained in terms of a shock moving along the jet, whose
manifestation is a superluminal knot observable with
high-frequency VLBI observations
(e.g. Marscher & Gear, 1985; Valtaoja et al., 1992; Hughes et al., 2011). The shock
model implies: 1) a growth stage, when the shock forms up to the development
of its maximum, which is observed not simultaneously at the various
energy bands due to opacity effects (Compton losses dominate); 2) a plateau, when energy losses and
gains are balanced (synchrotron losses dominate); 3)
a decaying stage, when the shock fades due
to energy losses (adiabatic losses dominate).
However, not all the outbursts, even produced in the same
source, behave similarly. For example, not all the -ray flares
show a counterpart in the various energy bands.
A clear example is
represented by 3C 279 whose prominent -ray flare detected in
2009 February, and associated
with changes in the optical flux and polarization angle,
is not related to any variability in the radio
band, even considering some time delay (Abdo et al., 2010b). A similar case
is represented by the misaligned object 3C 84 where two major
-ray flares detected by Fermi-LAT and MAGIC do not have
an apparent counterpart in the radio band (Nagai et al., 2012b).
The FSRQ PKS 1510089 is one of those objects which does not show a
trivial connection between the light
curves behaviour at the various frequencies during different outbursts.
5.1 The high activity state in 2011
In the second half of 2011, PKS 1510089 became very active, with
two main flaring episodes occurring in July and October,
with a daily isotropic peak luminosity above 1048
erg s-1. The -ray light curve clearly shows the abrupt
increase of the flux associated with the two prominent flares, both
characterized by short time variability . Contrary
to what was observed in the case of the FSRQ 3C 454.3
(e.g. Abdo et al., 2011c), the -ray flares of PKS 1510089
are not preceded by
a plateau in the -ray light curve,
confirming the trend observed during previous
flaring episodes for this source.
On the basis of the short time
variability observed, we constrain the intrinsic size of the
-ray emitting region by means of the causality argument:
| (1) |
where is the relativistic Doppler factor and is
the redshift. Assuming , as typically found for this source
(e.g. D’Ammando et al., 2009; Abdo et al., 2010a), and of 2 days and 1 day
for the flares observed in 2011 July and 2011 October, respectively,
(see Section 3), we obtain a size of
7.61016 cm and
3.81016 cm for the former and latter flare,
respectively. These values are in agreement with what was found by the
analysis of the spectral energy distribution during the high activity
states between 2008 and 2009 (D’Ammando et al., 2009; Abdo et al., 2010a).
The analysis of the data from the multifrequency monitoring
campaigns obtained in the period considered in this paper
showed that high activity was also
observed at centimeter and millimeter wavelengths. In particular, the
good time sampling at 22/23 GHz allowed us to identify several high
activity states, one almost simultaneous with the 2011 July
-ray flare, when the flux density increased by about 60%
with respect to the minimum value measured in 2011
April. At lower radio frequencies no significant flux density increase
has been detected, while the lack of millimeter observations between
2011 June and 2011 September does not
allow us to investigate the variability at higher frequencies.
Interestingly, the 2011 July -ray flare seems to occur at the
end of a 7-day period in which the optical EVPA rotates of
about 380∘. A similar behaviour was shown by 3C 279 during
the strong -ray flare detected in 2009 February, which was
accompanied by an abrupt change of the optical EVPA, while in radio no
significant variability was observed (Abdo et al., 2010b).
An optical outburst was observed
almost three
weeks after the 2011 July -ray flare, when another
high activity -ray state was
observed (Fig. 2). This outburst is also accompanied by an
increase of both optical and radio polarization percentage, and a
rotation of the optical EVPA of about 60∘ in 4 days. On the
contrary, no significant change in the radio EVPA has been noticed.
The most interesting feature shown by PKS 1510089 is the huge
radio flare observed
since the beginning of 2011 September. Its multifrequency study indicates a
rising stage, first detected above 23 GHz,
and a decaying stage, as expected in the general shock model
(e.g. Valtaoja et al., 1992). The exceptional -ray flare detected in
2011 October and the maximum in the millimeter light curves occur
close in time, suggesting that the radio and -ray emission
originates in the same region.
If the onset of the millimeter
outburst is a consequence of the formation of a
shock, then the -ray flare detected in October
took place when the shock
already moved downstream along the jet. The distance between
the region where the shock formed and the site responsible for the
-ray emission may be determined by means of:
| (2) |
where is the apparent jet velocity, is
the speed of light,
is the time elapsed between
the onset of the millimeter outburst and the -ray flare in the
observer’s frame, and is the viewing angle (Pushkarev et al., 2010).
In this case is about 40
days: is computed from the 22 GHz data between
2011 September 9, i.e. when the flux density doubled its
value, and 2011 October 17, i.e. the detection of the -ray flare.
If we assume
= 25.4 (see Section 4.3)
we find that the -ray flare is produced at a projected
distance of 0.6 pc (i.e. 0.1 mas at the source redshift) from
the site where the shock detected in radio band
was formed. If we consider = 3∘, as derived from
previous studies of this source
(e.g Marscher et al., 2010; Orienti et al., 2011b; Lister et al., 2009c; D’Ammando et al., 2011; Abdo et al., 2010a),
we find that the de-projected
distance is about 10 pc. This result is in agreement with the idea
that at least some -ray flares do not take place
within the broad line region.
The parsec-scale distance of the site
responsible for the -ray variability may be reconciled with
the small size of the emitting region derived from Eq. 1, in
the case the high-energy emission is due to turbulent plasma crossing
a pre-existent standing shock, likely the radio core, located along the jet at several parsecs
away from the nucleus (e.g Marscher, 2011).
In this case,
a contribution of Synchrotron Self-Compton (SSC) in addition to
inverse Compton produced by scattering of the infrared photons from the dusty
torus (e.g. Sikora et al., 2008) may be at
the origin of the -ray emission
(e.g. Marscher, 2011; Marscher et al., 2010; Lähteenmäki & Valtaoja, 2003).
The multi-wavelength variability of PKS 1510089 during
2011 has some similarities with the radio-to--ray outburst of
the blazar BL Lacertae observed in 2005 (Marscher et al., 2008). Although
the time sampling of both the radio and optical observations are not
adequate for an accurate interpretation of the phenomena, we may speculate a
possible connection between the two main -ray flares
and the radio outburst of PKS 1510089 in
2011, as it was done for BL Lacertae.
In both sources the first high-energy flare coincides with an abrupt
rotation of the optical EVPA and the lack of significant flux density
variability at the longer radio wavelengths. The rotation of the
polarization angle suggests that the shock is likely produced by a
disturbance of the flow at the beginning of the jet. The perturbed flow
follows a spiral path as it propagates through the toroidal magnetic
field of the initial part of the jet, i.e. the acceleration and
collimation zone (Komissarov et al., 2007).
A support to this interpretation comes from the
decrease of the polarization percentage during the rotation, when the
mean magnetic field of the disturbance is roughly transverse to the
field of the unperturbed flow. The lack of significant radio
counterpart indicates that this flare is taking place close to the
central region of the AGN, where the radio emission is
self-absorbed. As the perturbed flow propagates downstream the jet the
opacity decreases, and the outburst becomes visible in the radio
regime starting from the millimeter band down to
longer wavelengths. The second high-energy flare would take place when
the knot encounters a standing
conical shock during its propagation along the jet. The perturbed flow
would be compressed by its passage through
the shock front. This would result in an amplification of the magnetic
field and an enhancement of its emission.
As the knot continues to
propagate it becomes visible as a superluminal jet component
detectable with the high-resolution VLBA observations.
In this scenario both gamma-ray flares would be produced by the same population of particles in two distinct moments (i.e. at distinct distances from the
central engine) by means of different mechanisms.
5.2 The long-term variability of PKS 1510089
The flaring activity shown by PKS 1510089 since the launch of AGILE
and Fermi-LAT has been characterized
by several outbursts with different properties.
In the period
2008 January–April, when
intense activity was detected in the
-ray, optical and millimeter regimes,
no similar trend was
found at the centimeter wavelengths (D’Ammando et al., 2009).
A similar behaviour was found by D’Ammando et al. (2011) during the high
activity period at the beginning of 2009 March.
Furthermore,
during the flaring episodes occurred in 2009 January, the optical
emission remained in a weak state (Marscher et al., 2010).
The flare
detected in 2011 July, characterized by a higher -ray luminosity
with respect to those previous
outbursts, occurred close in time with a significant rotation of the
optical EVPA, similar to what was observed in 2009 April. At 23 GHz there
is a hint of flux density increase, but the lack of observations at
higher frequencies does not allow us to reliably correlate the
-ray variability with the light curves at lower frequencies,
suggesting that opacity effects are dominant.
A different situation emerges from
the strong -ray
flares in 2008 September and 2009 April, which seem strictly related to
the ejection of superluminal jet knots and increase of the flux
density at high radio frequencies (Marscher et al., 2010; Orienti et al., 2011b).
The strong flare in 2009 April
is also associated with an exceptional optical flare, when it reached
its historical peak with an R-band magnitude of about 13.6
(Larionov et al., 2009), and a
large rotation of the optical and radio polarization
angle, indicating a common origin for the variability observed across
the entire electromagnetic spectrum.
This flaring episode is similar to the radio--ray behaviour
shown by the flare in 2011 October, when the initial phase of
the radio outburst seems to
precede the high energy variability.
However, these episodes do not share all the same
characteristics. Although the lack of optical information does not
allow a complete multiband comparison, the polarimetric properties
derived suggest a different behaviour between these two flares. In the
first case the increase of the radio flux density is accompanied by a
drop in the fractional polarization and a rotation of about
90∘ of the EVPA. This behaviour is in agreement with a shock
propagating perpendicular to the jet axis (Orienti et al., 2011b).
On the other hand, in 2011 October the
polarization percentage at 15 GHz reaches a minimum just before the -ray
flare, and then increases as the emission switches from
optically-thick to optically-thin at
this frequency. However, the EVPA changes by only 20∘,
which is difficult to reconcile with the propagation of a transverse
shock, but can be reproduced by an oblique shock.
In this case, the expected variations in the
polarization angle are strongly related to
the obliqueness of the shock itself and to the characteristics of the
magnetic field of the flow like its order and strength
(Hughes et al., 2011).
6 Conclusions
In this paper we presented results of the radio-to--ray
monitoring of PKS 1510089 from 2010 November to 2012 January.
Since 2011 July the source
became very active at high energies, reaching its
historical peak in rays in 2011 October.
A multifrequency analysis showed
that the rapid and strong -ray flare detected in 2011 July
is related to a rotation of the optical polarization angle
suggesting a common region responsible for both -ray and
optical emission. The lack of a simultaneous
increase of the flux density in the centimeter regime suggests that
the emitting region is close to the central AGN, at the beginning of
the jet, where the radiation is opaque at the radio wavelengths.
On the other hand, the strong flare in 2011 October seems to be
related to the huge radio outburst detected since the beginning of
2011 September
starting from the higher radio frequencies. In this case the radio
outburst seems to precede the -ray flare, suggesting that the
site responsible for the -ray emission is located along the
jet, about 10
parsec away from the central engine.
This strong flare seems also
related to the ejection of a new superluminal jet component from the
radio core.
As in the case of BL Lacertae, both -ray flares may be
interpreted by means of a single disturbance originated in the very
initial part of the jet, opaque to the radio wavelength. As the
perturbed flow propagates downstream the jet, the opacity decreases
and the variability becomes visible at longer wavelengths. As the flow
passes through a standing conical shock, that may be the radio core,
its emission is amplified and a second high-energy flare is
produced. In this case the dominant emission mechanism may be either inverse
Compton of infrared photons of the dusty torus or synchrotron
photons from the standing shock. However, a synchrotron self-Compton
origin cannot be ruled out. Then the
disturbance continues its way downstream the jet becoming visible as a
superluminal jet component by means of observations with
the milliarcsecond resolution reached by the Very Long Baseline
Interferometry (VLBI) technique.
It is worth noting that during 2011 the -ray and optical light
curves present additional high-activity states that complicate
this simple picture. Furthermore, the long term monitoring of
PKS 1510-089 indicates that neither all the high-energy flares have an
optical counterpart, like in the flaring episode occurring in 2009 January, nor all optical flares correspond to a
-ray flare, as in the case of the 2011 January episode.
Furthermore, the characteristics of the shocks may change
among the various flaring episodes, producing different polarization
properties as well as different light curve behaviours at the various
frequencies.
Acknowledgments
Part of this work was done with the contribution of the Italian
Ministry of Foreign Affairs and Research for the collaboration project
between Italy and Japan. The VERA is operated by the National
Astronomical Observatory of Japan. This work was partially supported
by Grant-in-Aid for Scientific Researchers (24540240, MK) from Japan
Society for the Promotion of Science (JSPS).
The Fermi LAT Collaboration acknowledges generous ongoing support
from a number of agencies and institutes that have supported both the
development and the operation of the LAT as well as scientific data analysis.
These include the National Aeronautics and Space Administration and the
Department of Energy in the United States, the Commissariat à
l’Energie Atomique
and the Centre National de la Recherche Scientifique / Institut
National de Physique
Nucléaire et de Physique des Particules in France, the Agenzia
Spaziale Italiana
and the Istituto Nazionale di Fisica Nucleare in Italy, the Ministry
of Education,
Culture, Sports, Science and Technology (MEXT), High Energy Accelerator Research
Organization (KEK) and Japan Aerospace Exploration Agency (JAXA) in Japan, and
the K. A. Wallenberg Foundation, the Swedish Research Council and the
Swedish National Space Board in Sweden. Additional support for science analysis during the operations phase is gratefully
acknowledged from the Istituto Nazionale di Astrofisica in Italy and the Centre National d’Études Spatiales in France.
This research is partly based on observations with the 100-m telescope of
the MPIfR (Max-Planck-Institut für Radioastronomie) at Effelsberg and with the
IRAM 30-m
telescope. IRAM is supported by INSU/CNRS (France), MPG (Germany) and IGN
(Spain).
This research has made use of the
data from the MOJAVE database that is maintained by the MOJAVE team
(Lister et al. 2009, AJ, 137, 3718). The OVRO 40-m monitoring program
is supported in part by NASA grants NNX08AW31G and NNX11A043G, and NSF
grants AST-0808050 and AST-1109911. Part of the research is based on
observations with the Medicina telescope operated by INAF - Istituto
di Radioastronomia. We acknowledge the Enhancement Single-Dish Control
System (ESCS) Development Team at the Medicina telescope.
Data from the Steward Observatory spectropolarimetric project were
used. This program is supported by Fermi Guest Investigator grants
NNX08AW56G and NNX09AU10G.
This research has made use of the NASA/IPAC
Extragalactic Database NED which is operated by the JPL, Californian
Institute of Technology, under contract with the National Aeronautics
and Space Administration.
References
- Abdo et al. (2010a) Abdo, A.A., et al. 2010a, ApJ, 721, 1425
- Abdo et al. (2010b) Abdo, A.A., et al. 2010b, Nature, 463, 919
- Abdo et al. (2011c) Abdo, A.A., et al. 2011c, ApJ, 733, L26
- Ackermann et al. (2012) Ackermann, M., et al. 2012, ApJS in press, [arXiv:1206.1896]
- Agudo et al. (2011a) Agudo, I., et al. 2011a, ApJ, 726, L13
- Agudo et al. (2011b) Agudo, I., et al. 2011b, ApJ, 735, L10
- Angelakis et al. (2008) Angelakis, E., Fuhrmann, L., Marchili, N., Krichbaum, T.P., Zensus, J.A. 2008, (arXiv:0809.3912)
- Atwood et al. (2009) Atwood, W. B., et al. 2009, ApJ, 697, 1071
- Baars et al. (1977) Baars, W. M., et al. 1977, A&A, 61, 99
- Bachev et al. (2011) Bachev, R., Boeva, S., Stoyanov, K., Semkov, E. 2011, The Astronomer’s Telegram, 3479
- Cortina (2012) Cortina, J. 2012, The Astronomer’s Telegram, 3965
- D’Ammando et al. (2009) D’Ammando, F., et al. 2009, A&A, 508, 181
- D’Ammando et al. (2011) D’Ammando, F., et al. 2011, A&A, 529, 145
- D’Ammando & Gasparrini (2011) D’Ammando, F., Gasparrini, D. 2011, The Astronomer’s Telegram, 3473
- Donnarumma et al. (2011) Donnarumma, I., et al. 2011, The Astronomer’s Telegram, 3470
- Fuhrmann et al. (2007) Fuhrmann, L., Zensus, J.A., Krichbaum, T.P., Angelakis, E., Readhead, A.C.S. 2007, The first Glast Symposium, 921, 249
- Fuhrmann et al. (2008) Fuhrmann, L., et al. 2008, A&A, 490, 1019
- Gasparrini & Cutini (2011) Gasparrini, D., Cutini, S. 2011, The Astronomer’s Telegram, 3579
- Hartman et al. (1999) Hartman, R.C., et al. 1999, ApJS, 123, 79
- Hauser et al. (2011) Hauser, M., Lenain, J.P., Wagner, S., Hagen, H. 2011, The Astronomer’s Telegram, 3509
- Hovatta et al. (2008) Hovatta, T., Nieppola, E., Tornikoski, M., Valtaoja, E., Aller, M. F., Aller, H. D. 2008, A&A, 485, 51
- Hughes et al. (2011) Hughes, P.A., Aller, M.F., Aller, H.D. 2011, ApJ, 735, 81
- Hungwe et al. (2011) Hungwe, F., Dutka, M., Ojha, R. 2011, The Astronomer’s Telegram, 3694
- Jorstad et al. (2001) Jorstad, S.G., Marscher, A.P., Mattox, J.R., Wehrle, A.E., Bloom, S.D., Yurchenko, A.V. 2001, ApJS, 134, 181
- Jorstad et al. (2005) Jorstad, S.G., et al. 2005, AJ, 130, 1418
- Komissarov et al. (2007) Komissarov, S.S, Barkov, M.V., Vlahakis, N., Königl, A. 2007, MNRAS, 380, 51
- Kovalev et al. (2009) Kovalev, Y.Y., et al. 2009, ApJ, 696, 17
- Lähteenmäki & Valtaoja (2003) Lähteenmäki, A., Valtaoja, E. 2003, ApJ, 590, 95
- Landau et al. (1986) Landau, R., et al. 1986, ApJ, 308, 78
- Larionov et al. (2008) Larionov, V.M., et al. 2008, A&A, 492, 389
- Larionov et al. (2009) Larionov, V.M., Konstantinova, T.S., Blinov, D. A. 2009, The Astronomer’s Telegram, 2045
- Lister et al. (2009a) Lister, M.L., Homan, D.C., Kadler, M., Kellermann, K.I., Kovalev, Y.Y., Ros, E., Savolainen, T., Zensus, J.A. 2009a, ApJ, 696, L22
- Lister et al. (2009b) Lister M., et al. 2009b, AJ, 137, 3718
- Lister et al. (2009c) Lister, M.L., et al. 2009c, AJ, 138, 1874
- Marscher & Gear (1985) Marscher, A.P., Gear, W.K. 1985, ApJ, 298, 114
- Marscher et al. (2008) Marscher, A.P., et al. 2008, Nature, 452, 966
- Marscher et al. (2010) Marscher, A.P., et al. 2010, ApJL, 710, L126
- Marscher (2011) Marscher, A.P. 2011, Fermi Symposium (arXiv:1201.5402v1)
- Massaro et al. (2004) Massaro, E., et al. 2004, AA, 413, 489
- Mattox et al. (1996) Mattox, J. R., et al. 1996, ApJ, 461, 396
- Nagai et al. (2012a) Nagai, H., et al. 2012a, PASJ, in press
- Nagai et al. (2012b) Nagai, H., et al. 2012b, MNRAS, 423, L122
- Nestoras et al. (2011) Nestoras, I., et al. 2011, The Astronomer’s Telegram, 3698
- Nolan et al. (2012) Nolan, P., et al. 2012, ApJS, 199, 31
- Orienti et al. (2011a) Orienti, M., D’Ammando, F., Giroletti, M., Orlati, A. 2011a, The Astronomer’s Telegram, 3775
- Orienti et al. (2011b) Orienti, M., Venturi, T., Dallacasa, D., D’Ammando, F., Giroletti, M., Giovannini, G., Vercellone, S., Tavani, M. 2011b, MNRAS, 417, 359
- Pucella et al. (2008) Pucella, G., et al. 2008, A&A, 491, 21
- Pushkarev et al. (2009) Pushkarev, A.B., Kovalev, Y.Y., Lister, M.L., Savolainen, T. 2009, A&A, 507, 33
- Pushkarev et al. (2010) Pushkarev, A.B., Kovalev, Y.Y., Lister, M.L. 2010, ApJ, 722, 7
- Richards et al. (2011) Richards, J. L., et al. 2011, ApJS, 194, 29
- Savolainen et al. (2010) Savolainen T., Homan D.C., Hovatta T., Kadler M., Kovalev Y.Y., Lister M.L., Ros E., Zensus J.A. 2010, A&A, 512, 24
- Schinzel et al. (2012) Schinzel. F.K., Lobanov, A.P., Taylor, G.B., Jorstad, S.G., Marscher, A.P., Zensus, J.A. 2012, A&A, 537, 70
- Sikora et al. (2008) Sikora, M., Moderski, R., Madejski, G.M. 2008, ApJ, 675, 71
- Smith et al. (2009) Smith, P.S., Montiel, E., Rightley, S., Turner, J., Schmidt, G.D., Jannuzi, B.T. 2009, Fermi Symposium, eConf Proceedings C091122, (arXiv:0912.3621)
- Striani et al. (2010) Striani, E., et al. 2010, The Astronomer’s Telegram, 2385
- Tavecchio et al. (2010) Tavecchio, F., Ghisellini, G., Bonnoli, G., Ghirlanda, G. 2010, MNRAS, 405, 94
- Thompson et al. (1990) Thompson D.J., Djorgovski S., de Carvalho R., 1990, PASP, 102, 1235
- Tornikoski et al. (1994) Tornikoski, M., Valtaoja, E., Teräsranta, H., Smith, A.G., Nair, A.D., Clements, S.D., Leacock, R.J. 1994, A&A, 289, 673
- Valtaoja et al. (1992) Valtaoja, E., Teräsranta, H., Urpo, S., Nesterov, N.S., Laincia, M., Valtonen, M. 1992, A&A, 254, 71
- Venturi et al. (2001) Venturi, T., et al. 2001, A&A, 379, 755
- Wagner (2010) Wagner, S. 2010, HEAD meeting, 11, 2706