The aperiodic variability of the Ultraluminous X-ray source in NGC 5408
Abstract
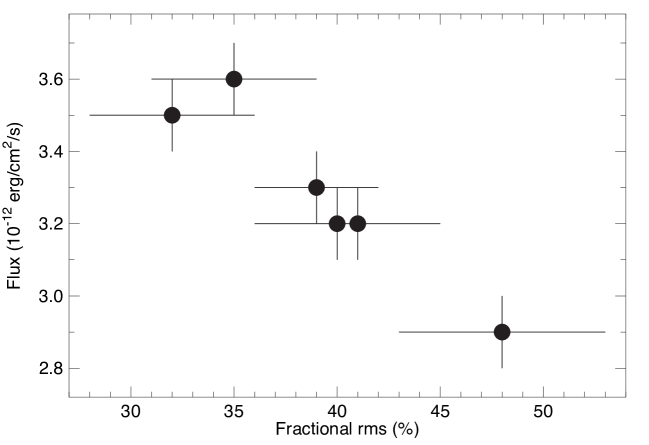
Ultra-Luminous X-ray sources are accreting black holes that might represent strong evidence of the Intermediate Mass Black Holes (IMBH), proposed to exist by theoretical studies but with no firm detection (as a class) so far. We analyze the best X-ray timing and spectral data from the ULX in NGC 5408 provided by XMM-Newton. The main goal is to study the broad-band noise variability of the source. We found an anti-correlation of the fractional root-mean square variability versus the intensity of the source, similar to black-hole binaries during hard states.
keywords:
accretion, accretion disks, X-rays: binaries, X-rays: general, X-rays: NGC 5408 X-11 Introduction
Ultra-Luminous X-ray sources (ULXs) are point like, off-nuclear, extra-galactic sources, with total observed X-ray luminosities () higher than the Eddington luminosity for a stellar-mass black-hole (). The true nature of these objects is still open to debate ([Feng & Soria 2011, Fender & Belloni 2012]) as there is still no unambiguous estimate for the mass of the compact object in these systems. If the emission is isotropic and the Eddington limit is not violated, ULXs must be fuelled by accretion onto Intermediate Mass Black Holes (i.e. IMBHs) with masses in the range ([Colbert & Mushotzky 1999]). It is possible that ULXs appear very luminous due to a combination of moderately high mass, mild beaming and mild super-Eddington emission and that ULXs are an inhomogeneous population composed of more than one class.
ULXs have been studied intensively during the last decades (see [Feng & Soria 2011] for a review). As in the case of Black Hole Binaries (BHBs), some ULXs undergo spectral transitions from a hard emission-dominated state to a soft emission-dominated state (see [Belloni 2010, Belloni 2011] for a description of the spectral states in BHBs). During the hard state the high-energy spectra of ULXs show a power-law spectral shape in the 3-8 keV spectral range, together with a high-energy turn-over at 6-7 keV, and a soft excess at low energies (e.g. [Kaaret et al. 2006]). This soft excess can be modelled by emission coming from the accretion disc and is characterized by a low inner disc temperature of keV, as expected if the black holes in these sources are indeed IMBHs ([Miller et al. 2003, Miller et al. 2004]). Nevertheless, [Soria (2007)] suggested that some ULXs are consistent with black holes accreting at moderate rate with masses of .
The study of the timing properties of ULXs represent a promising way to confirm the associations/similarities with this class of sources and BHBs. The Power Density Spectra (PDS) of BHBs are usually composed by broad noise components and narrow components (quasi periodic oscillations, QPOs). Just a few ULXs show a QPO and their detection has been proven to be difficult ([Heil et al. 2009]). In this work we apply a recent tool (from [Muñoz-Darias, Motta & Belloni 2011]), the Root Mean Square (rms)-Intensity Diagram, which has been proved to be useful to map states in BHBs (without the need of any spectral information).
We studied the currently best available dataset from the ULX in the dwarf galaxy NGC 5408, located at a distance of Mpc ([Karachentsev et al. 2002]). NGC 5408 X–1 is very bright, with a peak X-ray luminosity in the (0.3-10 keV) energy range of . [Strohmayer & Mushotzky (2009)] found a QPO in its PDS centred at Hz and inferred a mass for the black hole in the range of . Recently, [Dheeraj & Strohmayer (2012)] studied the timing and spectral properties of NGC 5408 X–1 and have found that the QPO frequency is variable and largely independent on the spectral parameters. They suggested that NGC 5408 X–1 is accreting in the saturation (constancy of the power-law photon index and disc flux with a further increase in the QPO centroid frequency) regime a few times observed in BHBs ([Vignarca et al. 2003]). We performed timing and spectral studies, but focusing on the evolution of the broad-band noise rather than on the characteristics of the QPO.
2 Timing and spectral analysis
We considered the 6 long (120-130 ks) high-quality observations performed with XMM-Newton during 6 years (2006-2011) of NGC 5408 X–1. We limited our analysis to the EPIC/pn data, due to its higher time resolution and effective area. We refer to Caballero-Garcia et al. (2012, in prep.) for a study of the full (pn+MOS) dataset.
2.1 Timing
We performed the analysis of the fast time variability of NGC 5408 X–1 in the 1-8 keV energy range. The (1-8 keV) pn count rate is on average. We excluded from the analysis the 8-10 keV energy band because of the lack of signal and we ignored the 0.3-1 keV energy range because variability is suppressed in this energy range for NGC 5408 X–1 ([Middleton et al. 2011]). We produced light curves with a time bin of 0.5 s. We used custom software under MATLAB to perform Fast Fourier Transforms (FFT) and produce the PDS. A total of 2048 points of the light curve were used to perform the FFT. The PDS were normalized according to [Leahy et al. (1983)] and converted to square fractional root mean square deviation (rms; [Belloni & Hasinger 1990]). PDS fitting was carried out with the standard XSPEC fitting package by using a one-to-one energy-frequency conversion and a unit response.
We fitted the PDS with a model constituted by a broad Lorentzian centred at zero frequency plus a constant (expected to be 2 in the Leahy normalization) to account for the Poisson noise. This resulted to be a good fit in all the observations, except for the second observation, in which residuals in the form of a QPO are visible around Hz. The integrated fractional rms in the 0.005-1 Hz band for each observation is reported in Tab. 1.
2.2 Spectroscopy
We produced background-subtracted energy spectra in the 0.3-10 keV energy range, with a background taken from an annulus around the target. Because our goal is to study the intrinsic emission of the ULX, in this way we expected to minimize the diffuse emission from the galaxy. Nevertheless, emission lines are present in the soft X-rays (0.3-1 keV) energy range, which may indicate the presence of residual diffuse emission from the galaxy. We considered the model component apec for the description of this diffuse emission plus emission from the inner disc (diskpn model component, with corrections for the inner disc emission close to the black hole), using the tbabs absorption model component. To fit the high-energy emission, we considered model components allowing for high-energy curvature, i.e. either a powerlaw with a high-energy cut-off cutoffpl or compTT, the latter with the temperature for the input soft photons tied to the temperature of the inner part of the disc. A variable multiplicative constant factor was used to account for coordinated variability of the spectra. We fitted the spectra simultaneously, in order to tie the parameters related to the diffuse emission (apec model) and the column density components, expected to be constant.
In the model with compTT, the obtained temperature of the electrons in the corona was keV and the optical depth . In the phenomenological model with cutoffpl, the photon indices and the high-energy cut-off found are in the range and keV, respectively. The two models provided the same statistical description to the data and none is statistically favoured. The most relevant results of this analysis are shown in the following and in Tab. 1.
3 Results and Implications
We found that the X-ray emission of NGC 5408 X–1 is highly variable and that this variability changes during the course of the observations (i.e. the fractional rms changes from % to %). This level of variability is comparable to BHBs in the low/hard state and to some extreme Seyfert galaxies ([Vaughan et al. 2003]). The best model applied to the energy-spectra has best-fit parameters that closely resemble those obtained from BHBs during the low/hard state (, keV, [Reis et al. 2010]), except for the presence of a low-energy cut-off in the spectra ( keV), much lower than those observed in BHBs ( keV). This low value for the cut-off can be physically understood as a low value of the temperature of the electrons in the corona and has previously reported in the study of a sample of bright ULXs ([Gladstone et al. 2009]).
We studied possible correlations of the rms with spectral parameters. We found that there is an anti-correlation of the total flux with the fractional rms (see details in the caption of Fig. 1), similar to that found in BHBs during the low/hard state ([Muñoz-Darias, Motta & Belloni 2011]). A linear rms-flux correlation in NGC 5408 X-1 has already been reported ([Heil & Vaughan 2010]), but on short time scales (i.e. within single XMM-Newton observations; coinciding with our Obs. 1 and 2). Our study shows that there is a fractional rms-flux anti-correlation in the longer time-scales, in analogy to what observed in the LHS of BHBs ([Muñoz-Darias, Motta & Belloni 2011]).
| Obs. Number | Fractional rms | Inner disc temperature | Power-law | Energy cut-off | Unabsorbed flux |
|---|---|---|---|---|---|
| () | (keV) | Photon Index | (keV) | ||
| 1 | |||||
| 2 | |||||
| 3 | |||||
| 4 | |||||
| 5 | |||||
| 6 |
Note:
1 The results shown are from the model tbabs(apec+diskpn+cutoffpl).
2 Errors are .
References
- [Belloni & Hasinger 1990] Belloni, T. M. & Hasinger G. 1990, A&A, 230, 103
- [Belloni 2010] Belloni, T. M. 2010, The Jet Paradigm: From Microquasars to Quasars, Lecture Notes in Physics, 794
- [Belloni 2011] Belloni, T. M. 2011, Astronomische Nachrichten, 332, 324
- [Colbert & Mushotzky 1999] Colbert, E. J. M. & Mushotzky, R. F. 1999, ApJ, 519, 89
- [Dheeraj & Strohmayer (2012)] Dheeraj, P. R. & Strohmayer, T. E. 2012, ApJ, 753, 139
- [Fender & Belloni 2012] Fender, R. & Belloni, T. 2012, Science, 337, 540
- [Feng & Soria 2011] Feng, H. & Soria, R. 2011, NewAR, 55, 166
- [Gladstone et al. 2009] Gladstone, J. C., Roberts, T. P. & Done, C. 2009, MNRAS, 397, 1836
- [Heil et al. 2009] Heil, L. M., Vaughan, S. & Roberts, T. P. 2009, MNRAS, 397, 1061
- [Heil & Vaughan 2010] Heil, L. M. & Vaughan, S. 2010, MNRAS, 405, 86
- [Kaaret et al. 2006] Kaaret, P., Simet, M. G., & Lang, C. C. 2006, ApJ, 646, 174
- [Karachentsev et al. 2002] Karachentsev I. D. et al. 2002, A&A, 404, 93
- [Leahy et al. (1983)] Leahy D. A., Elsner R. F. & Weisskopf M. C. 1983, ApJ, 272, 256
- [Middleton et al. 2011] Middleton, M. J., Roberts, T. P., Done, C. & Jackson, F. E. 2011, MNRAS, 411, 644
- [Miller et al. 2003] Miller, J. M., Fabbiano, G., Miller, M. C. & Fabian, A. C. 2003, ApJ, 585, 37
- [Miller et al. 2004] Miller, J. M., Fabian, A. C. & Miller, M. C. 2004, ApJ, 607, 931
- [Moran et al. 1999] Moran, E. C., Lehnert, M. D. & Helfand, D. J. 1999, ApJ, 526, 649
- [Muñoz-Darias, Motta & Belloni 2011] Muñoz-Darias, T., Motta, S. & Belloni, T. M. 2011, MNRAS, 410, 679
- [Reis et al. 2010] Reis, R. C., Fabian, A. C. & Miller, J. M. 2010, MNRAS, 402, 836
- [Soria (2007)] Soria, R. 2007, Ap&SS, 311, 213
- [Strohmayer & Mushotzky (2009)] Strohmayer, T. E. & Mushotzky, R. F. 2009, ApJ, 703, 1386
- [Vaughan et al. 2003] Vaughan, S., Fabian, A. C. & Nandra, K. 2003, MNRAS, 339, 1237
- [Vignarca et al. 2003] Vignarca, F., Migliari, S., Belloni, T. et al. 2009, A&A, 397, 729
- [Warwick et al. 2007] Warwick, R. S., Jenkins, L. P., Read, A. M. et al. 2007, MNRAS, 376, 1611