The INTEGRAL source IGR J16328-4726: a High Mass X-ray Binary from the BeppoSAX era
Abstract
We report on temporal and spectral analysis of the INTEGRAL fast transient candidate IGR J16328-4726 observed with BeppoSAX in 1998 and more recently with INTEGRAL.
The MECS X–ray data show a frequent micro activity typical of the intermediate state of Supergiant Fast X-ray Transients and a weak flare with duration of 4.6 ks.
The X–ray emission in the 1.5–10 keV energy range is well described through the different time intervals
by an absorbed power law model. Comparing spectra from the lower emission level up to the peak of the flare, we note that
while the power-law photon index was constant ( 2), the absorption column density varied by a factor of up to 6-7, reaching the value of
21023 cm-2 at the peak of the flare.
Analysis of the long-term INTEGRAL/IBIS light curve confirms and refines the proposed 10.07 day period, and the derived ephemeris places the BeppoSAX observations away from periastron.
Using the near and the mid-IR available observations, we constructed a spectral infrared distribution for the counterpart of IGR J16328-4726, allowing us to identify its counterpart as a High Mass OB type star, and to classify this source as a firm HMXB.
Following the standard clumpy wind theory, we estimated the mass and the radius of the clump responsible of the flare. The obtained values of M and R km are in agreement with expected values from theoretical predictions.
1 Introduction
The X-ray fast transient source IGR J16328-4726 was discovered by Bodaghee et al. (2007). Fiocchi et al. 2010, making use of the IBIS/INTEGRAL data, tentatively classified it as a Supergiant Fast X–ray Transient (SFXT) candidate on the basis of the transient and recurrent nature, the spectral properties observed during the outbursts that lasted only a few tens of minutes/hours, the location in the Galactic Plane, the faint quiescent emission () and a flux dynamic range 170 in the 0.3-10 keV (XRT/Swift) and 165 in the 20-50 keV (IBIS/INTEGRAL) bands. The source characteristics and behavior are reported in Fiocchi et al. (2010) and references therein. An additional detection was reported in the Swift BAT 54 month all-sky survey (Cusumano et al. 2010) with an averaged flux of in the 15-70 keV energy band.

The physical mechanism producing short X-ray flares of the SFXTs is still under discussion, and several scenarios have been proposed. The most frequently discussed scenario is the clumpy stellar wind model (in’t Zand 2005; Walter & Zurita Heras 2007) where dense clumps in an isotropic stellar wind cause short X-ray flares when they accrete onto a neutron star. A few SFXT systems can be explained by an eccentric NS orbit around a massive star with a disk-like anisotropic stellar wind (Sidoli et al. 2007). The SFXT emission could be explained also by a gating effect caused by the extremely strong NS magnetic field ( G) and rotational properties (Bozzo et al. 2008a).
Proximity to the Black Hole Candidate 4U 1630-47, has previously made any periodicity study based on long-term hard X-ray light curves difficult, but Corbet et al. (2010) reported a significant period at days from IGR J16328-4726.
Here we report on analysis of BeppoSAX observations performed in 1998, a re-analysis of the INTEGRAL/IBIS light curve, and an archival search for other observations that might allow us to confirm or discard the SFXT nature of IGR J16328-4726.
2 INTEGRAL observations and data analysis
The INTEGRAL dataset used included all public data available for the period up to 30th September 2010 (MJD 52650 through MJD 55469). The total on-source exposure on IGR J16328-4726 during this period was 9.2 Ms. Light curves for both IGR J16328-4726 and 4U 1630-47 were extracted from science window (pointing) images constructed using the standard OSA9 analysis software, in the 18-60 keV energy band. The light curves were then filtered to remove science windows (ScW) with an exposure of less than 200 s and/or in which the sources were at an off-axis angle of greater than 12 degrees as such ScWs have large intrinsic uncertainties in flux measurement. The final, filtered IGR J16328-4726 light curve has an on source exposure of 7.1 Ms. We performed a timing analysis on the derived IGR J16328-4726 light curve using standard Lomb-Scargle techniques (Lomb 1986, Scargle 1982) to search for periodic signals in the data, and monte-carlo randomisation to determine both the significance of, and uncertainty in, the derived periodicities (for further information on the randomisation techniques applied see Drave et al. 2010 and references thererin).

3 INTEGRAL timing analysis
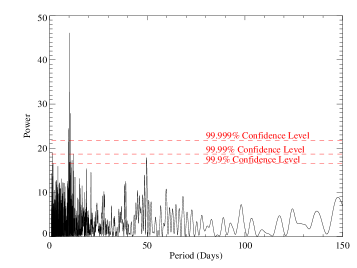
The Lomb-Scargle periodogram of the 1860 keV IBIS/ISGRI light curve of IGR J16328-4726 (Figure 1, left panel) shows the detection of a period at 10.068 days, which we interpret as the likely orbital period. A randomisation monte-carlo determined the 1-sigma uncertainty on that period to be 10.0680.002 days. This period is consistent, within errors, with that reported in Corbet et al. (2010) and provides an independent confirmation of the orbital period of the binary system. The detection in that work used a SWIFT /BAT data set spanning MJD 53359 through MJD 55104. This data set began after the last period of high X-ray activity in 4U 1630-47 ceased at MJD 53300. The INTEGRAL/IBIS data set used in this work does span the earlier region of high activity of 4U 1630-47. However there is only a small amount of contamination from this bright source in the IGR J16328-4726 light curve and a comparative analysis performed using only data from the same MJD range as Corbet et al. (2010) provided a consistent detection of the period. The higher exposure in the full data set allowed a more accurate determination of the period and its uncertainty however and thererfore it is this data set that is used in the remainder of this work.
Folding the light curve using the best orbital period determination of 10.068 days and a zero phase ephemeris, taken as the first INTEGRAL observation in the light curve, of MJD 52651.164 yields the folded light curve shown in Figure 1 (right panel). This shows a single broad emission maximum above a quiescent level, but the statistical quality makes it difficult to derive further information. The shape of the profile is similar to those observed from other SFXTs such as IGR J17544-2619 (Clark et al. 2009) and IGR J16465-4507 (Clark et al. 2010). The times of the BeppoSAX observations within this orbital phase using the stated ephemeris are also indicated.

4 BeppoSAX observations and data analysis
Results presented here are from the Low-Energy Concentrator Spectrometer (LECS; Parmar et al. 1997) and the Medium-Energy Concentrator Spectrometer (MECS; Boella et al. 1997) on-board BeppoSAX.
The High Pressure Gas Scintillation
Proportional Counter (HPGSPC; Manzo et al. 1997) and the Phoswich Detection System (PDS; Frontera et al. 1997) instruments were not considered as their field of view included also emission from the
nearby Black Hole Candidate 4U1630-47.
The LECS and MECS event files and spectra were generated with the Supervised Standard Science Analysis (Fiore, Guainazzi & Grandi 1999).
The MECS spectra were accumulated in circular regions of radius and publicly available response matrices were used. The off axis corrections have been taken into account using the apposite response matrices.
The Point Spread Function (PSF) of the MECS instruments has been modeled as the sum of 2 components: a Gaussian describing mainly the detector PSF and a King Profile describing mainly the optics PSF (Boella et al. 1997). The final result is a fully analytic differential PSF with a width of 2.5’ at 6.4 keV, 80% of encircled energy radius. Since the distance between the Black Hole 4U 1630-47 and IGR J16328-4726 is , the Black Hole contribution within the spectral extraction radius of the IGR J16328-4726 is widely below 1% (being this the systematic error added to the data following the indications given in Fiore, Guainazzi & Grandi (1999) for the standard spectral analysis) .
In the archival MECS images (1.5–10 keV) IGR J16328-4726 was detected above 5 sigma during three different observations performed on 1998-03-07 12:23:21.0 UTC, 1998-03-19 14:52:11.0 UTC and 1998-03-26 17:16:48.5 UTC. The LECS image analysis (0.5–3.5 keV) showed that IGR J16328-4726 was not detected above 5 sigma during these three observations. Log of these observations are shown in Table 1, reporting start times, exposure times and the IGR J16328-4726 count rate for each observations.
5 The BeppoSAX MECS results
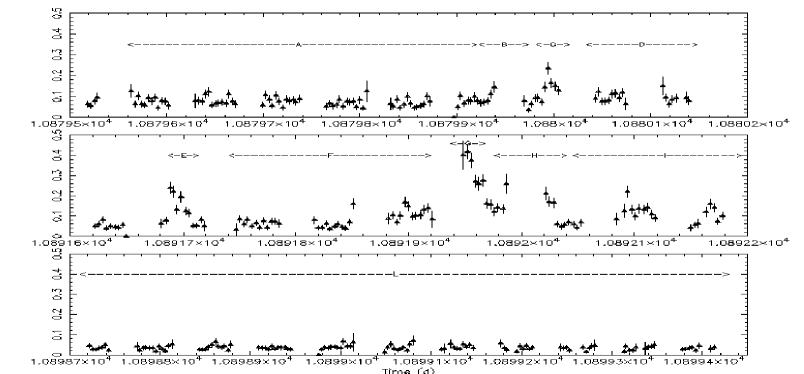
Figure 2 (upper panel) shows the MECS light curve of IGR J16328-4726 with a bin size of 300 s. As previously observed by IBIS on board of INTEGRAL satellite (Fiocchi et al. 2010), the source shows highly recurrent micro-activity with durations from tens of minutes to several hours.
To search for spectral changes, we accumulated X-ray spectra during several time intervals, as indicated on the light curve. The X-ray spectra are all well fitted by an absorbed power-law in the 1.5–10 keV energy range. Details of the time intervals, and results of this analysis for each selected period are reported in Table 2.
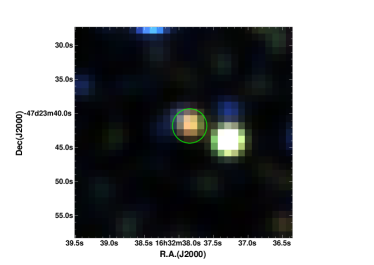
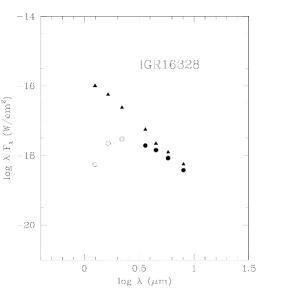
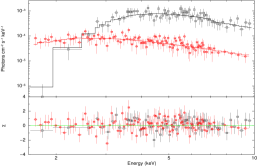
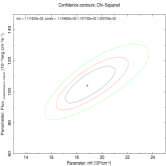
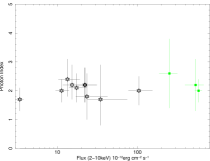
Figure 3 (left panel) shows the MECS spectra and residuals with respect to the absorbed power law models at the peak of emission (phase G) and at the lowest emission level (phase L), indicated with squares and stars, respectively. A plot of the evolution of the spectral parameters of the source is provided in Fig. 4. The power-law photon index remained fairly constant (see Fig. 4, right panel) including both the MECS and IBIS data from Fiocchi et al. 2010, whereas the absorption column density underwent changes (Fig. 4, left panel). In particular, we measured a large increase (factor of 6-7) in the absorption column density from the lower emission level (phase L) up to the peak of the flare (period G) when the column density reached a value of 21023 cm-2. To test the significance of the measured variation in the absorption column density, we report in Fig. 3 the -Flux parameters confidence contours for the relevant spectra in phases G and L (middle and right panel). The contours correspond to 68%, 90%, and 99% confidence level. A very significant increase in the absorption column density with the unabsorbed fluxes is clearly detected. Although adding an iron line does not significantly improved the fit, we considered this component to estimate the iron line equivalent width upper limits. With the iron line centroid fixed at 6.5 keV, we obtained equivalent width upper limits of 440 eV and 262 eV (3 confidence level) for the peak of the flare (period G) and the lower emission level (phase L), respectively.
| Start Time | Exposure time | Count s-2 | ||
| LECS | MECS | LECS | MECS | |
| UTC | s | s | [0.5-3.5 keV] | [1.5-10 keV] |
| 1998-03-07 12:23:21.0 | 12290 | 29530 | n.d.a | |
| 1998-03-19 14:52:11.0 | 9912 | 27786 | n.d.a | |
| 1998-03-26 17:16:48.5 | 11694 | 31265 | n.d a | |
a n.d. means that the IGR J16328-4726 was not detected above 5 .
| Interval | OBS. Tstart | Interval Tstart | Tstart Phase | Exp. | Rates | /d.o.f. | |||
|---|---|---|---|---|---|---|---|---|---|
| (s) | MJD | (s) | (c/s) | (1022 cm-2) | (10-12erg cm-2 s-1) | ||||
| A | 1998-03-07 | 50879.563 | 0.036 | 1521.2 | 7.50.2 | 7.71.5 | 2.00.3 | 12.7 | 80/105 |
| 12:23:21.0 | |||||||||
| B | 1998-03-07 | 50879.901 | 0.070 | 4713.5 | 7.10.4 | 9.5 | 2.4 | 13.4 | 42/54 |
| 12:23:21.0 | |||||||||
| C | 1998-03-07 | 50879.988 | 0.079 | 1582.1 | 14.90.9 | 14.9 | 1.7 | 34.6 | 29/36 |
| 12:23:21.0 | |||||||||
| D | 1998-03-07 | 50880.041 | 0.084 | 4308.9 | 8.20.4 | 9.5 | 2.2 | 15.3 | 29/36 |
| 12:23:21.0 | |||||||||
| E | 1998-03-19 | 50891.681 | 0.240 | 3210.9 | 11.10.6 | 10 | 2.20.6 | 22 | 31/53 |
| 14:52:11.0 | |||||||||
| F | 1998-03-19 | 50891.748 | 0.247 | 9577.5 | 7.00.3 | 7.4 | 2.00.4 | 11.3 | 69/93 |
| 14:52:11.0 | |||||||||
| G | 1998-03-19 | 50891.949 | 0.267 | 1614.9 | 30.11.4 | 18.9 | 2.00.5 | 104 | 42/67 |
| 14:52:11.0 | |||||||||
| H | 1998-03-19 | 50891.968 | 0.269 | 1569.6 | 14.00.8 | 8.8 | 1.80.8 | 23.4 | 33/33 |
| 14:52:11.0 | |||||||||
| I | 1998-03-19 | 50892.029 | 0.274 | 6534.1 | 8.90.4 | 10.0 | 2.10.5 | 17.4 | 60/85 |
| 14:52:11.0 | |||||||||
| L | 1998-03-26 | 50898.720 | 0.939 | 28460.6 | 2.80.1 | 3.31.3 | 1.70.3 | 3.4 | 70/101 |
| 17:16:48.5 |
The continuum spectral model is an absorbed power law. Here, is the absorption column density,
is the power-law photon index, is the unabsorbed flux in the 1.5-10 keV band.
In the last column we report the value of the /d.o.f
for each spectrum. Exp. is the good time interval for the spectral extraction.
6 Summary of the main outburst characteristics
The MECS light curve of IGR J16328-4726 (Figure 2) shows
highly recurrent micro-activity with durations of tens of minutes and a strong outburst
(its peak is reported as epoch G in Figure 2).
During the outburst detected with the MECS instrument, the source was not significantly detected () in the corresponding LECS image, that had an exposure time of 775 s.
The spectral analysis of the outburst peak was reported in Table 2 (period G) for comparison with other activity period of the IGR J16328-4726 and summarised in Table 3,
where we reported start time, duration and spectral parameters. Using these values and assuming a distance of 3 kpc and 10 kpc, the X-ray luminosity (2–10 keV) spans from 1035 erg s-1 to 1036 erg s-1, respectively.
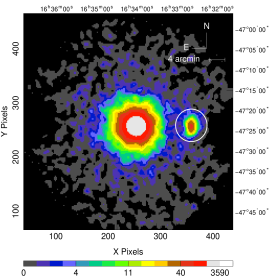
To determine the best position, and as the source is highly absorbed, we extracted the MECS image in the 4–10 keV energy band during its outburst (G period reported in Figure 2). IGR J16328-4726 was detected at count/s at RA(J2000)= 16h32m38.1s and Dec(J2000)=-47∘ 23’ 56.8” with a error box of 35 arcsec (Figure 2, lower panel). Note that the circle reported in this figure is the radius for spectral extraction and not the position error box.
7 Infrared identification
The transient X-ray source IGR J16328-4726 has been identified with the near-IR source 2MASS16323791-4723409 (Grupe et al. 2009), shown in Fig. 5 (left panel). The 2MASS catalogue reports only the J magnitude and gives an upper limit in H and K. From the images we have obtained the complete photometry of this source using the calibration reported in the headers. The measured magnitudes are J=14.320.06, H=12.290.03 and K=11.190.02. The source is reported in the DENIS survey as J1632379-472341 and has been detected also by the Spitzer/GLIMPSE survey. The magnitudes reported in the 4 IRAC bands obtained from the GLIMSPE catalogue (G336.7492+00.4223) are M3.6μm=10.210.05, M4.5μm=9.810.06, M5.8μm=9.630.05 and M8.0μm=9.520.04. From the observed near-IR colors of the source J-H= and H-K=, we derive a visual extinction of AV=20. The source is not detected in the I band (DENIS survey) and it is not reported in other optical catalogues. Combining the near and the mid-IR observations we have obtained the spectral infrared distribution for IGR J16328-4726, shown in Fig. 5 (right panel) as open and filled circles. Using the reddening law derived by Rieke and Lebosky (1985), we have de-reddened the observed spectral points (triangles in Fig. 5, right panel). This spectral energy distribution suggests the identification of IGR J16328-4726 as a OB star. In addition the de-reddened NIR colors of (J-H)0=-0.11 and (H-K)0=-0.12 are compatible with both OB Supergiant and OB main sequence, when compared with the colors for Supergiant and main sequence stars reported by Ducati et al. (2001). Although IR spectroscopy of this source is needed to confirm this result, the X-ray behavior and infrared analysis strengthens the idea that this source is a SFXT candidate.
8 Discussion
The INTEGRAL satellite has modified our understanding of high mass binary
systems, showing the existence of a new population of
compact objects orbiting
around a massive supergiant star and exhibiting unusual properties, being either extremely absorbed,
or characterized by very short and intense flares.
The SFXTs are characterized by short and bright flares,
each with a duration between 102 s and 104 s, reaching 1036-37 erg s-1 at their peak.
In these transients, both the duration and shape of the bright flares are variable and
the mechanism producing the transient emission is still not clear.
X-ray spectra (0.1–100 keV) during flares are well described either by a flat power law below
10 keV (Sidoli et al. 2006), with a photon index of 0-1 and a high energy
cut–off around 10–30 keV, or by a bremsstrahlung model with a temperature of 15–40 keV.
A low intensity flaring, corresponding to an intermediate state between the quiescence and the flare peaks, is usually present, characterised by an X–ray luminosity
of 1033-34 erg s-1, as discovered thanks to XRT/SWIFT monitoring campaign of SFXTs (Romano et al. 2010, 2011). In this state the X–ray spectrum is softer, with an absorbed power law
with photon index of 1–2 (Sidoli et al. 2008, Romano et al. 2010).
At the moment there are 11 firm established SFXTs and a similar number of candidates (Sidoli 2011).
| OBS. Tstart | Duration | Integrationa Time | /d.o.f. | ||||
|---|---|---|---|---|---|---|---|
| UTC | (ks) | (s) | (1022 cm-2) | (10-12erg cm-2 s-1) | (erg s-1) | ||
| 1998-03-19 14:52:11.0 | 4.6 | 1614.9 | 18.9 | 2.00.5 | 104 | 1035 | 42/67 |
The continuum spectral model is an absorbed power law. The is the absorption column density,
is the power-law photon index, is the unabsorbed flux in the 1.5-10 keV band.
Outburst duration is the extrapolated activity period assuming as beginning of the outburst the first bin during which the source was detected while the integration time is the good time interval for the spectral extraction.
A time-resolved BeppoSAX spectral analysis of IGR J16328-4726 covering a significant range of orbital phases shows the source X–ray emission could be well described in the different selected time intervals by an absorbed power law model. While the photon index of the power law remained constant, the absorption column density was highly variable. We measured a significant rise in the from 3 to 201022 cm-2 across the transition from the low emission level (phase L) to the peak of the flare seen by SAX(phase G). We note that this does not correspond to the assumed periastron of the system based on the peak of the folded IBIS light curve but is likely associated with the accretion of a well-defined clump of wind. Similar behavior is usually observed during the occurrence of X–ray eclipses in some of the sgHMXBs and SFXT (Bozzo et al. 2008, 2011). The neutron star could be obscured by its supergiant companion and for this reason the X–ray emission, produced by the accretion close to the surface of the NS, is progressively absorbed in the photosphere of the supergiant star.
With this source being confirmed as an HMXB, its location is possibly associated to the spiral arms of our Galaxy, as usually observed with INTEGRAL HMXB population (Dean et al. (2005), Lutovinov et al. (2005), Bodaghee et al. (2007, 2011)). Assuming a distance of 3 kpc and 10 kpc for the spiral structure of the Galaxy, the X-ray luminosity (2–10 keV) during the flare spans from 1035 erg s-1 to 1036 erg s-1, respectively. During the low emission level these values spans from 41033 erg s-1 to 41034 erg s-1. The X-ray characteristics observed with BeppoSAX show the frequent micro activity typical of the intermediate state, with a luminosity value lying between the quiescence and the flare peaks, and a soft X–ray spectrum ().
Soon after the discovery of SFXT, to explain the bright and short outbursts, in’t Zand (2005) proposed the sudden accretion of material from the clump wind of the supergiant; Negueruela et al. (2006a) suggested that SFXTs orbits should be highly eccentric to explain the low luminosity in quiescence. Later, the idea of a clump and spherically symmetric wind has been associated with an eccentric and/or wide orbit (Walter & Zurita Heras 2007; Negueruela et al. 2007). Based on the shape of the light curve observed during the 2007 outburst from the SFXT IGR J11215–5952 displaying periodic outbursts, Sidoli et al. (2007) proposed the presence of a second denser wind component in the form of an equatorial wind disk from the supergiant donor, inclined with respect to the orbital plane. The flaring activity was explained with a wind that is inhomogeneous and anisotropic.
All models predict that fast X-ray flares can be produced by sporadic capture and accretion onto the neutron stars hosted in the SFXTs.
The wind accretion theory allow us to estimate the physical and geometrical parameters of the clumpy responsible of the transient emission. The duration of the main observed flare during the BeppoSAX observation of our source (phase G) is 4.6 ks, a typical time scale on which the neutron star crosses a dense clumpy. Neglecting the orbital velocity of the neutron star as reporting in Lépine et al. 2008, from the duration of the flare we obtain the radius of the clump accreted by the neutron star:
| (1) |
where is the relative velocity between the clump and the neutron star.
During the time of the neutron stars periastron passage the absorption column density increase and it could be computed from the equation (4) given in Bozzo et al. 2011:
| (2) |
where is the source distance in units of 3 kpc and is the wind velocity in .
Using the measured by the spectral analysis at the peak of the flare (1.91023 cm-2) and assuming a distance of 3 kpc, Eq. 2 allow us to estimate a wind velocity of 1900 km/s.
This value agrees with the -velocity law (Castor et al. 1975) which gives a typical velocity of 1000-2000 km/s for an OB supergiant and for a companion star losing mass in the form of a steady, homogeneous and spherically symmetric wind.
Assuming this wind velocity, we found the radius of the clump accreted by the neutron star km.
In the framework of the Bondi-Hoyle-Lyttleton accretion theory, since only matter within a distance smaller than the accretion radius is accreted, the mass of the clumpy is
| (3) |
where =2/km, =1.4 and is the mass accreted during the flare. The X-ray flux extrapolated in 0.1-10 keV energy range during the flare =/(4)=(/)/(4) and the continuity equation (where is the source distance and =10 km is the neutron star radius) allowed to estimate the mass accreted onto the neutron star. We derived =10 (for a distance of 3 kpc) and M, thus
| (4) |
Ducci et al. (2009) computed the expected clumpy characteristics in the framework of the Bondi-Hoyle accretion theory taking into account the presence of clumps. The expected values of and according to this clumpy wind model are in agreement with the measured values for IGR J16328-4726. We conclude that IGR J16328-4726 can be added to the list of Supergiant Fast X-ray Transients as it shows all of the characteristics typical of that class of object.
9 References
Bird et al. 2010, ApJS, 186,1
Baumgartner et al. 2010, HEAD, 11, 1305.
Bodaghee et al. 2007, A&A, 467, 585
Bodaghee et al. 2011, ApJ in press
Boella et al. 1997, A&AS, 122, 299
Bozzo, E., Falanga, M., & Stella, L. 2008, ApJ, 683, 1031
Bozzo et al. 2011, A&A, 531, 130
Burrows, D. N. et al., 2005, Space Sci. Rev., 120, 165
Chaty s. 2008, ChJGAS, 8, 197
Clark et al., 2009, MNRAS, 399, 113
Clark et al., 2010, MNRAS, 406, 75
Corbet et al. 2010, ATel # 2588
Courvoisier, T. J.-L., et al., 2003, A&A, 411, L53
Cusumano et al. 2010, A&A, 510, 48
Dean et al. 2005, A&A, 443, 485
Drave et al., 2010, MNRAS, 409, 1220
Ducati J. R., Bevilacqua C. M., Rembold S. B. et al. 2001, ApJ, 558, 309
Ducci, L., Sidoli, L., Mereghetti, S., Paizis, A., & Romano, P. 2009, MNRAS, 398, 2152
Federici M., Martino B. L. and Natalucci L., 2009 PoS2009-092
Filliatre and Chaty, 2004, ApJ, 616, 469
Fiocchi et al. 2010, ApJ, 725, 68
Fiore, F., Guainazzi, M., & Grandi, P. 1999, Cookbook for BeppoSAX NFI Spectral Analysis (www.asdc.asi.it/bepposax/software/cookbook)
Frontera et al, 1997, A&AS, 122, 357
Grupe et al. 2009, ATel # 2075
Hill et al., 2004, Proc. SPIE, 5165, 217
in’t Zand, J. J. M. 2005, A&A, 441, L1
Ibarra et al., 2007, A&A ,465, 501
Lepine, S. & Moffat, A. F. J. 2008, AJ, 136, 548
Lomb, N. R. 1976, Ap&SS, 39, 447
Lutovinov, A., Revnivtsev, M., Molkov, S., et al. 2005, A&A, 430, 997
Manzo et al. 1997, A&AS, 122, 341M
Negueruela, I., Smith, D. M., Harrison, T. E., & Torrejón, J. M. 2006a, ApJ, 638, 982
Negueruela et al. 2006b, ESASP, 604, 165
Negueruela, I., Smith, D. M., Torrejon, J. M., & Reig, P. 2007, astro-ph/0704.3224
Negueruela, I., Torrejon, J. M., Reig, P., Ribo, M., & Smith, D. M. 2008, arXiv:0801.3863
Parmar et al. 1997, A&AS, 122, 309
Rieke and Lebosky, 1985, AJ,288,618
Romano et al. 2010, MNRAS, 401, 1564
Romano et al. 2011, 2011 Fermi Symposium proceedings - eConf C110509, astro-ph/1111.0698
Scargle, J. D. 1982, ApJ, 263, 835
Sidoli, L., Paizis, A., & Mereghetti, S., 2006, A&A, 450, L9
Sidoli, L., Romano, P., Mereghetti, et al. 2007, A&A, 476, 1307
Sidoli, L.; Romano, P.; Mangano, V., et a., 2008, ApJ, 687, 1230
Sidoli et al. 2009, MNRAS, 397, 1528
Sidoli et al. 2010, ApJ, 690, 120
Sidoli L., 2011, astro-ph/1111.5747
Smith et al. 2006, ApJ, 638, 974
Sguera et al. 2005, A&A, 444, 221
Sguera et al. 2006, A&A, 646, 452
Sguera et al. 2007, A&A, 492, 163
Sidoli L., Paizis A. and Mereghetti S., 2006, A&A, 450, L9
Ubertini, P., et al. 2003, A&A, 411, L131
Winkler, C. et al. 2003, A&A, 411, 349
Walter, R., & Zurita Heras, J. 2007, A&A, 476, 335