A Suzaku Observation of Mkn 590 Reveals a Vanishing Soft Excess
Abstract
We have analyzed a long-look Suzaku observation of the Seyfert 1.2 Mkn 590. We aimed to measure the Compton reflection strength, Fe K complex properties and soft excess emission as had been observed previously in this source. The Compton reflection strength was measured to be in the range 0.2–1.0 depending on the model used. A moderately strong Fe K emission line was detected with an equivalent width of 120 eV and an Fe K line was identified with an equivalent width of 30 eV, although we could not rule out contribution from ionized Fe emission at this energy. Surprisingly, we found no evidence for soft excess emission. Comparing our results with a 2004 observation from XMM-Newton we found that either the soft excess has decreased by a factor of 20–30 in 7 years or the photon index has steepened by 0.10 (with no soft excess present) while the continuum flux in the range 2–10 keV has varied only minimally (10%). This result could support recent claims that the soft excess is independent of the X-ray continuum.
Subject headings:
galaxies: active – galaxies: individual (Mkn 590) – X-rays: galaxies1. Introduction
The physical conditions and geometry of the accreting circumnuclear material in the vicinity of supermassive black holes in active galactic nuclei (AGNs) remain open and critical questions. Studying AGN X-ray spectra and spectral variability yields constraints on the geometry of circumnuclear accreting material. Studying AGN X-ray spectra and spectral variability yields constraints on the geometry of circumnuclear accreting material. The X-ray continuum for Seyferts can be modeled as a power law arising in a hot corona via inverse Compton scattering of soft seed photons (e.g., Haardt et al. 1994) and can display rapid variability. This continuum may be reprocessed by material in the vicinity of the black hole, contributing emission lines and the Compton reflection hump which is commonly seen in Seyfert spectra above 10 keV (Nandra & Pounds 1994; Rivers et al. 2011). The Fe K emission line is nearly ubiquitous in AGN spectra and is a key diagnostic as its width can indicate the distance from the supermassive black hole of the emitting material and its energy can indicate an origin in neutral or ionized material.
Excess emission above the continuum at energies less than 2 keV, known as the soft excess, is commonly seen in Seyferts (e.g., Arnaud et al. 1985), yet remains something of a mystery. While a phenomenological blackbody component has generally been found to be a good fit in the past (e.g., Piconcelli et al. 2005), the invariance of the inferred temperature across a wide range of luminosities and black hole masses has led to the general consensus that the soft excess is non-thermal in origin. Reflection from an ionized medium (Ross & Fabian 2005’s “REFLION” or the updated “REFLIONX” ) offers a blend of ionized soft emission lines to form the soft excess; blurring of such emission has been seen to fit many Seyfert spectra well (Crummy et al. 2006). The presence of Fe XXV and/or Fe XXVI emission lines can also indicate the presence of ionized material, but these are relatively rare and have been reported for only about a dozen Seyferts (Bianchi et al. 2005).
Mehdipour et al. (2011) observed Mkn 509 several times over a period of 100 days with XMM-Newton and discovered that variations in the soft excess were not correlated with variations in the 2–10 X-ray power law, but were correlated with variations in the UV flux. This suggests that the soft excess does not arise from reflection processes off ionized material (see, e.g., Ross & Fabian 2005). Instead, one possibility is that the soft excess is created through thermal Comptonization of optical/UV photons from the disk at a location separate from the hard X-ray continuum with a lower temperature and/or optical depth causing a softer spectrum.
The Seyfert 1.2 galaxy Mkn 590 (also known as NGC 863) is an excellent candidate to explore the nature of circumnuclear material in AGNs. It is a relatively X-ray bright, reverberation-mapped object with a well determined black hole mass (; Vestergaard & Peterson 2006). It was observed in 2004 by XMM-Newton and Chandra (Longinotti et al. 2007), showing narrow Fe K emission lines from neutral Fe, and possibly from He-like Fe and H-like Fe. Those authors modeled a Compton reflection hump, which, along with the strong neutral Fe line and lack of a relativistic line broadening, suggested emission from a distant cold torus. However, lacking coverage above 10 keV, they could provide only weak constraints on the total Compton reflection strength, ( corresponds to reflecting material covering 2 sr as seen from the illuminating source; Magdziarz & Zdziarski 1995). A Rossi X-Ray Timing Explorer (RXTE) spectrum from public archive data contains only 30 ks of good exposure time, also yielding extremely poor constraints on (Rivers et al. in prep). BeppoSAX did not observe this source.
Longinotti et al. (2007) ruled out reflection from an ionized disk as the source of the soft excess, because it did not fit the ionized emission lines well. They concluded that the Fe XXV and XXVI emission lines originated in photo-ionized, optically-thin gas in an extended medium. Such emission lines are commonly seen in the X-ray spectra of Seyferts 2’s, but not Seyfert 1-1.5’s, however they are usually limited to emission lines at soft X-rays, not ionized Fe K lines. Importantly, Longinotti et al. (2007) found no evidence for an ionized absorber lying along the line of sight, which can adversely affect modeling of continuum emission components (e.g., Reeves et al. 2004, Turner et al. 2005). The only soft X-ray emission line was from O VIII, which they also attributed to photo-ionized circumnuclear gas. In other words, Mkn 590 has a relatively clean line of sight to the nucleus and can be considered a “bare nucleus” like the Seyfert 1’s Ark 120 (Vaughan et al. 2004) or MCG–2-58-22 (Weaver et al. 1995).
In this paper we will analyze and discuss results from an observation by the Suzaku observatory performed in 2011 January. Our goals with this observation were to take advantage of Suzaku’s broadband coverage to better constrain the form of the hard X-ray spectrum, including the hard X-ray behavior above 10 keV, and to search for long-term spectral variability between the 2004 and 2011 observations. In Section 2 we will detail the data reduction process; in Section 3 we will describe our spectral fitting methods; and in Section 4 we will discuss our results.
2. Data Reduction
Suzaku observed Mkn 590 on 2011 January 23 but was interrupted by a TOO trigger. The observation was continued on 2011 January 26. Data were taken with Suzaku’s X-ray Imaging Spectrometer (XIS; Koyama et al. 2007) and Hard X-ray Detector (HXD; Takahashi et al. 2007), and processed using version 2.5.16.29 of the Suzaku pipeline with the recommended screening criteria (as per the Suzaku Data Reduction Guide111http://heasarc.gsfc.nasa.gov/docs/suzaku/analysis/abc/abc.html). All extractions were done using HEASOFT v.6.9.
2.1. XIS Reduction
The XIS is comprised of one back-illuminated (BI) and two front-illuminated (FI) CCD cameras222The fourth CCD camera has been inoperative since 2006 November. See the Suzaku ABC Guide for details. each placed in the focal plan of an X-ray Telescope module. The screened XIS events data were cleaned and the modes summed to create image files for each XIS and from these we extracted source and background lightcurves and spectra using a standard extraction radius of 2’ for the source and four background regions of equivalent area. We then used XISRMFGEN and XISSIMARFGEN to create the response matrix (RMF) and ancillary response (ARF) files. Data for the two observation windows were added after we confirmed that there was no significant change in flux or spectral shape between the two observations. The total good exposure time per XIS was 102 ks. We also co-added data from the two FI CCDs once we had confirmed that the spectra were consistent with each other.
Data were grouped with a minimum of at least 50 counts per bin. We ignored data above 12 keV (10 keV for BI) where the effective area of the XIS begins to drop dramatically and below 0.7 keV due to time-dependent calibration issues of the instrumental O K edge at 0.5 keV. We included additional Gaussians in the fitting procedures between 1.5 and 2.4 keV due to calibration uncertainties for the Si K complex and Au M edge arising from the detector and mirror system. Average 2–10 keV rates were 0.442 and 0.538 counts s-1 per XIS for FI and BI, respectively. Figure 1 shows the average XIS light curve for the duration of the observation.
2.2. PIN Reduction
The HXD consists of two detectors, the PIN diodes and the GSO scintillators, however we did not analyze the GSO data due to the faintness of the source relative to the non-X-ray background in the GSO band. The PIN is a non-imaging instrument and the HXD instrument team provides non-X-ray background model event files for each observation. Instrument background estimates yield 1.5% systematic uncertainty at the 1 level (Fukazawa et al. 2009). We simulated the Cosmic X-ray Background in xspec ver.12.6 using the form of Boldt (1987) as recommended in the Suzaku ABC Guide.
We extracted net spectra which were then deadtime corrected for a net exposure time of 86 ks. As with the XIS, data were grouped manually but with a minimum of at least 200 counts per bin. We excluded PIN data below 15 keV due to thermal noise and above 45 keV where the source became too faint to detect above the background.

3. Spectral Fitting
All spectral fitting was done in xspec version 12.7.1, utilizing solar abundances of Wilms et al. (2000) and cross-sections from Verner et al. (1996). Uncertainties are listed at the 90% confidence level ( = 2.71 for one interesting parameter).
We began by fitting the broad spectrum (XIS+PIN) from 0.7 keV to 45 keV with a power law absorbed by a Galactic column of =2.65 cm-2 (Kalberla et al. 2005). We included a fixed constant factor of 1.16 between the XIS-FI and PIN data as well as a free constant between the FI and BI data (expected to be very close to 1). We left the photon index free between the FI and BI due to instrumental flattening in the BI, however in all cases the values were consistent with each other. We also included three narrow Gaussians to account for residuals associated with the instrumental Si K complex and Au M edge. For the XIS-FI data a Gaussian with a negative normalization at 1.85 keV and a positive Gaussian at 2.26 keV accounted for these residuals. For the XIS-BI data three positive Gaussians at 1.49, 1.79 and 2.26 keV accounted for the residuals (see, e.g., Suchy et al. 2011). These energies were fixed for our fitting.
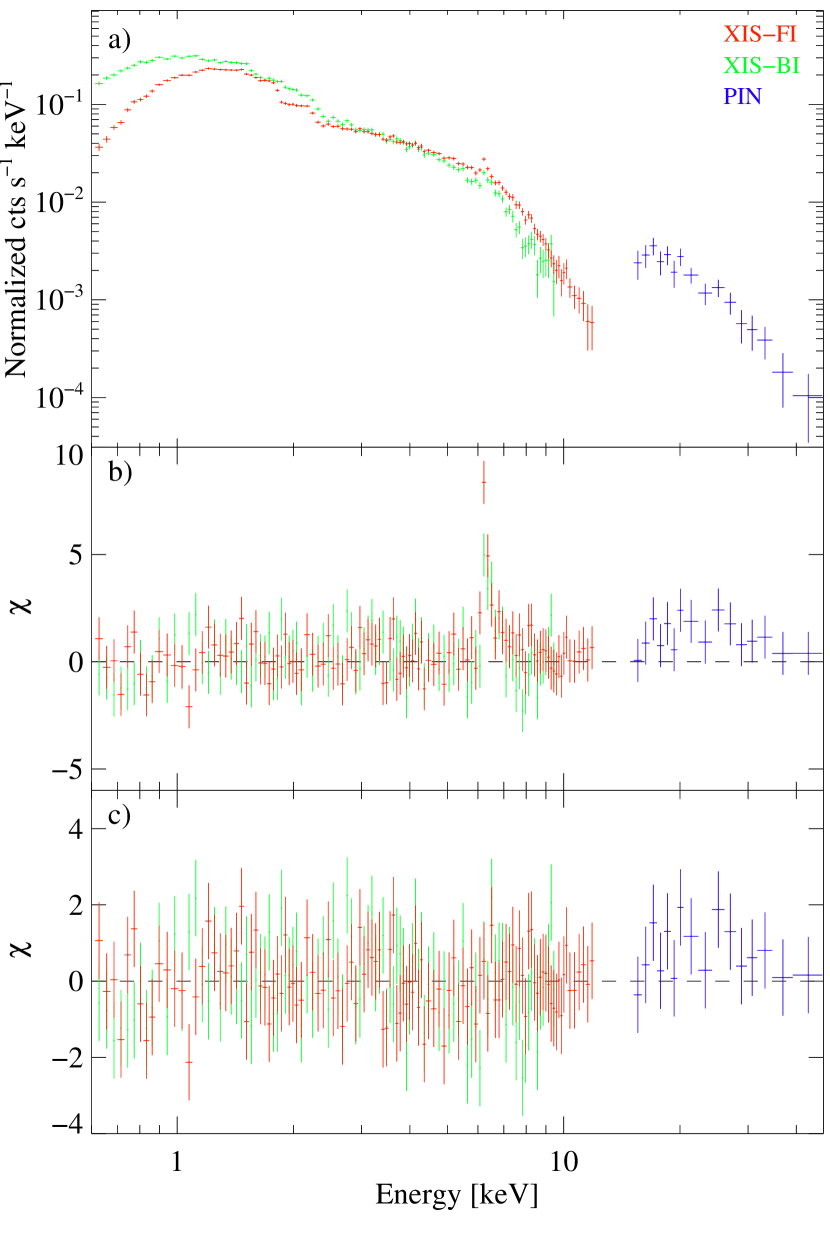
Residuals at 6.4 keV clearly showed the need for a neutral Fe line and broad residuals in the PIN data indicated the presence of Compton reflection (Figure 2b). We added a Gaussian to model the Fe K line and a pexrav component to model reflection with the photon index and normalization tied to that of the incident power law with the reflection strength, , as the only free parameter (cos fixed at 0.45 and all abundances set to solar). Note that the systematic uncertainty in the PIN background did not contribute significantly to the total uncertainty on ( ¡ 0.01). The addition of these components yielded a good fit with dof =198/218. Parameters for this model are listed in Table 1 as our “basic” model. We measured a 2–10 keV flux of 6.8 erg cm-2 s-1, corresponding to a luminosity of erg s-1 assuming a luminosity distance of 105 Mpc.
We found no evidence for the presence of absorption in excess of the Galactic column nor a soft excess below 2 keV. The latter is a surprising result since Longinotti et al. (2007) found clear evidence of a soft excess in their 2007 XMM-Newton data. They found /dof=49/2 for a blackbody with =156 eV and /dof=53/3 for a soft X-ray power law with =1.89. Adding a soft excess component to our model did not improve the fit and yielded an upper limit to the normalization of a soft power law of 3 ph keV-1 cm-2 s-1 at 1 keV () or using the blackbody model BBODY, an upper limit to the normalization of (with fixed at 156 keV) corresponding to a blackbody luminosity of erg s-1 (see xspec user’s guide for details on the BBODY normalization).
| Model | Basic | Basic ( Untied) | Basic + Soft Excess | ||
|---|---|---|---|---|---|
| Data | XIS+PIN | XIS+PIN | EPIC-pn | XIS+PIN | EPIC-pn |
| 1.67 | 1.71 | 1.82 | 1.67 | - | |
| 16.6 | 16.4 | - | 16.4 | - | |
| 3.0 | - | ||||
| ¡ 0.1 | 2.9 | ||||
| Fe K Line E (keV) | 6.43 | 6.43 | - | 6.43 | - |
| …………….. | 1.0 | 0.8 | 0.9 | 1.0 | 1.2 |
| …………….. (eV) | ¡ 80 | ¡ 60 | - | ¡ 60 | - |
| …………….. EW (eV) | 120 | 90 | 120 | 110 | 130 |
| Fe K Line E (keV) | 7.0 | 7.03 | 7.02 | ||
| …………….. | 0.25 | ¡ 0.2 | 0.4 | 0.17 | 0.5 |
| …………….. EW (eV) | 30 | ¡ 20 | 60 | 25 | 70 |
| 0.3 | 1.3 | - | 0.8 | - | |
| dof | 199/218 | 550/437 | - | 478/435 | - |
Note. — Parameters from our best-fit models. The first column gives parameters to our best fit model of Suzaku data only consisting of a power law with Galactic absorption, an Fe K line and Compton reflection. The next column gives the results of fitting Suzaku and XMM-Newton data simultaneously with the basic model from the first column with and overall normalization untied between the two observations. The next column shows the same data set but with tied and a power law soft excess component with normalization untied between the two observations. A dash indicates a tied parameter.
3.1. Simultaneous Fitting of Suzaku and XMM-Newton Data
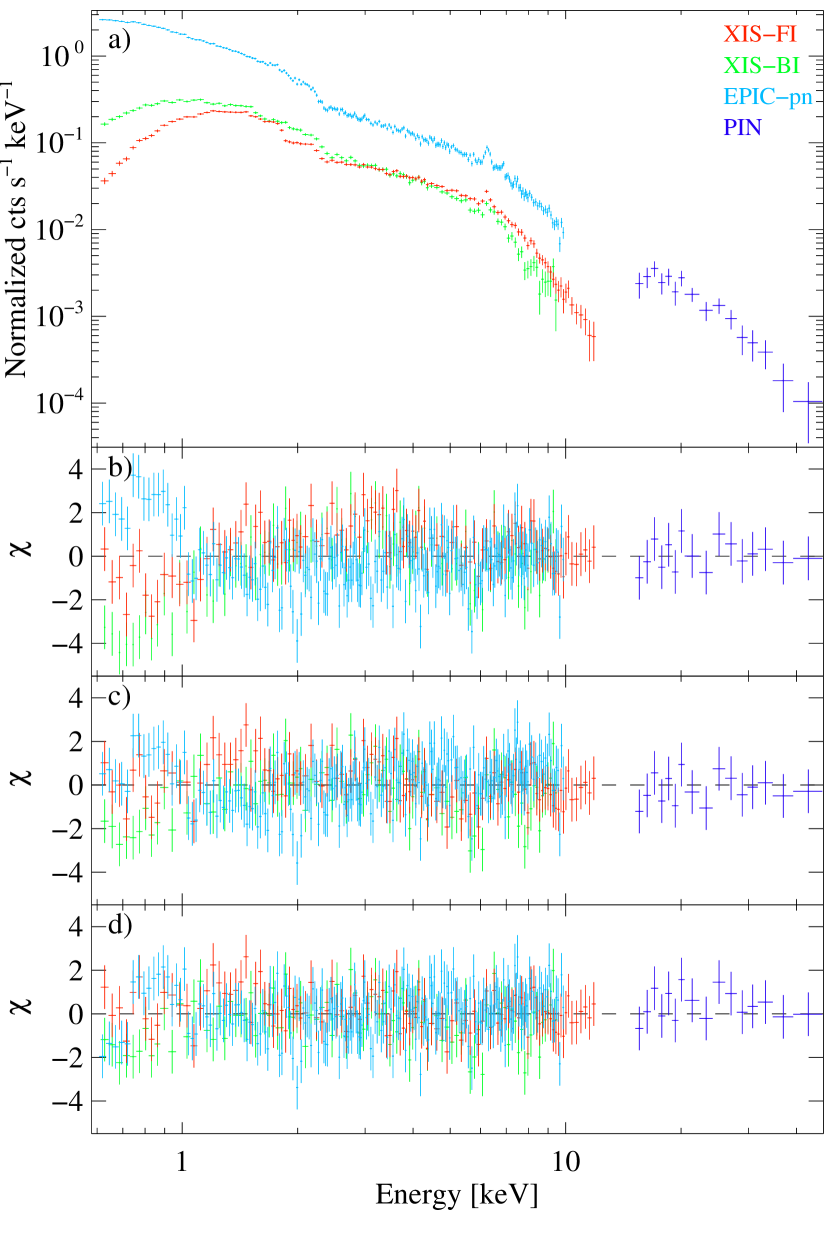
Searching for the source of this discrepancy we re-reduced the 2007 XMM-Newton data and analyzed the EPIC-pn spectrum between 0.6 and 10 keV. The EPIC-pn camera (Strüder et al. 2001) was operated in small window mode with medium filter in place in order to prevent possible photon pile-up. The data were reduced with version 11.0.0 of the XMM-Newton Science Analysis Software (SAS), following the standard data reduction steps. The good exposure time after screening was 69 ks for the EPIC-pn. The radius of the source area was chosen to be 40 arcseconds and the background was extracted from the areas with no source photon contamination. We used the SAS tool epatplot to check for the presence of photon pile-up, finding none. While we have used more recent calibration files, model fitting resulted in values consistent with those of Longinotti et al. (2007). We found that the 2–10 keV flux of the source in 2004 was very similar to our 2011 observation (7.5 erg cm-2 s-1). We therefore decided to try fitting the XMM-Newton and Suzaku data simultaneously. The combined data set and residuals to the models we applied are shown in Figure 3.
We applied our best fit “basic” model derived from the Suzaku spectrum (power law with Galactic absorption plus Compton hump and Fe lines, with no soft excess) to both spectra simultaneously, allowing for a free constant renormalization factor between the XIS and EPIC-pn, but otherwise keeping all spectral parameters (including ) tied. It was not significant to leave the Fe line normalization untied. This yielded a poor fit with dof = 782/438 and confirmed that a spectral change had indeed taken place between the two observations. Residuals for this fit are shown in Figure 3b and a clear divergence can be seen between the two observations. We next untied the photon index between the two observations. This yielded an acceptable fit with dof = 550/437. We also fit a model with the photon index tied as before, but including an additional power law to model the soft excess with its normalization free between the two observations. This yielded an improved fit with dof = 478/435. Parameters for both of these fits are listed in Table 1. Results using a blackbody soft excess model were qualitatively similar with the blackbody temperature tied between the data sets yielding a best fit of 180 eV, a normalization for the EPIC-pn data of (7.9) corresponding to a luminosity of (8) erg s-1 and for Suzaku an upper limit of 3 or blackbody luminosity of erg s-1, as expected from previous fits.
3.2. Fe K Complex Analysis
Next we focused on the mid-X-ray range (4–10 keV) in order to examine the Fe complex in more detail, using only the XIS-FI data since it has the best sensitivity in this range. We began with the model from the broad fitting, freezing the continuum and Compton reflection parameters since these parameters are best determined from the broad fit. Note that the Fe edge at 7.11 keV is included in the pexrav model and that the depth was therefore a fixed quantity in these fits. We noticed residuals around 7 keV which could indicate the presence of an Fe XXVI emission line arising in highly ionized material or an Fe K line arising in mostly neutral material. We added a Gaussian component with tied to that of the Fe K line and found a best fit energy centroid of 7.03 keV and an intensity of 3.6 ph cm s-1 or 40% of the Fe K line. The improvement in fit when adding this component was /dof= 6/3, which is not a substantial improvement, however it is consistent with the presence of either Fe XXVI or a K line. Adding an Fe K line with energy frozen at 7.056 keV and intensity equal to 13% that of the Fe K line resulted in an upper limit to a Fe XXVI of 2.8 ph cm-2 s-1. Testing for the additional presence of Fe XXV emission did not reveal a significant detection; the upper limit to the line intensity was 9 ph cm-2 s-1. We tested for an additional broad Fe K line but found only an upper limit for the normalization of ph cm-2 s-1 and an eV using the diskline model in xspec with , and as free parameters (however their values were poorly constrained by the fit since the normalization of the line was consistent with 0).
4. Discussion and Conclusions
The Suzaku spectrum of Mkn 590 shows many components typical to Seyferts, including a moderate photon index and a strong narrow Fe K line. We found an upper limit to the width of the Fe K line of 80 eV corresponding to a FWHM velocity of km s-1, assuming (Netzer 1990). Assuming Keplerian motion this corresponds to a distance of 0.0026 pc or 3.1 lt days. This is consistent with results from Longinotti et al. (2007) who found a resolved K line with a FWHM velocity of 4000 km s-1. Both of these results are consistent with measurements of the H line width of 2000 km s-1 (Stirpe 1990), however it remains unclear if the Fe emission is associated with the broad line region. We also measured a line at 7.0 keV which is likely Fe K emission from neutral or at most moderately ionized Fe, however we cannot rule out a contribution from Fe XXVI.
We measured the strength of the Compton reflection component in this source, however the amount of reflection we measure is highly dependent on the model chosen. In the best fit to the Suzaku data we found a relatively low value for , however residuals for the PIN data are consistently above the line in this fit. This could indicate that there is a stronger reflection component, but increasing the value manually leads to significant residuals between 5 and 10 keV in the XIS, particularly for the BI. Allowing the PIN normalization to be free reduced the value of to 0.1 but with a normalization constant of 1.65 between the PIN and the XIS, much higher than calibration by the instrument team allows it should be. We conclude that it is likely the Compton reflection strength in this source is in the range =0.2–1 based on the basic fit to the Suzaku data and the soft excess model fit to the combined data. A more sensitive hard X-ray detector or a longer integration time would be required to give more definitive results.
4.1. The Soft X-ray Conundrum
The flux of the source measured in 2011 January was very similar to the XMM-Newton measurement from 2004. Given the similarity in flux level for these two observations, we did not expect significant deviation in the spectral characteristics of the source. However it was clear that no soft excess was detected in the Suzaku data. If indeed a soft excess was detected in the XMM-Newton observation then it has weakened by at least a factor of 30 in 7 years, while the 2–10 keV flux has remained relatively constant. If instead the XMM-Newton observation captured the source in a softer state, then has hardened by 0.10, a significant change given that the source is at a virtually identical flux level. Sobolewska & Papadakis (2009) analyzed nine Seyferts with longterm monitoring data from RXTE, and measured flux, observed and in most cases Fe line EW. Their Figure 8 shows that on average a change in of 0.1 would be accompanied by a change in the 2–10 keV flux by a factor of 1.5–2. This is not to say that this source is not variable. Mkn 590 was monitored over the course of 1 year between 2000 and 2001 by RXTE which observed a range of 2–10 keV fluxes of 1–5 erg cm-2 s-1 (Markowitz & Edelson 2004). Swift-BAT measured an average flux in the 14–195 keV range of 3.7 erg cm-2 s-1 corresponding to 8.6 erg cm-2 s-1 (Tueller et al. 2008), similar to both the Suzaku and XMM-Newton observations.
We have looked into the possibility of contamination by sources in the field of view such as from an ultra-luminous X-ray source (ULX) or background AGN. Longinotti et al. (2007) found two serendipitous sources in the XMM-Newton field of view but neither was close enough (each around 190”) to contaminate either the XMM-Newton or Suzaku data. The 2004 Chandra ACIS data revealed a third source only 7” offset from Mkn 590, however the flux of this source was only 3 erg cm-2 s-1 in the 0.3–10 keV band or roughly 1.4 erg cm-2 s-1 in the 0.3–2 keV range. Longinotti et al. (2007) noted that the source is at the same luminosity distance as Mkn 590 of 105 Mpc so that this source would have a luminosity of 4.3 erg s-1, consistent with a ULX at a distance of 3.6 kpc from the AGN. This is two orders of magnitude lower than the flux of the AGN and about fifty times lower than that of the soft component detected in the XMM-Newton data in the 0.3–2 keV range. It therefore seems most likely that the variability we have observed is intrinsic to the AGN and is simply an unexplained facet of the soft excess.
A weakening or strengthening of the soft excess has been seen in other AGNs, however in most cases it also involved a change in flux state. For example, Markowitz & Reeves (2009) reported that NGC 4593 had a soft excess that weakened by a factor of 20 between an XMM-Newton observation and a Suzaku observation 5 years later which caught the source in a low hard X-ray flux state. However, it has been observed that variations in the soft excess can be independent of those in the hard power-law (e.g., Edelson et al. 2002), suggesting the possibility of independent physical mechanisms at work. We can rule out blurred reflection from an ionized medium (such as the REFLION model from Ross & Fabian 2005) as a source of the soft excess in this case since our Suzaku data clearly show reflection but no soft excess. A simple blackbody soft excess component provides a good fit to the XMM-Newton data, however this model has been shown to clash with theoretical predictions for disk temperatures (e.g. Gierliński & Done 2006).
A recent XMM-Newton monitoring campaign of Mkn 509 by Mehdipour et al. (2011) revealed a variable soft excess that correlated with the optical-UV flux but not with the flux of the 2–10 keV power law flux. Mehdipour et al. (2011) were able to successfully apply models describing the soft excess as being produced by thermal Comptonization by a warm (0.2 keV) optically thick () corona surrounding the inner regions of the disk. This is an important result that may reveal a long sought-after link between the X-ray spectral properties of a source and the optical/UV thermal accretion disk emission and could explain the extreme behavior in Mkn 590. If a soft excess was present in the past and has recently vanished, then we would expect to see a significant drop in the UV flux of this source if this link exists. Unfortunately, there was no optical/UV observation simultaneous with the Suzaku observation. Future monitoring of this source with simultaneous UV and X-ray instruments would be required to confirm or exclude this hypothesis.
Further monitoring would also add to the small but growing number of observations tracking variations in the soft excess that are independent of variations displayed by the hard X-ray coronal power law. Mehdipour et al. (2011) found a variability range of 1–1.7 erg s-1 for Mkn 509 over the course of 36 days. Mkn 590 and NGC 4593 have both shown much larger changes, factors of 20–50, on a scale of years. Turner et al. (2001) reported a decrease by a factor of nearly 3 in the soft excess of the NLSy1 Ark 564 across a 35-day ASCA campaign. During this time the hard power-law varied strongly on timescales of hours but on average varied by a factor of only 1.7 across the whole campaign. Edelson et al. (2002) noted a qualitatively similar trend for the NLSy1 Ton S180 with systematic trends on timescales of days–weeks in the soft band independent of variations exhibited above 2 keV. It should be noted that since both Ark 564 and Ton S180 are narrow line Seyferts they are likely in a different luminosity regime (relative to Eddington) and may be experiencing different physical processes, particularly with regards to the Compton up-scattered component of the soft excess (Done et al. 2012) and direct comparison with these objects should be done with caution. Nevertheless, understanding how the soft excess varies over a range of timescales could help pin down the source of this feature. Further investigations which calculate the variability amplitude on multiple timescales would be greatly beneficial, but would require sustained spectral monitoring with instruments sensitive enough in the soft band to give precise measurements of the soft excess luminosity.
References
- (1)
- (2) Arnaud K. A., et al. 1985, MNRAS, 217, 105
- (3)
- (4) Boldt, E. 1987, PhR, 146, 215B
- (5)
- (6) Done, C., Davis, S.W., Jin, C., Blaes, O. & Ward, M. 2012, MNRAS, 420, 1848
- (7)
- (8) Edelson, R., Turner, T.J., Pounds, K., Vaughan, S., Markowitz, A., Marshall, H., Dobbie, P. & Warwick, R. 2002, ApJ, 568, 610
- (9)
- (10) Fukazawa, Y., et al. 2009, PASJ, 61, 17
- (11)
- (12) Gierliński, M. & Done, C. 2006, MNRAS, 371, L16
- (13)
- (14) Haardt, F., Maraschi, L., & Ghisellini, G. 1994, Apj, 432, 95
- (15)
- (16) Kalberla, P.M.W., Burton, W.B., Hartmann, Dap, Arnal, E.M., Bajaja, E., Morras, R., & Pöppel, W.G.L., 2005, A&A, 440, 775
- (17) Koyama et al. 2007, PASJ, 59S, 23
- (18)
- (19) Longinotti, A.L. et al. 2007, A&A, 470, 73
- (20)
- (21) Magdziarz, P. & Zdziarski, A.A. 1995, MNRAS, 273, 837
- (22) Markowitz, A. & Edelson, R. 2004, ApJ, 617, 939
- (23) Markowitz, A. & Reeves, J.N. 2009, ApJ, 705, 496
- (24) Mehdipour, M. et al. 2011, A&A, 534A, 39
- (25)
- (26) Nandra, K. & Pounds, K. A., 1994, MNRAS, 268, 405
- (27) Netzer, H. 1990, in Active Galactic Nuclei, Saas-Fee Advanced Course 20, ed. T. J.-L. Courvoisier & M. Major (Berlin : Springer), 57
- (28)
- (29) Reeves, J.N. et al. 2004, ApJ, 602, 648;
- (30) Rivers, E., Markowitz, A., & Rothschild, R. E. 2011, ApJS, 193, 3
- (31) Ross, R.R. & Fabian, A.C., 2005, MNRAS, 358, 211
- (32)
- (33) Sobolewska, M.A., & Papadakis, I.E., 2009, MNRAS, 339, 1597
- (34) Suchy, S., et al. 2011, ApJ, 733, 15
- (35) Stirpe, G.M., 1990, A&AS, 85, 1049
- (36) Strüder, L. et al. 2001, A&A, 365, 18
- (37)
- (38) Takahashi et al. 2007, PASJ, 59, 35
- (39) Tueller, J. et al. ApJS, 186, 378
- (40) Turner, T.J., Romano, P., George, I.M., Edelson, R., Collier, S., Mathur, S., & Peterson, B.M., 2001, ApJ, 561, 131
- (41) Turner, T.J. et al. 2005, ApJ, 618, 155
- (42)
- (43) Vaughan, S. et al. 2004, MNRAS, 351, 193
- (44) Verner, D.A., Ferland, G.J., Korista, K.T., & Yakovlev, D.G. 1996, ApJS, 465, 487
- (45) Vestergaard, M. & Peterson, B. 2006, 641, 689
- (46)
- (47) Weaver, K. et al. 1995, ApJ, 451, 147
- (48) Wilms, J., Allen, A., & McCray, M. 2000, ApJ 542, 914
- (49)