A blind HI survey in the Ursa Major region ††thanks: The data cubes were obtained with the Lovell telescope at the Jodrell Bank observatory, UK.
Abstract
We have conducted the first blind H I survey covering 480 deg2 and a heliocentric velocity range from 300–1900 km s-1 to investigate the H I content of the nearby spiral-rich Ursa Major region and to look for previously uncatalogued gas-rich objects. Here we present the catalog of H I sources. The H I data were obtained with the 4-beam receiver mounted on the 76.2-m Lovell telescope (FWHM 12 arcmin) at the Jodrell Bank Observatory (UK) as part of the H I Jodrell All Sky Survey (HIJASS). We use the automated source finder DUCHAMP and identify 166 H I sources in the data cubes with H I masses in the range of 107–1010.5 M⊙. Our Ursa Major H I catalogue includes 10 first time detections in the 21-cm emission line.
We identify optical counterparts for 165 H I sources (99 per cent). For 54 H I sources ( per cent) we find numerous optical counterparts in the HIJASS beam, indicating a high density of galaxies and likely tidal interactions. Four of these H I systems are discussed in detail.
We find only one H I source (1 per cent) without a visible optical counterpart out of the 166 H I detections. Green Bank Telescope (FWHM 9 arcmin) follow-up observations confirmed this H I source and its H I properties. The nature of this detection is discussed and compared to similar sources in other H I surveys.
keywords:
surveys – catalogs – radio emission lines – galaxies: fundamental parameters1 Introduction
The distribution of galaxies in the Universe is not uniform – galaxies are found in filamentary structures, groups and clusters (e.g. Colless et al. 2001). The observed ‘cosmic web’ structure is in good agreement with numerical simulations according to Cold Dark Matter cosmology (e.g. Springel et al. 2005; Simon & Geha 2007), whereby gravity drives the formation of structure from small, primordial, Gaussian fluctuations. Dark matter haloes grow through merging and accretion of smaller ones. Within the dark matter haloes, galaxies form by cooling of baryons (e.g. White & Rees 1978). Hence, small dark matter haloes are the primordial building blocks of larger structures in the hierarchical model of structure formation.
Dwarf irregular galaxies with low stellar luminosity and low surface brightness galaxies are typically discovered in neutral hydrogen (H I) surveys (Schombert et al. 1992, Minchin et al. 2003, Giovanelli et al. 2005), as they are rich in neutral gas but difficult to detect in optical or infrared surveys. Whilst optical surveys are most sensitive to high surface brightness early-type galaxies (Disney, 1976), H I surveys are unbiased by stellar populations and are most likely to detect gas-rich late-type spirals and irregular galaxies. Hence optical and H I surveys complement each other as there is a rough correlation between increasing H I content from early to late type galaxies and decreasing optical surface brightness with morphological type (Toribio et al., 2011). Discoveries in H I surveys also include intriguing objects, e.g. the detection of an H I-massive cloud without stellar counterpart, within the NGC2442 group (Ryder et al., 2001), extended H I arms or tidal tails (Koribalski & López-Sánchez, 2009) and H I between galaxies in groups (Koribalski & Manthey 2005, Kilborn et al. 2006, English et al. 2010). Large-area blind H I surveys have been conducted such as the Arecibo HI Strip Survey (AHISS, Zwaan et al. 1997), the Arecibo Dual Beam Survey (ADBS, Rosenberg & Schneider 2000), the H I Jodrell All-Sky Survey (HIJASS, Lang et al. 2003), the H I Parkes All-Sky Survey (HIPASS, Staveley-Smith et al. 1996, Barnes et al. 2001, Koribalski et al. 2004, Meyer et al. 2004), the Arecibo Legacy Fast ALFA survey (ALFALFA, Giovanelli et al. 2005) and the Arecibo Galaxy Environment Survey (AGES, Auld et al. 2006). Upcoming H I surveys such as the ASKAP H I All-Sky Survey (known as WALLABY, Koribalski & Staveley-Smith 2009111http://www.atnf.csiro.au/research/WALLABY/proposal.html) will further contribute to our knowledge of gas-rich galaxies in the local Universe.
Isolated galaxies tend to have noticeably different properties from galaxies residing in dense regions. Observations have shown that early-type galaxies are common in clusters whereas late-type galaxies dominate the less dense environments (morphology-density relation; e.g. Dressler 1980). The importance of environment and the idea of transformation of galaxies in dense environments arose when Butcher & Oemler (1978) discovered that galaxy clusters at higher redshift contain a population of blue galaxies which nearby galaxy cluster counterparts are missing. However, it is still a matter of debate, which properties correlate with the decrease of blue galaxies from high- to low-redshift galaxy clusters, e.g. X-ray luminosity (Andreon & Ettori 1999; Fairley et al. 2002), richness (Margoniner et al. 2001; De Propris et al. 2004), cluster concentration (Butcher & Oemler 1984; De Propris et al. 2004), presence of substructure (Metevier et al. 2000), cluster velocity dispersion (De Propris et al. 2004). Lewis et al. (2002) and Gómez et al. (2003) discuss the correlation between star formation rate and local projected density. The authors find low star formation rates at 2-3 virial cluster radii – which is equivalent to poor galaxy group densities. Therefore, galaxies may be preprocessed in groups, as physical processes in the studied clusters can not solely account for the observed variations in galaxy properties. Galaxy transformation as a smooth function of environment is also suggested by Cappellari et al. (2011) in terms of a kinematic morphology-density relation, i.e. separation into fast and slow rotators.
There have been a number of studies on the effect of environment on the H I content of galaxies in clusters (e.g. Giovanelli & Haynes 1985, Solanes et al. 2001, Gavazzi et al. 2005, Chung et al. 2009), and loose groups (e.g. Kilborn et al. 2005; Omar & Dwarakanath 2005). Through observations of isolated galaxies, we can define the expected H I mass in normal spiral galaxies of a particular linear optical diameter and morphological type. In dense regions, such as clusters, there is often an H I deficiency observed, indicating that H I gas is removed from galaxies in these environments (e.g. Solanes et al. 2001). Recent observations have found a similar H I deficiency in the less dense group environments (Omar & Dwarakanath 2005, Kilborn et al. 2009) indicating that the spirals may begin to lose their H I reservoir well before reaching the dense centre of a cluster.
An ideal target to study the effect of environment on the evolution of gas-rich galaxies, is the nearby Ursa Major cluster and its surroundings as most of the known member galaxies are late-type galaxies. The Ursa Major cluster is quite different in its nature compared to the well-known and similarly distant Virgo and Fornax clusters. Generally clusters are composed of hundreds of gas-poor early-type galaxies clustered around a central larger elliptical (e.g. Dressler 1980). The Ursa Major cluster is smaller – Tully et al. (1996) identified 79 high-probability cluster members. The cluster is essentially composed of late-type galaxies, in particular spiral galaxies with normal gas content, that are not centrally concentrated (Tully et al., 1996). This lack of a concentration towards any core and the overlap with many groups nearby the cluster might explain why the Ursa Major cluster is less studied compared to the Virgo and Fornax clusters. The several groups nearby the Ursa Major cluster make studying its dynamics a complex problem and the cluster difficult to define (Appleton & Davies 1982, Tully et al. 1996). However, Tully et al. (1996) define the cluster members to lie within a projected 7.5∘ circle centered at and with heliocentric velocities between 700 and 1210 km s-1.
The cluster lies at a distance of 17.1 Mpc (Tully et al., 2008). The few previous studies of the Ursa Major cluster have found that it has a low velocity dispersion of only 148 km s-1, a virial radius of 880 kpc (Tully et al., 1996) and no X-ray emitting intra-cluster gas has yet been detected (Verheijen & Sancisi, 2001). The Ursa Major cluster has a total mass of M⊙ (Tully, 1987) and a B-band absolute luminosity of L⊙ (Tully et al., 2008). Compared to the Virgo cluster this is about 30 per cent of its light but only 5 per cent of its mass (Tully 1987, Tully et al. 2008). The number of H I-rich galaxies in Ursa Major is comparable to those in Virgo (Tully et al., 1996) and the Ursa Major cluster almost meets the Abell richness 0 standard. To qualify as an Abell richness class 0 the criteria are (i) 30 galaxies in B or (ii) 26 in R within 2 mag of the third brightest galaxy. The Ursa Major cluster is slightly short - 29 galaxies in B and 25 in R (Tully et al., 1996). Besides Ursa Major, only the Virgo cluster has such a high abundance of H I-rich galaxies on a 2 Mpc-scale in the nearby Universe ( 3000 km s-1) (Tully et al., 1996).
Zwaan et al. (1999) note that the mostly late-type galaxies in the Ursa Major cluster do not seem to be seriously affected by tidal interactions indicating that the system is in an early evolutionary state. However, Verheijen & Sancisi (2001) studied 43 spiral galaxies in detail and found 10 interacting systems that show distorted morphologies and tidal debris. There is a deficiency of known dwarf galaxies in the Ursa Major cluster – there are only two dozen dwarfs, whereas up to could be expected to be found if the same steep luminosity function claimed for Virgo was valid for the Ursa Major cluster (Trentham et al., 2001). To date, (i) the small number of dwarf galaxies, (ii) the low velocity dispersion, (iii) the non-detection of X-ray emitting intra-cluster gas, (iv) the low abundance of elliptical galaxies in the cluster and (v) the total mass challenge the question ”why not call it a group?”. Clusters usually have a broader velocity distribution, a hot intra-cluster gas which can strip the galaxies off their H I gas and an enhanced population of both the early-type (S0 and E) galaxies and the H I depleted spiral galaxies. As the majority of the Ursa Major members are H I-rich spiral galaxies such as those one finds in the field, the distinction between the ‘Ursa Major cluster’ as opposed to an ‘Ursa Major group’ isn’t clear. One hypothesis is that Ursa Major is a newly forming cluster given that the estimated crossing time is approximately half a Hubble time, in contrast to Virgo and Fornax where the crossing times are 0.08 and 0.07 , respectively (Tully et al., 1996).
In this paper we present the catalogue of H I sources as detected in the first blind H I survey of the Ursa Major region (approximately 480 deg2). The analyzed region overlaps with the Canes Venatici region for which Kovač et al. (2009) have conducted a deep blind H I survey (H I mass sensitivity M⊙) using the Westerbork Synthesis Radio Telescope (WSRT) in an area of 86 deg2 ( km s-1). Our H I data were obtained as part of the H I Jodrell All Sky Survey (HIJASS). The data acquisition and determination of the H I sources are described in Section 2 including a discussion of the catalogue completeness and reliability. The H I properties of the sources are presented in a catalogue in Section 3. The H I mass limit of the presented catalogue is 2.5 M⊙ assuming a velocity width of 100 km s-1 and a distance of 17.1 Mpc. First results and basic property distributions of the HIJASS sources are presented in Section 4. Furthermore, we identify galaxy pairs/systems that are high-probability candidates for galaxy-galaxy interactions and discuss four systems in detail, two of which show strikingly extended H I content.
In a forthcoming paper we will investigate the nature of the Ursa Major cluster/group and probe the hypothesis that it is a newly forming cluster. We will study substructures and their dynamics, and present dynamical masses, total mass-to-light ratios etc. for both individual galaxies and the subregions. Furthermore, to investigate the H I properties of galaxies residing in different density regions, we will analyze the H I sources in the Ursa Major cluster and compare them to galaxies residing in foreground groups and the less dense filament connecting the Ursa Major with the Virgo cluster, which lies south of Canes Venatici.
2 Observations and Data Analysis
2.1 Data acquisition and processing
The H I data cubes analyzed in this paper were obtained in 2001–2002 as part of the H I Jodrell All Sky Survey (HIJASS) (Lang et al., 2003). The blind H I survey was conducted using the 4-beam receiver mounted on the 76.2-m Lovell telescope at Jodrell Bank observatory, UK. HIJASS covered more than 1000 deg2 in the northern sky () complementary to (i) the H I Parkes All Sky Survey (HIPASS) which surveyed the entire southern sky () from 1997 to 2000 (Staveley-Smith et al., 1996; Barnes et al., 2001; Koribalski et al., 2004) and (ii) the northern extension to HIPASS () carried out in 2000 to 2002 (Wong et al., 2006). HIJASS provides the first blind H I survey of the nearby Ursa Major cluster and its surroundings. To investigate the Ursa Major region we only consider velocities in the range 300 to 1900 km s-1 (all velocities are given in the optical convention ). Sources with systemic velocities below 300 km s-1 are excluded to minimize confusion with high-velocity clouds and Galactic emission – an exception are 15 obviously real galaxies with systemic velocities between 150 and 300 km s-1 that are included in the catalogue. We note that HIJASS data suffers from a broad band of radio-frequency interference between 4500 and 7500 km s-1 (Lang et al., 2003), which lies outside our studied velocity range.
The Ursa Major region is covered by seven HIJASS data cubes measuring and one HIJASS cube measuring in size (the sky coverage is approximately 480 deg2). The cubes span a range in right ascension (RA) between 10h45m and 13h04m and a range in declination (Dec.) between 22∘ and 54∘. We note that the analyzed region overlaps with the Canes Venatici region for which Kovač et al. (2009) have conducted a deep blind H I survey in an area of 86 deg2 ( km s-1). The HIJASS cubes have a spatial pixel size of arcmin2. In the third dimension, the channel spacing is 62.5 kHz which corresponds to an increment of 13.2 km s-1 at the rest frequency of H I. The velocity resolution is 18 km s-1 after smoothing to reduce ‘ringing’ caused by Galactic emission (applying 25 per cent Tukey filter). The root mean square (rms) noise level in the analyzed data is 12–14 mJy beam-1. To minimize edge effects the overlapping HIJASS data cubes are mosaiced to one mega-cube. For further information on data reduction, the Lovell telescope and HIJASS see Lang et al. (2003).
The angular resolution of the Lovell telescope at 1.4 GHz is 12.0 arcmin (Lang et al., 2003). The gridding process (using similar parameters as for HIPASS) slightly degrades the angular resolution (see Barnes et al. 2001). According to Barnes et al. (2001) the resultant beam size is not well-defined and depends on smoothing radius, pixel size, source position, shape and strength (signal-to-noise ratio) as the gridding is a non-linear process. One can only assess the gridded beam size by analysing simulations and synthetic source injections. To determine the gridded beam size, we inject synthetic point sources into the raw data and measure their properties after the gridding process. We determine the full width at half-maximum beamwidth (FWHM) of a two-dimensional Gaussian fit to the synthetic sources, analogous to Barnes et al. (2001). The measured beamwidths vary as a function of source peak brightness (in Jy beam-1, which corresponds to Jy for point sources). Given a wide range of peak flux densities in the presented catalogue – the majority of sources have mJy and a few strong sources range to 3.5 Jy in peak flux density – we determine two appropriate beamwidths: (i) 13.10.9 arcmin for the majority of sources with 300 mJy and (ii)12.40.6 arcmin for sources with 300 mJy.
The peak and integrated fluxes of point sources are preserved during the gridding process but for extended sources, the peak and integrated fluxes require a correction: We calculated the correction factors by similarly injecting synthetic extended sources into the raw data and measure their properties after the gridding process (analogous to Barnes et al. 2001). The correction factors for extended sources as a function of FWHM are given in Table 1. We obtain this function by fitting a third order polynomial to the median data points (with of 99.9%). In our catalogue (Section 3.2), we quote both the measured and corrected fluxes for extended sources.
| Coefficient | ||
|---|---|---|
| 1.112 | 1.003 | |
2.2 Data analysis using DUCHAMP
We use the automated source finder DUCHAMP-1.1.8 (Whiting, 2012)222http://www.atnf.csiro.au/people/Matthew.Whiting/Duchamp on the H I data cube to compile our initial candidate galaxy list. DUCHAMP is based on a threshold method and searches for groups of adjacent pixels in position and velocity that are above the given threshold, which is estimated from the cube statistics (in Jy beam-1) or alternatively specified from the user as a peak flux density value. Furthermore the user can (i) reduce the noise prior to the searching via wavelet reconstruction and/or smoothing (spatial or spectral) and (ii) control various parameters such as the minimum extent of the detections in pixels and/or channels. DUCHAMP provides a list of the H I detections and their properties, the H I spectra and integrated H I intensity maps (moment zero). The DUCHAMP outputs need to be inspected carefully as H I sources are occasionally merged. We can identify such sources by eye and separate them when they do not overlap both spatially and spectrally.
We made a comprehensive test of various input parameters and methods to facilitate DUCHAMP detections of low peak flux and extended H I sources without disproportionally increasing noise detections (see Section 2.3 and 2.5). We first apply a spectral Hanning smoothing to the HIJASS data and then reconstruct them with the ‘à trous’ wavelet method. Hanning smoothing correlates neighbouring pixels in the spectral domain and determines the weighted average flux over a certain number of channels – the channel spacing remains 13.2 km s-1. We determine that the optimal Hanning smoothing width for the data is seven channels (see Section 2.3). The wavelet method reconstructs each spectrum separately and we chose the following criteria when compiling the DUCHAMP detection list: (i) the detection must be contiguous in two channels and (ii) the peak flux density of the candidate galaxies must be above 16 mJy. This is an approximate 2.5 peak flux density threshold as the mean noise level in the smoothed and reconstructed cube is 6.6 mJy beam-1.
In this paper, we only consider 5 detections in peak flux in the edge-masked HIJASS megacube to present a reliable and complete catalogue of H I sources in the Ursa Major region within 300 to 1900 km s-1. This corresponds to a minimum in peak flux density of 33 mJy and an H I mass limit of M⊙ (assuming a velocity width of 100 km s-1 and a distance of 17.1 Mpc). These selection criteria lead to a DUCHAMP detection list with 140 candidate galaxies including merged detections (doubles to quads) that are labelled in Section 3.2.
2.3 Catalogue reliability – Negative troughs
To test the reliability of the peak flux DUCHAMP detection list, we investigate the negative troughs in the edge-masked HIJASS cube. When using the selection criteria as discussed in Section 2.2, we identify 25 negative troughs with mJy and 26.4 km s-1. All 25 negative troughs can be associated with negative bandpass sidelobes, i.e. an artifact of bandpass removal which is apparent north and south of strong HI sources (see e.g. Barnes et al. 2001). This lack of negative detections (noise peaks) indicates that the positive DUCHAMP candidate galaxy list with 33 mJy and 26.4 km s-1contains high-probability real H I sources.
Hanning smoothing is known to enhance the brightness of sources – on the scale of the smoothing width – with respect to the noise in each channel map, but reduces the peak strength (signal-to-noise) of sources on other scales. Whiting (2012) shows that an appropriately chosen smoothing width can still increase the recovery rate of sources on different scales than the smoothing width as the noise level is suppressed. However, to prevent loss of information on different scales, we also use the wavelet reconstruction to further suppress the noise and to enhance structures on various scales (narrow and broad profiles). Using wavelet reconstruction also suppresses noise peaks, baseline ripples or radio-frequency interferences as discussed in Westmeier et al. (2011). For further information on DUCHAMP and the noise suppression methods see Whiting (2012).
Some restrictions on spatial and spectral extent of DUCHAMP detections greatly improve the reliability, such as the applied minimum number of channels () in which the detection must be contiguous (Whiting, 2012). The selection criteria as listed in Section 2.2 are chosen to limit the number of false detections and to present a reliable catalogue of H I sources in the Ursa Major region in this paper.
2.4 Catalogue reliability – Follow-up observations
The reliability of the catalogue is increased by follow-up observations and rejection of unconfirmed sources from the catalogue. We re-observed 17 apparent first time detections in HIJASS with the Green Bank Telescope (GBT, FWHM 9 arcmin) – nine of which have an associate optical counterpart that match in position and velocity to the H I detection and eight candidate galaxies/H I clouds without a previously catalogued optical counterpart. The rms noise level is between 4 and 7 mJy for H I sources with an associate optical counterpart and approximately 3 mJy for the candidate galaxies/H I clouds. Given that the lowest peak flux density of the candidate galaxies/H I clouds is 33 mJy, this will lead to signal-to-noise detections . The velocity resolution of the GBT data is 3.3 km s-1 after boxcar smoothing.
The GBT follow-up observations confirmed all nine H I sources with an associate optical counterpart. However, only one out of the eight candidate galaxies/H I clouds was confirmed, namely HIJASS J1219+46. Therefore, 7 initial DUCHAMP detections are excluded from the presented catalogue in this paper. Inspecting the original as well as the smoothed and resonstructed data cubes by eye reveal that the unconfirmed detections are noise peaks on top of large-scale baseline ripples. DUCHAMP provides an option ‘flag baseline’ which removes the baseline from each spectrum prior to compiling the detection list. However, we did not utilize this option as not only does it remove all candidate galaxies/H I clouds from the detection list, some of the faint H I detections with an associate optical counterpart were not included as well.
2.5 Catalogue completeness – Synthetic source injection
|
|

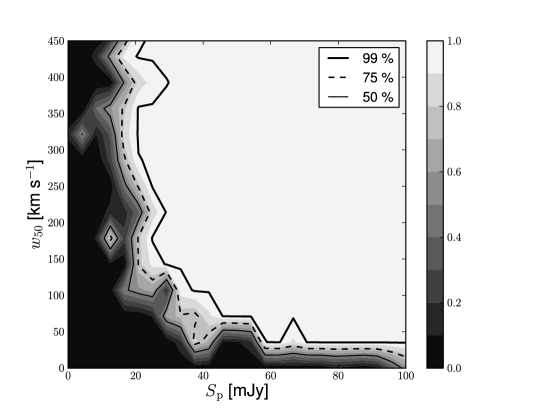
To measure the catalogue completeness we insert numerous synthetic point sources into the eight HIJASS cubes, prior to running DUCHAMP. The rate at which the synthetic sources are recovered reflects the completeness, as discussed explicitly in Zwaan et al. (2004) (also see Wong et al. 2006). The criteria for a recovered synthetic source are a DUCHAMP detection within 10 arcmin and 200 km s-1 of the original position and velocity of the synthetic source (the average position and velocity accuracies for H I sources with peak flux densities below 100 mJy are 1.2 arcmin and 14 km s-1, respectively).
The synthetic point sources are given a Gaussian spectral shape and have random positions, 50 per cent velocity widths and peak flux densities (Kilborn et al., 2009). The 50 per cent velocity widths are 500 km s-1 and the peak flux densities are 100 mJy. The synthetic sources are placed away from the noisy edges of the data cube and are not placed on top of other sources either synthetic or real (the positions of the real sources are according to an initial DUCHAMP output list).
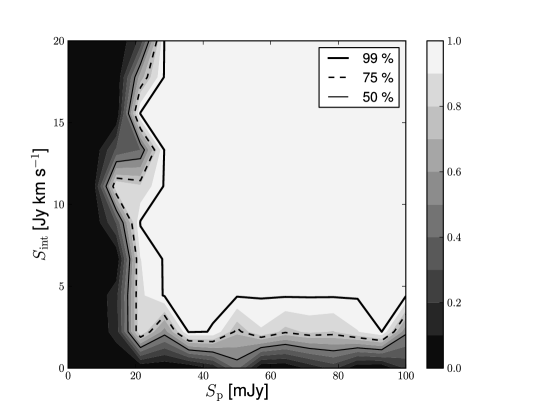
A total of 2000 synthetic sources are inserted into each HIJASS data cube to obtain the DUCHAMP completeness. For a representative HIJASS cube the completeness is shown in Figure 1. We use natural neighbor interpolation to achieve the grey-scale representation of the completeness depending on and or and integrated flux (which is a combination of both and ).
To measure the catalogue completeness as a function of one parameter only - , or - we integrate along the other variable of the completeness as discussed in Zwaan et al. (2004). We integrate above the DUCHAMP selection parameters which are 26.4 km s-1 and 16 mJy. These values mark the DUCHAMP detection limit in the smoothed and reconstructed cube – below these values the completeness drops to zero. Figure 2 shows this differential completeness (circles) as well as the cumulative (crosses) completeness as defined by Zwaan et al. (2004). Figure 2 also shows the error function fit to the data to determine the 95 per cent confidence levels which lie at 33 mJy and 2.63 Jy km s-1. The 99 per cent completeness levels are achieved at 45 mJy and 3.55 Jy km s-1. Therefore, the peak flux density limited catalogue (at 33 mJy) presented in Section 3 is 95 per cent complete.
2.6 Catalogue completeness – Literature comparison
As an additional measure of completeness we compare our results (Section 3.2) to an overlapping deep blind H I survey in the Canes Venatici region using WSRT (area of 86 deg2, km s-1 with an H I mass sensitivity of M⊙; Kovač et al. 2009). We find that our presented catalogue contains all but one H I sources in the velocity range 300 to 1330 km s-1, with 33 mJy and 2.63 Jy km s-1 (95 per cent completeness level) as listed in Kovač et al. (2009) – the exception is NGC4460 ( km s-1) with mJy and Jy km s-1 (Kovač et al., 2009). We investigated the HIJASS data cube (by eye) and identify NGC4460 at the end of negative bandpass sidelobes emerging from the strong double source NGC4490/NGC4485. NGC4460 has reduced peak brightness ( mJy beam-1) due to the negative bandpass sidelobes, which prevents this H I source to be listed in our catalogue. We conclude that negative bandpass sidelobes may cause a deficit in completeness for sources with mJy and km s-1 (see Figure 1), as their peak flux densities may lie below the detection threshold. However, this is a small effect, given the little area affected by negative bandpass sidelobes.
3 The HI catalogue
3.1 Parametrization
The sources found using DUCHAMP are parameterized with an interactive script utilising the MIRIAD software package (Sault et al., 1995). The parametrization is necessary as DUCHAMP gives initial values – dealing with double detections and obtaining reliable H I parameters requires user input. Our method is similar to Lang et al. (2003) and Koribalski et al. (2004) and this will be briefly described in the following section.
A spatially integrated spectrum is generated from the original HIJASS cube, using the DUCHAMP output parameters for each source (RA, Dec., velocity, velocity widths). The spectral extent of the H I source (velocity range) can be adjusted as necessary. An integrated H I intensity map over this velocity range is generated using the MIRIAD task MOMENT. Given a specified fitting area (in relation to the source size), IMFIT is used to determine the central position of the H I source by fitting a two-dimensional Gaussian to the integrated H I intensity map. The obtained central coordinates are used to generate a new spatially integrated spectrum weighted according to the extent of the H I source (see below). In general, we fit and subtract a first-order baseline fit to the spectrum (higher order baseline fits are labelled in the catalogue). The H I parameters such as peak and integrated flux, the velocity widths, the clipped rms noise and the systemic velocity are measured using MBSPECT. In the catalogue we quote the integrated flux measured with the robust moments, the 20 and 50 per cent velocity widths calculated from the width maximiser and the systemic velocity as the center of the 20 per cent velocity width (see Meyer et al. 2004 for definitions).
An H I source can be unresolved or extended with respect to the gridded beam size. To identify point and extended sources, we compare the integrated flux measurements obtained from (i) spectra where every pixel is weighted according to the expected beam response (beam-weighted as for point sources) to (ii) spectra where the flux is directly summed (as for extended sources). The considered area is given by a box surrounding the central position, e.g. of size pixel2 or pixel2 that correspond to and , respectively. A potentially extended source is identified due to an increase in the integrated flux from a beam-weighted spectrum to a summed spectrum in a bigger box. This increase can also occur due to confusion with a nearby H I source which might be included in the bigger box - such sources are flagged as double sources (d) in the catalogue and are parameterized by generating a beam-weighted spectrum as for point sources. Truly extended sources (e), which are indicated by an increase in the integrated flux, are confirmed by investigating the residual map of the Gaussian fit. An extended source will show flux in the residual map whereas a point source is well described by the Gaussian fit.
3.2 The HI catalogue
The DUCHAMP detection list in the smoothed and reconstructed HIJASS megacube contains 140 candidate galaxies with systemic velocities between 300 and 1900 km s-1. After the parametrization process, 4 galaxies have systemic velocities below 300 km s-1. In addition, we identified 11 H I sources with systemic velocities between 150 and 300 km s-1 that are included in the sample as they are obviously real galaxies as opposed to Galactic emission or high-velocity clouds. However, H I sources with systemic velocities below 300 km s-1 are not included in Section 4. Furthermore we identified several double, triple and quad detections that are separated during the parametrization process leading to a total of 173 H I sources that are parameterized from the original HIJASS megacube. We exclude 7 detections from the presented catalogue that are unconfirmed in GBT follow-up observations (see Section 2.4). Therefore a total of 166 H I sources are listed in our catalogue in Section 3.2.
The parameterized H I sources are cross-correlated with galaxies listed in the NASA/IPAC Extragalactic Database (NED; as of September 2012) and the Sloan Digital Sky Survey (SDSS DR8). We only consider galaxies with cross-identifications in NED and galaxies with spectroscopic redshifts with confidence levels in SDSS as possible counterparts. We associate an H I source with a catalogued galaxy, if this galaxy is within the gridded beam size (or within the extent of the H I intensity contours for large sources) and within the velocity range of the H I source. We find 54 H I sources that have multiple candidate counterparts. These are potentially confused H I sources and may be interacting systems. To determine the most likely optical counterpart (listed in the first row of the catalogue), the H I position uncertainty, the heliocentric velocity, the optical galaxy size (in relation to the H I mass and size) and the morphology are considered.
We find only one out of the 166 catalogued H I sources that does not have an associate optical counterpart listed in NED/SDSS or visible on Palomar Digitized Sky Survey (DSS) images. This candidate galaxy/H I cloud – HIJASS J1219+46 – is discussed in Section 3.4.
Table LABEL:tab:A_cat lists the H I sources and their optical counterparts as follows: column (A1) gives the HIJASS name; columns (A2)(A4) list the central H I position (RA [J2000], Dec. [J2000]) and its uncertainty (all uncertainties are discussed in Section 3.3); column (A5) contains the systemic velocity (km s-1) with its uncertainty ; column (A6) states ‘ID’ for H I detections that have an optical identification and ‘PUO’ for the previously uncatalogued gas-rich object; columns (A7)(A10) list the details of the optical counterparts, i.e. name, RA (J2000), Dec. (J2000) and heliocentric velocity (km s-1); columns (A11) and (A12) give the angular separation (arcmin) and velocity offset (km s-1) from the H I parameters. The most likely optical counterpart is given in the first row and galaxies that lie within the gridded beam or within the extent of the H I intensity contours (for large sources) and might confuse the H I content are quoted in the subsequent rows.
The measured H I properties of the HIJASS detections are given in Table LABEL:tab:B_cat. The columns are as follows: column (B1) gives the HIJASS name; columns (B2)-(B4) gives the measured and corrected peak flux densities () with its uncertainty (in Jy); columns (B5)-(B7) list the measured and corrected integrated flux () with its uncertainty (in Jy km s-1); columns (B8) and (B9) contain the velocity widths at 50 and 20 per cent of the peak flux density with their uncertainties (in km s-1); column (B10) gives the clipped rms measured in MBSPECT; column (B11) lists the distance to the galaxy (in Mpc) as obtained from the Extragalactic Distance Database (EDD; Tully et al. 2009 – only distances obtained from Color-Magnitude Diagrams, Tip of the Red Giant Branch and other high quality methods are considered) or calculated from the local group velocity (see Koribalski et al. 2004 for HIPASS) – we adopt km s-1 Mpc-1; for galaxies within the cluster definition by Tully et al. (1996) we adopt a distance of 17.1 Mpc; column (B11) gives the logarithm of the H I mass and column (B12) contains flags for 78 extended (e) and 54 confused (c) H I sources, 38 H I souces which are part of DUCHAMP double detections (d), 10 H I sources without a central position from a position fit (f) and therefore without major/minor axis measurements, 10 H I sources lying nearby negative bandpass sidelobes (b), 10 newly detected H I sources in the 21-cm emission line (n), 15 H I sources with systemic velocities below 300 km S-1 (v), 34 sources where independent distance measurements are available (i) and numbers to indicate higher order baseline fits. The H I mass in column (B11) is calculated from the integrated flux ( and for extended sources respectively) according to [M⊙] with distances as given in column (10). We note that Kovač et al. (2009) also determine adequate distances in the local group frame, neglecting peculiar velocities (using Yahil et al. 1977).
We show a velocity integrated H I map with symbols marking the projected positions of all parameterised H I sources in this catalogue in Figure 3. H I sources with an associated optical counterpart are marked with open ellipses whereas the previously uncatalogued H I source is marked with a filled ellipse (black). Furthermore previously catalogued sources that are newly detected in H I are marked with crosses. The size of the ellipses indicate the measured major axis – ellipses surrounded by boxes mark H I detections for which no central position and no extent (major and minor axis) is measurable (usually weak H I sources or double detections for which we retain the position of the optical counterpart). The projected position of the Ursa Major cluster as defined by (Tully et al., 1996) is overlaid with a large circle.
3.3 HI parameter uncertainties
In Table LABEL:tab:A_cat and LABEL:tab:B_cat we give several uncertainties of measured H I parameters which are calculated as follows:
The position uncertainty is derived from the gridded beam size () and the H I signal-to-noise (Koribalski et al., 2004):
This individual position uncertainty is considered when determining the most likely optical counterpart (see Table LABEL:tab:A_cat).
The peak flux uncertainty strongly depends on the rms noise for weak sources and to a lesser degree on the peak flux (see Barnes et al. 2001). The formula we use is analogous to the one in HIPASS (Koribalski et al., 2004), which is as follows:
The uncertainty in integrated flux is calculated as discussed in Koribalski et al. (2004) whereby
with R=18.1 km s-1, which is the velocity resolution of the HIJASS data.
| RA | Dec. | RA | Dec. | vel. | pos. & vel. offsets | ||||||
|---|---|---|---|---|---|---|---|---|---|---|---|
| HIJASS name | (J2000.0) | (J2000.0) | arcmin | km s-1 | Class | NED IDa,b | (J2000.0) | (J2000.0) | km s-1 | arcmin | km s-1 |
| (A1) | (A2) | (A3) | (A4) | (A5) | (A6) | (A7) | (A8) | (A9) | (A10) | (A11) | (A12) |
| HIJASS J1048+46 | 10:48:43.33 | 46:43:10.0 | 2.7 | 741 6 | ID | UGC05917 | 10:48:53.73 | 46:43:14.6 | 741 | 1.8 | 0 |
| HIJASS J1054+49 | 10:54:57.73 | 49:42:53.6 | 2.9 | 1347 15 | ID | UGC06029 | 10:55:02.23 | 49:43:33.1 | 1363 | 1.0 | 16 |
| - | - | - | - | - | - | J105502.69+494340.9 | 10:55:02.70 | 49:43:40.9 | 1357 | 1.1 | 10 |
| HIJASS J1102+52 | 11:02:48.05 | 52:06:40.5 | 2.0 | 949 7 | ID | UGC06113 | 11:02:47.85 | 52:06:48.8 | 951 | 0.1 | 2 |
| HIJASS J1108+53 | 11:08:08.79 | 53:36:41.6 | 2.1 | 1226 6 | ID | UGC06182 | 11:08:03.01 | 53:36:57.6 | 1238 | 0.9 | 12 |
| - | - | - | - | - | - | J110801.86+533702.7 | 11:08:01.87 | 53:37:02.7 | 1176 | 1.1 | 50 |
| - | - | - | - | - | - | J110819.94+533627.7 | 11:08:19.94 | 53:36:27.8 | 1087 | 1.7 | 139 |
| HIJASS J1109+50 | 11:09:32.53 | 50:56:24.0 | 1.6 | 906 7 | ID | UGC06202 | 11:09:36.50 | 50:55:36.3 | 920 | 1.0 | 14 |
| HIJASS J1110+46 | 11:10:00.51 | 46:05:03.1 | 1.9 | 1409 6 | ID | UGC06205 | 11:09:58.36 | 46:05:41.6 | 1414 | 0.7 | 5 |
| HIJASS J1113+53 | 11:13:22.74 | 53:35:25.9 | 0.5 | 927 2 | ID | UGC06251 | 11:13:26.14 | 53:35:42.3 | 927 | 0.6 | 0 |
| - | - | - | - | - | - | J111343.60+533848.3 | 11:13:43.61 | 53:38:48.3 | 914 | 4.6 | 13 |
| HIJASS J1120+53 | 11:20:59.85 | 53:09:48.4 | 0.3 | 1156 2 | ID | NGC3631 | 11:21:02.88 | 53:10:10.5 | 1156 | 0.6 | 0 |
| - | - | - | - | - | - | J112059.33+531125.7 | 11:20:59.33 | 53:11:25.8 | 1192 | 1.6 | 36 |
| - | - | - | - | - | - | J112110.21+530951.5 | 11:21:10.21 | 53:09:51.5 | 1073 | 1.6 | 83 |
| HIJASS J1123+50 | 11:23:14.03 | 50:53:42.2 | 2.7 | 793 7 | ID | UGC06399 | 11:23:23.22 | 50:53:33.8 | 791 | 1.5 | 2 |
| HIJASS J1123+52 | 11:23:53.92 | 52:54:51.2 | 0.6 | 1213 3 | ID | NGC3657 | 11:23:55.58 | 52:55:15.6 | 1215 | 0.5 | 2 |
| HIJASS J1126+53 | 11:26:41.09 | 53:44:23.3 | 0.9 | 646 3 | ID | UGC06446 | 11:26:40.46 | 53:44:48.0 | 644 | 0.4 | 2 |
| HIJASS J1132+53 | 11:32:35.89 | 53:03:19.0 | 0.5 | 994 3 | ID | NGC3718 | 11:32:34.85 | 53:04:04.5 | 993 | 0.8 | 1 |
| - | - | - | - | - | - | NGC3729 | 11:33:49.32 | 53:07:32.0 | 1060 | 11.8 | 66 |
| HIJASS J1132+39 | 11:32:44.58 | 39:04:53.5 | 1.7 | 1557 7 | ID | UGC06531 | 11:32:49.21 | 39:05:05.6 | 1565 | 0.9 | 8 |
| HIJASS J1133+47 | 11:33:20.68 | 47:01:22.5 | 0.6 | 863 3 | ID | NGC3726 | 11:33:21.12 | 47:01:45.2 | 866 | 0.4 | 3 |
| - | - | - | - | - | - | J113318.79+470338.5 | 11:33:18.79 | 47:03:38.5 | 779 | 2.3 | 84 |
| - | - | - | - | - | - | J113314.01+470226.0 | 11:33:14.01 | 47:02:26.0 | 869 | 1.6 | 6 |
| HIJASS J1136+45 | 11:36:04.30 | 45:16:54.2 | 0.2 | 230 2 | ID | NGC3741 | 11:36:06.18 | 45:17:01.1 | 229 | 0.4 | 1 |
| HIJASS J1136+36 | 11:36:32.91 | 36:24:37.2 | 1.4 | 1569 5 | ID | NGC3755 | 11:36:33.37 | 36:24:37.3 | 1570 | 0.1 | 1 |
| - | - | - | - | - | - | J113654.64+362316.3 | 11:36:54.64 | 36:23:16.4 | 1591 | 4.6 | 22 |
| HIJASS J1137+47 | 11:37:42.72 | 47:53:14.5 | 0.6 | 733 4 | ID | NGC3769 | 11:37:44.11 | 47:53:35.1 | 737 | 0.4 | 4 |
| - | - | - | - | - | - | NGC3769A | 11:37:51.36 | 47:52:52.8 | 734 | 1.5 | 1 |
| HIJASS J1138+35 | 11:38:00.28 | 35:12:55.5 | 1.8 | 1625 8 | ID | UGC06603 | 11:38:02.13 | 35:12:13.0 | 1635 | 0.8 | 10 |
| HIJASS J1138+33 | 11:38:44.75 | 33:48:43.6 | 2.2 | 1847 6 | ID | UGC06610 | 11:38:44.16 | 33:48:20.8 | 1851 | 0.4 | 4 |
| - | - | - | - | - | - | iJ1138440+334817c | 11:38:44.01 | 33:48:17.2 | 1880 | 0.5 | 33 |
| HIJASS J1138+43 | 11:38:53.56 | 43:12:23.3 | 1.7 | 1205 8 | ID | UGC06611 | 11:38:51.55 | 43:09:51.8 | 1192 | 2.6 | 13 |
| - | - | - | - | - | - | iJ1138515+430955c | 11:38:51.51 | 43:09:56.4 | 1141 | 2.5 | 64 |
| HIJASS J1139+46 | 11:39:21.86 | 46:30:34.1 | 0.5 | 733 3 | ID | NGC3782 | 11:39:20.76 | 46:30:49.8 | 739 | 0.3 | 6 |
| - | - | - | - | - | - | J11390927+4641152c | 11:39:09.23 | 46:41:14.6 | 836 | 10.9 | 103 |
| - | - | - | - | - | - | J113948.69+463711.4 | 11:39:48.70 | 46:37:11.4 | 702 | 8.1 | 31 |
| - | - | - | - | - | - | J113948.83+463711.6 | 11:39:48.83 | 46:37:11.6 | 612 | 8.1 | 121 |
| HIJASS J1140+45 | 11:40:05.75 | 45:56:20.4 | 0.5 | 848 2 | ID | UGC06628 | 11:40:05.75 | 45:56:31.8 | 841 | 0.2 | 7 |
| - | - | - | - | - | - | J114035.57+460727.5 | 11:40:35.58 | 46:07:27.6 | 843 | 12.3 | 5 |
| HIJASS J1141+46 | 11:41:11.61 | 46:24:10.9 | 1.6 | 743 5 | ID | CGCG242-075 | 11:41:21.97 | 46:23:35.5 | 743 | 1.9 | 0 |
| HIJASS J1141+36 | 11:41:20.37 | 36:32:41.5 | 1.6 | 1467 7 | ID | NGC3813 | 11:41:18.66 | 36:32:48.5 | 1465 | 0.4 | 2 |
| HIJASS J1141+32 | 11:41:26.23 | 32:18:29.4 | 2.0 | 1820 8 | ID | MRK0746 | 11:41:29.86 | 32:20:59.5 | 1801 | 2.6 | 19 |
| - | - | - | - | - | - | KUG1138+327 | 11:41:07.49 | 32:25:37.2 | 1796 | 8.2 | 24 |
| - | - | - | - | - | - | WAS28 | 11:41:36.71 | 32:16:51.6 | 1769 | 2.8 | 51 |
| HIJASS J1142+51 | 11:42:22.40 | 51:33:35.0 | 2.3 | 986 10 | ID | UGC06667 | 11:42:26.29 | 51:35:52.7 | 973 | 2.4 | 13 |
| - | - | - | - | - | - | J114226.26+513552.6 | 11:42:26.26 | 51:35:52.6 | 1034 | 2.4 | 48 |
| HIJASS J1143+31 | 11:43:18.56 | 31:27:21.6 | 1.6 | 1793 5 | ID | UGC06684 | 11:43:20.70 | 31:27:20.9 | 1788 | 0.5 | 5 |
| - | - | - | - | - | - | UGC06684NOTES01 | 11:43:32.72 | 31:27:28.5 | 1813 | 3.0 | 20 |
| HIJASS J1144+48 | 11:44:23.71 | 48:49:40.4 | 1.9 | 899 5 | ID | UGC06713 | 11:44:24.97 | 48:50:06.8 | 899 | 0.5 | 0 |
| HIJASS J1145+50 | 11:45:06.26 | 50:18:02.4 | 3.4 | 1630 15 | ID | J114506.26+501802.4 | 11:45:06.26 | 50:18:02.4 | 1664 | 0.0 | 34 |
| HIJASS J1146+50 | 11:46:00.04 | 50:11:16.2 | 2.5 | 774 11 | ID | NGC3870 | 11:45:56.60 | 50:11:59.1 | 756 | 0.9 | 18 |
| HIJASS J1146+47 | 11:46:05.94 | 47:29:27.6 | 1.3 | 896 5 | ID | NGC3877 | 11:46:07.70 | 47:29:39.7 | 895 | 0.4 | 1 |
| - | - | - | - | - | - | J114605.86+472934.1 | 11:46:05.86 | 47:29:34.1 | 839 | 0.1 | 57 |
| HIJASS J1147+49 | 11:47:36.60 | 49:44:37.3 | 2.2 | 928 7 | ID | UGC06773 | 11:48:00.48 | 49:48:29.7 | 924 | 5.5 | 4 |
| HIJASS J1148+48 | 11:48:42.08 | 48:41:45.4 | 0.4 | 966 3 | ID | NGC3893 | 11:48:38.19 | 48:42:39.0 | 967 | 1.1 | 1 |
| - | - | - | - | - | - | NGC3896 | 11:48:56.39 | 48:40:28.8 | 905 | 2.7 | 61 |
| HIJASS J1149+39 | 11:49:25.09 | 39:45:48.1 | 2.2 | 849 7 | ID | UGC06792 | 11:49:23.28 | 39:46:16.6 | 841 | 0.6 | 8 |
| HIJASS J1149+48 | 11:49:39.66 | 48:25:11.1 | 1.1 | 962 4 | ID | NGC3906 | 11:49:40.50 | 48:25:33.5 | 961 | 0.4 | 1 |
| HIJASS J1149+51 | 11:49:56.16 | 51:51:01.3 | 3.0 | 1259 11 | ID | UGC06802 | 11:50:06.50 | 51:51:21.2 | 1256 | 1.6 | 3 |
| - | - | - | - | - | - | SBS1147+520 | 11:49:54.45 | 51:44:11.0 | 1257 | 6.8 | 2 |
| HIJASS J1150+45 | 11:50:43.51 | 45:47:54.9 | 2.0 | 811 8 | ID | UGC06818 | 11:50:46.95 | 45:48:25.9 | 808 | 0.8 | 3 |
| HIJASS J1150+51 | 11:50:43.95 | 51:48:45.4 | 1.1 | 960 3 | ID | NGC3917 | 11:50:45.43 | 51:49:28.8 | 965 | 0.8 | 5 |
| - | - | - | - | - | - | NGC3917A | 11:51:13.45 | 52:00:03.1 | 837 | 12.2 | 123 |
| - | - | - | - | - | - | J115113.45+520003.1 | 11:51:13.45 | 52:00:03.1 | 908 | 12.2 | 52 |
| HIJASS J1150+38 | 11:50:51.08 | 38:52:25.5 | 0.2 | 242 2 | ID | UGC06817 | 11:50:52.99 | 38:52:49.0 | 242 | 0.5 | 0 |
| HIJASS J1151+38 | 11:51:44.54 | 38:01:06.2 | 0.7 | 915 3 | ID | NGC3930 | 11:51:46.01 | 38:00:54.4 | 919 | 0.4 | 4 |
| HIJASS J1151+48 | 11:51:48.05 | 48:40:27.2 | 1.5 | 983 7 | ID | NGC3928 | 11:51:47.62 | 48:40:59.3 | 988 | 0.5 | 5 |
| - | - | - | - | - | - | J115056.11+483153.8 | 11:50:56.11 | 48:31:53.8 | 968 | 12.1 | 15 |
| HIJASS J1152+52 | 11:52:05.80 | 52:06:00.5 | 1.2 | 1015 4 | ID | UGC06840 | 11:52:07.01 | 52:06:28.8 | 1046 | 0.5 | 31 |
| - | - | - | - | - | - | NGC3917A | 11:51:13.45 | 52:00:03.1 | 837 | 10.0 | 178 |
| - | - | - | - | - | - | J115113.45+520003.1 | 11:51:13.45 | 52:00:03.1 | 908 | 10.0 | 107 |
| HIJASS J1152+44 | 11:52:47.46 | 44:06:56.1 | 0.4 | 808 2 | ID | NGC3938 | 11:52:49.45 | 44:07:14.6 | 809 | 0.5 | 1 |
| - | - | - | - | - | - | J115244.42+440602.0 | 11:52:44.42 | 44:06:02.0 | 842 | 1.1 | 34 |
| HIJASS J1152+50 | 11:52:48.60 | 50:00:18.7 | 1.7 | 994 6 | ID | UGC06849 | 11:52:39.16 | 50:02:16.0 | 995 | 2.5 | 1 |
| HIJASS J1152+37 | 11:52:53.66 | 37:00:19.9 | 1.5 | 934 6 | ID | NGC3941 | 11:52:55.36 | 36:59:10.8 | 928 | 1.2 | 6 |
| HIJASS J1153+47 | 11:53:37.84 | 47:51:14.4 | 1.8 | 790 8 | ID | NGC3949 | 11:53:41.72 | 47:51:31.4 | 800 | 0.7 | 10 |
| - | - | - | - | - | - | J115340.69+475156.4 | 11:53:40.70 | 47:51:56.5 | 855 | 0.8 | 65 |
| HIJASS J1153+52 | 11:53:44.96 | 52:18:35.9 | 0.9 | 1048 4 | ID | NGC3953 | 11:53:48.92 | 52:19:36.4 | 1052 | 1.2 | 4 |
| HIJASS J1154+30 | 11:54:12.17 | 30:07:20.9 | 1.9 | 974 9 | IDe | J115404.42+300634.6 | 11:54:04.42 | 30:06:34.6 | 981 | 1.8 | 7 |
| HIJASS J1156+50 | 11:56:24.96 | 50:25:04.9 | 0.6 | 915 3 | ID | UGC06917 | 11:56:26.52 | 50:25:43.2 | 911 | 0.7 | 4 |
| HIJASS J1156+48 | 11:56:36.58 | 48:19:30.9 | 0.9 | 945 7 | ID | NGC3985 | 11:56:42.11 | 48:20:02.2 | 948 | 1.1 | 3 |
| HIJASS J1157+50 | 11:57:02.98 | 50:48:51.5 | 1.1 | 894 4 | ID | UGC06922 | 11:56:52.15 | 50:49:01.2 | 877 | 1.7 | 17 |
| HIJASS J1157+49 | 11:57:16.03 | 49:16:24.7 | 0.7 | 776 3 | ID | UGC06930 | 11:57:17.35 | 49:16:59.1 | 777 | 0.6 | 1 |
| HIJASS J1157+53 | 11:57:32.85 | 53:20:51.6 | 1.0 | 1050 4 | ID | MESSIER109 | 11:57:35.98 | 53:22:28.3 | 1048 | 1.7 | 2 |
| - | - | - | - | - | - | UGC06923 | 11:56:49.43 | 53:09:37.3 | 1066 | 13.0 | 16 |
| - | - | - | - | - | - | UGC06940 | 11:57:47.58 | 53:14:04.1 | 1118 | 7.1 | 68 |
| - | - | - | - | - | - | J115834.34+532043.8 | 11:58:34.34 | 53:20:43.8 | 1150 | 9.2 | 100 |
| - | - | - | - | - | - | UGC06969 | 11:58:47.64 | 53:25:29.1 | 1114 | 12.1 | 64 |
| - | - | - | - | - | - | J115649.85+530937.5 | 11:56:49.85 | 53:09:37.5 | 980 | 12.9 | 70 |
| HIJASS J1158+38 | 11:58:28.03 | 38:04:18.5 | 1.0 | 901 4 | ID | UGC06955 | 11:58:29.81 | 38:04:34.8 | 905 | 0.4 | 4 |
| HIJASS J1158+50 | 11:58:31.43 | 50:51:54.2 | 0.7 | 941 5 | ID | UGC06956 | 11:58:25.60 | 50:55:01.2 | 917 | 3.2 | 24 |
| - | - | - | - | - | - | NGC4026 | 11:59:25.19 | 50:57:42.1 | 930 | 10.3 | 11 |
| - | - | - | - | - | - | J115825.60+505501.2 | 11:58:25.60 | 50:55:01.2 | 839 | 3.2 | 102 |
| HIJASS J1158+43 | 11:58:33.83 | 43:56:27.3 | 1.2 | 829 5 | ID | NGC4013 | 11:58:31.38 | 43:56:47.7 | 831 | 0.6 | 2 |
| HIJASS J1158+47 | 11:58:37.08 | 47:14:47.4 | 1.4 | 904 5 | ID | NGC4010 | 11:58:37.89 | 47:15:41.4 | 902 | 0.9 | 2 |
| HIJASS J1158+42 | 11:58:44.97 | 42:43:06.7 | 1.6 | 713 6 | ID | IC0750 | 11:58:52.20 | 42:43:20.9 | 701 | 1.3 | 12 |
| - | - | - | - | - | - | IC0749 | 11:58:34.05 | 42:44:02.5 | 807 | 2.2 | 94 |
| - | - | - | - | - | - | J115851.31+424307.4 | 11:58:51.32 | 42:43:07.5 | 586 | 1.2 | 127 |
| HIJASS J1158+45 | 11:58:49.89 | 45:42:37.1 | 0.7 | 1148 3 | ID | UGCA259 | 11:58:53.27 | 45:44:04.1 | 1154 | 1.6 | 6 |
| HIJASS J1158+30 | 11:58:52.25 | 30:25:15.5 | 2.3 | 769 8 | ID | NGC4020 | 11:58:56.67 | 30:24:42.8 | 760 | 1.1 | 9 |
| HIJASS J1159+52 | 11:59:03.93 | 52:41:45.7 | 1.2 | 1084 4 | ID | UGC06983 | 11:59:09.28 | 52:42:27.0 | 1082 | 1.1 | 2 |
| - | - | - | - | - | - | J115918.05+524234.2 | 11:59:18.05 | 52:42:34.3 | 1002 | 2.3 | 82 |
| HIJASS J1201+33 | 12:01:33.65 | 33:21:11.4 | 1.9 | 783 8 | ID | UGC07007 | 12:01:33.16 | 33:20:28.8 | 774 | 0.7 | 9 |
| HIJASS J1203+44 | 12:03:08.09 | 44:30:52.5 | 1.7 | 704 8 | ID | NGC4051 | 12:03:09.61 | 44:31:52.8 | 700 | 1.0 | 4 |
| - | - | - | - | - | - | J120303.25+443225.4 | 12:03:03.25 | 44:32:25.4 | 770 | 1.8 | 66 |
| HIJASS J1204+52 | 12:04:00.36 | 52:34:51.9 | 0.2 | 205 2 | ID | NGC4068 | 12:04:00.78 | 52:35:17.8 | 210 | 0.4 | 5 |
| HIJASS J1204+31 | 12:04:03.75 | 31:54:05.6 | 2.5 | 759 10 | ID | NGC4062 | 12:04:03.83 | 31:53:44.9 | 758 | 0.3 | 1 |
| HIJASS J1205+50 | 12:05:31.72 | 50:30:56.1 | 0.6 | 753 3 | ID | NGC4088 | 12:05:34.19 | 50:32:20.5 | 757 | 1.5 | 4 |
| - | - | - | - | - | - | NGC4085 | 12:05:22.71 | 50:21:10.6 | 746 | 9.9 | 7 |
| - | - | - | - | - | - | J120543.59+503318.9 | 12:05:43.59 | 50:33:18.9 | 597 | 3.0 | 156 |
| - | - | - | - | - | - | J120537.79+503304.6 | 12:05:37.79 | 50:33:04.6 | 645 | 2.3 | 108 |
| - | - | - | - | - | - | J120531.00+503143.9 | 12:05:31.00 | 50:31:43.9 | 914 | 0.8 | 161 |
| HIJASS J1205+47 | 12:05:59.08 | 47:27:42.4 | 0.8 | 567 6 | ID | NGC4096 | 12:06:01.13 | 47:28:42.4 | 566 | 1.1 | 1 |
| - | - | - | - | - | - | J120556.52+472625.9 | 12:05:56.52 | 47:26:25.9 | 381 | 1.3 | 186 |
| HIJASS J1206+49 | 12:06:07.98 | 49:34:30.6 | 1.1 | 1084 9 | ID | NGC4100 | 12:06:08.45 | 49:34:57.6 | 1074 | 0.5 | 10 |
| - | - | - | - | - | - | J120608.59+493459.9 | 12:06:08.59 | 49:35:00.0 | 1097 | 0.5 | 13 |
| HIJASS J1206+43 | 12:06:25.27 | 43:03:15.8 | 2.1 | 805 12 | ID | NGC4111 | 12:07:03.13 | 43:03:56.6 | 807 | 6.9 | 2 |
| - | - | - | - | - | - | UGC07089 | 12:05:57.74 | 43:08:36.0 | 770 | 7.3 | 35 |
| - | - | - | - | - | - | J120559.63+425409.1 | 12:05:59.00 | 42:54:10.9 | 767 | 10.3 | 38 |
| - | - | - | - | - | - | UGC07094 | 12:06:10.75 | 42:57:20.9 | 779 | 6.5 | 26 |
| - | - | - | - | - | - | NGC4117 | 12:07:46.11 | 43:07:34.9 | 934 | 15.4 | 129 |
| - | - | - | - | - | - | NGC4118 | 12:07:52.87 | 43:06:39.8 | 643 | 16.4 | 162 |
| HIJASS J1207+39 | 12:07:41.34 | 39:52:05.1 | 3.3 | 865 8 | ID | UGCA271 | 12:07:23.60 | 39:48:46.0 | 877 | 4.8 | 12 |
| HIJASS J1208+36 | 12:08:39.23 | 36:48:23.3 | 0.7 | 1070 3 | ID | UGC07125 | 12:08:42.33 | 36:48:09.9 | 1071 | 0.7 | 1 |
| HIJASS J1209+30 | 12:09:11.34 | 30:55:26.7 | 2.4 | 252 9 | ID | UGC07131 | 12:09:11.78 | 30:54:24.4 | 253 | 1.0 | 1 |
| HIJASS J1209+29 | 12:09:15.94 | 29:55:31.7 | 0.5 | 606 3 | ID | NGC4136 | 12:09:17.69 | 29:55:39.4 | 609 | 0.4 | 3 |
| HIJASS J1209+53 | 12:09:25.73 | 53:05:55.8 | 1.6 | 1163 5 | ID | NGC4142 | 12:09:30.19 | 53:06:17.8 | 1157 | 0.8 | 6 |
| HIJASS J1209+43A | 12:09:29.34 | 43:40:02.5 | 1.5 | 893 9 | ID | NGC4138 | 12:09:29.78 | 43:41:07.1 | 888 | 1.1 | 5 |
| HIJASS J1209+43B | 12:09:39.71 | 43:12:58.1 | 2.0 | 1057 6 | ID | UGC07146 | 12:09:49.15 | 43:14:04.9 | 1065 | 2.0 | 8 |
| HIJASS J1210+46 | 12:10:00.78 | 46:27:22.5 | 0.8 | 258 3 | ID | NGC4144 | 12:09:58.60 | 46:27:25.8 | 265 | 0.4 | 7 |
| HIJASS J1210+39A | 12:10:03.97 | 39:52:17.4 | 0.4 | 1012 2 | ID | NGC4145 | 12:10:01.52 | 39:53:01.9 | 1009 | 0.9 | 3 |
| - | - | - | - | - | - | NGC4145A | 12:10:54.54 | 39:45:26.5 | 1168 | 11.9 | 156 |
| HIJASS J1210+39B | 12:10:32.06 | 39:23:52.3 | 0.3 | 997 2 | ID | NGC4151 | 12:10:32.58 | 39:24:20.6 | 995 | 0.5 | 2 |
| - | - | - | - | - | - | J121021.06+391252.1 | 12:10:21.07 | 39:12:52.2 | 919 | 11.2 | 78 |
| HIJASS J1211+50 | 12:11:02.67 | 50:28:17.1 | 0.7 | 776 3 | ID | NGC4157 | 12:11:04.37 | 50:29:04.8 | 774 | 0.8 | 2 |
| - | - | - | - | - | - | UGC07176 | 12:10:55.76 | 50:17:18.1 | 888 | 11.0 | 112 |
| - | - | - | - | - | - | MCG+08-22-082 | 12:11:22.57 | 50:16:10.3 | 899 | 12.5 | 123 |
| HIJASS J1212+36 | 12:12:07.87 | 36:10:17.5 | 0.5 | 164 2 | ID | NGC4163 | 12:12:09.16 | 36:10:09.1 | 165 | 0.3 | 1 |
| HIJASS J1212+29 | 12:12:20.62 | 29:12:07.5 | 0.9 | 1119 4 | ID | NGC4173 | 12:12:21.46 | 29:12:25.4 | 1127 | 0.3 | 8 |
| HIJASS J1212+37 | 12:12:21.44 | 37:00:16.3 | 1.8 | 1055 7 | ID | UGC07207 | 12:12:18.76 | 37:00:53.3 | 1051 | 0.8 | 4 |
| HIJASS J1213+52 | 12:13:02.25 | 52:17:04.4 | 2.3 | 778 7 | ID | UGC07218 | 12:12:56.52 | 52:15:55.3 | 770 | 1.4 | 8 |
| HIJASS J1213+43 | 12:13:13.93 | 43:41:41.7 | 0.9 | 929 3 | ID | NGC4183 | 12:13:16.88 | 43:41:54.9 | 930 | 0.6 | 1 |
| HIJASS J1213+24 | 12:13:45.66 | 24:15:20.9 | 1.3 | 948 4 | ID | UGC07236 | 12:13:49.15 | 24:15:53.2 | 945 | 1.0 | 3 |
| HIJASS J1213+36 | 12:13:47.85 | 36:37:22.4 | 0.3 | 229 3 | ID | NGC4190 | 12:13:44.77 | 36:38:02.5 | 228 | 0.9 | 1 |
| HIJASS J1215+35 | 12:15:01.40 | 35:56:56.6 | 1.5 | 939 7 | ID | UGC07257 | 12:15:02.96 | 35:57:30.6 | 942 | 0.6 | 3 |
| - | - | - | - | - | - | MCG+06-27-038 | 12:15:01.79 | 35:57:53.8 | 964 | 1.0 | 25 |
| HIJASS J1215+33 | 12:15:03.01 | 33:11:08.5 | 2.1 | 1089 11 | ID | NGC4203 | 12:15:05.05 | 33:11:50.4 | 1086 | 0.8 | 3 |
| - | - | - | - | - | - | J12153897+3309350c | 12:15:38.99 | 33:09:35.1 | 1067 | 7.7 | 22 |
| HIJASS J1215+51 | 12:15:19.81 | 51:21:11.8 | 1.2 | 462 5 | ID | UGC07267 | 12:15:23.65 | 51:20:59.6 | 472 | 0.6 | 10 |
| HIJASS J1215+43 | 12:15:33.62 | 43:24:40.0 | 1.2 | 555 5 | ID | UGC07271 | 12:15:33.44 | 43:26:02.8 | 547 | 1.4 | 8 |
| HIJASS J1215+36 | 12:15:36.48 | 36:19:35.4 | 0.1 | 291 2 | ID | NGC4214 | 12:15:39.17 | 36:19:36.8 | 291 | 0.5 | 0 |
| - | - | - | - | - | - | UGCA276 | 12:14:57.92 | 36:13:07.8 | 284 | 10.1 | 7 |
| - | - | - | - | - | - | HS1213+3636B | 12:15:34.77 | 36:19:50.9 | 229 | 0.4 | 62 |
| HIJASS J1215+48 | 12:15:51.02 | 48:07:39.1 | 2.4 | 727 8 | ID | NGC4218 | 12:15:46.41 | 48:07:51.0 | 730 | 0.8 | 3 |
| - | - | - | - | - | - | J121546.41+480751.0 | 12:15:46.41 | 48:07:51.0 | 803 | 0.8 | 76 |
| HIJASS J1215+47 | 12:15:51.46 | 47:05:46.8 | 1.4 | 1031 6 | ID | NGC4217 | 12:15:50.90 | 47:05:30.4 | 1027 | 0.3 | 4 |
| HIJASS J1216+52 | 12:16:05.74 | 52:18:40.4 | 0.7 | 168 3 | ID | UGC07298 | 12:16:30.10 | 52:13:39.0 | 173 | 6.3 | 5 |
| - | - | - | - | - | - | CGCG269-049 | 12:15:46.62 | 52:23:13.9 | 159 | 5.4 | 9 |
| HIJASS J1216+46 | 12:16:42.36 | 46:03:53.2 | 2.0 | 707 5 | ID | UGC07301 | 12:16:42.08 | 46:04:43.6 | 690 | 0.8 | 17 |
| HIJASS J1216+28 | 12:16:44.02 | 28:43:43.4 | 1.1 | 1210 4 | ID | UGC07300 | 12:16:43.31 | 28:43:52.1 | 1210 | 0.2 | 0 |
| - | - | - | - | - | - | [YWP2010]J184.176+28.730 | 12:16:42.24 | 28:43:48.0 | 1218 | 0.4 | 8 |
| HIJASS J1217+45 | 12:17:26.80 | 45:36:29.5 | 0.7 | 511 3 | ID | NGC4242 | 12:17:30.18 | 45:37:09.5 | 506 | 0.9 | 5 |
| HIJASS J1217+37 | 12:17:28.41 | 37:48:08.9 | 0.2 | 243 2 | ID | NGC4244 | 12:17:29.66 | 37:48:25.6 | 244 | 0.4 | 1 |
| - | - | - | - | - | - | HS1214+3801 | 12:17:09.68 | 37:44:53.6 | 330 | 4.9 | 87 |
| HIJASS J1217+22 | 12:17:34.22 | 22:32:42.3 | 1.5 | 400 6 | ID | UGC07321 | 12:17:34.01 | 22:32:24.5 | 408 | 0.3 | 8 |
| HIJASS J1218+46 | 12:18:11.04 | 46:55:01.2 | 1.8 | 333 5 | ID | J121811.04+465501.2 | 12:18:11.07 | 46:55:00.7 | 472 | 0.0 | 139 |
| HIJASS J1218+47 | 12:18:53.68 | 47:17:19.6 | 0.3 | 446 2 | ID | MESSIER106 | 12:18:57.50 | 47:18:14.3 | 448 | 1.1 | 2 |
| - | - | - | - | - | - | NGC4248 | 12:17:49.85 | 47:24:33.1 | 484 | 13.0 | 38 |
| - | - | - | - | - | - | UGC07356 | 12:19:09.39 | 47:05:27.5 | 272 | 12.2 | 174 |
| - | - | - | - | - | - | J121855.34+471647.9 | 12:18:55.34 | 47:16:47.9 | 429 | 0.6 | 17 |
| - | - | - | - | - | - | J121901.36+471525.0 | 12:19:01.36 | 47:15:25.0 | 330 | 2.3 | 116 |
| HIJASS J1219+46 | 12:19:52.78 | 46:35:27.3 | 1.2 | 392 3 | PUO | - | - | - | - | - | - |
| HIJASS J1220+45 | 12:20:16.24 | 45:54:30.2 | 2.5 | 728 9 | ID | UGC07391 | 12:20:16.24 | 45:54:30.2 | 612 | 0.0 | 116 |
| HIJASS J1220+29 | 12:20:19.27 | 29:15:18.5 | 2.6 | 611 11 | ID | NGC4278 | 12:20:06.82 | 29:16:50.7 | 649 | 3.1 | 38 |
| - | - | - | - | - | - | J122017.40+290609.1 | 12:20:17.40 | 29:06:09.1 | 710 | 9.2 | 99 |
| - | - | - | - | - | - | NGC4286 | 12:20:42.09 | 29:20:45.2 | 644 | 7.4 | 33 |
| HIJASS J1220+47 | 12:20:34.85 | 47:49:04.8 | 2.4 | 729 9 | ID | UGC07401 | 12:20:48.42 | 47:49:33.4 | 762 | 2.3 | 33 |
| HIJASS J1220+46 | 12:20:36.67 | 46:17:14.0 | 0.5 | 518 5 | ID | NGC4288 | 12:20:38.11 | 46:17:30.0 | 520 | 0.4 | 2 |
| HIJASS J1220+38 | 12:20:56.87 | 38:25:06.9 | 1.2 | 574 4 | ID | KUG1218+387 | 12:20:54.88 | 38:25:48.7 | 606 | 0.8 | 32 |
| HIJASS J1221+45 | 12:21:14.29 | 45:48:02.6 | 0.3 | 460 2 | ID | UGC07408 | 12:21:15.01 | 45:48:40.8 | 462 | 0.6 | 2 |
| - | - | - | - | - | - | UGC07391 | 12:20:16.24 | 45:54:30.2 | 612 | 12.0 | 152 |
| HIJASS J1221+35 | 12:21:53.81 | 35:04:20.3 | 1.7 | 730 5 | ID | UGC07427 | 12:21:54.86 | 35:03:00.3 | 724 | 1.4 | 6 |
| HIJASS J1222+32 | 12:22:04.36 | 32:05:16.3 | 1.8 | 1144 7 | ID | UGC07428 | 12:22:02.61 | 32:05:45.4 | 1137 | 0.6 | 7 |
| HIJASS J1222+39 | 12:22:07.09 | 39:45:43.4 | 2.0 | 1073 5 | ID | J122206.12+394452.4 | 12:22:06.12 | 39:44:52.4 | 1102 | 0.9 | 29 |
| HIJASS J1224+31 | 12:24:11.84 | 31:30:47.1 | 3.4 | 1252 8 | ID | NGC4359 | 12:24:11.17 | 31:31:19.0 | 1253 | 0.6 | 1 |
| HIJASS J1224+39 | 12:24:33.18 | 39:21:47.2 | 2.7 | 1032 13 | ID | NGC4369 | 12:24:36.20 | 39:22:58.8 | 1045 | 1.3 | 13 |
| HIJASS J1225+26 | 12:25:22.45 | 26:43:48.7 | 2.8 | 318 12 | ID | IC3308 | 12:25:18.21 | 26:42:54.4 | 316 | 1.3 | 2 |
| - | - | - | - | - | - | J122520.71+264210.2 | 12:25:20.71 | 26:42:10.2 | 342 | 1.7 | 24 |
| HIJASS J1225+28 | 12:25:28.61 | 28:29:13.6 | 1.8 | 475 8 | ID | O3210767130d | 12:25:29.15 | 28:28:56.8 | 483 | 0.3 | 8 |
| HIJASS J1225+45 | 12:25:30.67 | 45:39:36.8 | 2.3 | 714 7 | ID | NGC4389 | 12:25:35.10 | 45:41:04.8 | 718 | 1.7 | 4 |
| HIJASS J1225+27 | 12:25:50.47 | 27:33:53.0 | 0.7 | 751 3 | ID | NGC4393 | 12:25:51.23 | 27:33:41.6 | 755 | 0.3 | 4 |
| HIJASS J1225+33 | 12:25:51.37 | 33:33:00.6 | 0.2 | 317 2 | ID | NGC4395 | 12:25:48.86 | 33:32:48.9 | 319 | 0.6 | 2 |
| HIJASS J1226+31 | 12:26:23.23 | 31:13:20.1 | 1.1 | 711 7 | ID | NGC4414 | 12:26:27.10 | 31:13:24.7 | 716 | 0.8 | 5 |
| HIJASS J1226+27 | 12:26:23.34 | 27:44:43.9 | 3.3 | 373 10 | IDf | IC3341 | 12:26:23.19 | 27:44:43.9 | 372 | 0.0 | 1 |
| HIJASS J1227+37 | 12:27:07.60 | 37:08:13.0 | 0.3 | 215 2 | ID | UGC07559 | 12:27:05.15 | 37:08:33.4 | 218 | 0.6 | 3 |
| HIJASS J1227+43 | 12:27:37.06 | 43:29:48.1 | 0.3 | 195 2 | ID | UGC07577 | 12:27:40.90 | 43:29:44.0 | 195 | 0.7 | 0 |
| HIJASS J1228+22A | 12:28:02.83 | 22:35:15.8 | 1.7 | 592 4 | ID | UGC07584 | 12:28:02.83 | 22:35:15.8 | 603 | 0.0 | 11 |
| HIJASS J1228+44 | 12:28:06.33 | 44:05:56.9 | 0.1 | 205 3 | ID | NGC4449 | 12:28:11.10 | 44:05:37.1 | 207 | 0.9 | 2 |
| HIJASS J1228+37 | 12:28:21.72 | 37:13:53.7 | 0.5 | 260 4 | ID | UGC07599 | 12:28:28.56 | 37:14:01.1 | 278 | 1.4 | 18 |
| HIJASS J1228+35 | 12:28:36.15 | 35:43:36.4 | 1.2 | 311 5 | ID | UGC07605 | 12:28:38.74 | 35:43:02.9 | 310 | 0.8 | 1 |
| HIJASS J1228+43 | 12:28:41.00 | 43:13:13.9 | 0.3 | 536 2 | ID | UGC07608 | 12:28:44.20 | 43:13:26.9 | 538 | 0.6 | 2 |
| HIJASS J1228+22B | 12:28:41.92 | 22:49:00.3 | 0.6 | 642 2 | ID | NGC4455 | 12:28:44.11 | 22:49:13.6 | 637 | 0.6 | 5 |
| HIJASS J1228+42 | 12:28:52.22 | 42:10:40.5 | 2.0 | 417 9 | ID | MCG+07-26-011 | 12:28:52.23 | 42:10:40.5 | 408 | 0.0 | 9 |
| HIJASS J1230+42 | 12:30:23.57 | 42:54:05.7 | 1.5 | 381 7 | ID | MCG+07-26-012 | 12:30:23.57 | 42:54:05.7 | 436 | 0.0 | 55 |
| - | - | - | - | - | - | J123023.60+425405.7 | 12:30:23.60 | 42:54:05.7 | 522 | 0.0 | 141 |
| HIJASS J1230+41 | 12:30:32.63 | 41:38:33.7 | 0.2 | 570 4 | ID | NGC4490 | 12:30:36.24 | 41:38:38.0 | 565 | 0.7 | 5 |
| - | - | - | - | - | - | NGC4485 | 12:30:31.13 | 41:42:04.2 | 493 | 3.5 | 77 |
| HIJASS J1231+29 | 12:31:56.48 | 29:42:25.7 | 1.6 | 644 4 | ID | UGC07673 | 12:31:58.57 | 29:42:34.6 | 642 | 0.5 | 2 |
| HIJASS J1232+39 | 12:32:04.84 | 39:48:18.7 | 0.9 | 680 4 | ID | UGC07678 | 12:32:00.17 | 39:49:57.6 | 666 | 1.9 | 14 |
| HIJASS J1232+42 | 12:32:26.69 | 42:41:41.1 | 1.0 | 538 4 | ID | UGC07690 | 12:32:26.89 | 42:42:14.8 | 537 | 0.6 | 1 |
| HIJASS J1232+37 | 12:32:46.41 | 37:37:45.9 | 1.4 | 503 6 | ID | UGC07699 | 12:32:48.02 | 37:37:18.4 | 496 | 0.6 | 7 |
| HIJASS J1232+31 | 12:32:53.44 | 31:32:48.6 | 0.5 | 331 2 | ID | UGC07698 | 12:32:54.39 | 31:32:28.0 | 331 | 0.4 | 0 |
| HIJASS J1233+32 | 12:33:04.71 | 32:06:54.2 | 2.1 | 923 9 | ID | NGC4509 | 12:33:06.79 | 32:05:29.7 | 937 | 1.5 | 14 |
| - | - | - | - | - | - | J123306.44+320527.4 | 12:33:06.44 | 32:05:27.5 | 912 | 1.5 | 11 |
| HIJASS J1233+33 | 12:33:15.73 | 33:20:19.4 | 2.3 | 830 12 | ID | KUG1230+336 | 12:33:24.89 | 33:21:04.5 | 838 | 2.1 | 8 |
| HIJASS J1233+24g | 12:33:39.50 | 23:59:07.8 | 3.3 | 1316 16 | IDf | O3780206985d | 12:33:41.75 | 23:59:13.6 | 1325 | 0.5 | 9 |
| HIJASS J1233+39 | 12:33:48.83 | 39:38:43.4 | 1.2 | 658 4 | ID | MCG+07-26-024 | 12:33:52.74 | 39:37:33.4 | 646 | 1.4 | 12 |
| HIJASS J1233+30 | 12:33:55.58 | 30:17:56.4 | 2.3 | 1173 11 | ID | NGC4525 | 12:33:51.14 | 30:16:38.9 | 1172 | 1.6 | 1 |
| HIJASS J1234+39 | 12:34:03.47 | 39:00:39.9 | 1.4 | 679 4 | ID | UGC07719 | 12:34:00.54 | 39:01:09.0 | 678 | 0.7 | 1 |
| HIJASS J1234+35 | 12:34:04.03 | 35:31:37.7 | 0.4 | 802 2 | ID | NGC4534 | 12:34:05.42 | 35:31:06.0 | 802 | 0.6 | 0 |
| HIJASS J1235+41 | 12:35:13.31 | 41:03:07.7 | 2.0 | 608 6 | ID | UGC07751 | 12:35:11.77 | 41:03:39.5 | 605 | 0.6 | 3 |
| HIJASS J1235+27 | 12:35:57.46 | 27:57:32.3 | 0.2 | 813 2 | ID | NGC4559 | 12:35:57.65 | 27:57:36.0 | 807 | 0.1 | 6 |
| - | - | - | - | - | - | J123551.86+275557.0 | 12:35:51.86 | 27:55:57.0 | 855 | 2.0 | 42 |
| HIJASS J1236+25 | 12:36:16.77 | 25:59:43.3 | 0.3 | 1226 3 | ID | NGC4565 | 12:36:20.78 | 25:59:15.6 | 1230 | 1.0 | 4 |
| - | - | - | - | - | - | NGC4562 | 12:35:34.80 | 25:51:00.0 | 1353 | 12.8 | 127 |
| - | - | - | - | - | - | IC3571 | 12:36:20.10 | 26:05:03.2 | 1260 | 5.4 | 34 |
| HIJASS J1236+40 | 12:36:19.65 | 40:00:01.1 | 1.5 | 522 5 | ID | UGC07774 | 12:36:22.72 | 40:00:18.7 | 526 | 0.7 | 4 |
| HIJASS J1238+32 | 12:38:37.28 | 32:45:53.4 | 0.4 | 309 2 | ID | UGCA292 | 12:38:40.06 | 32:46:00.5 | 308 | 0.6 | 1 |
| HIJASS J1239+44 | 12:39:44.52 | 44:49:11.1 | 1.3 | 554 4 | ID | UGC07827 | 12:39:38.93 | 44:49:14.4 | 554 | 1.0 | 0 |
| HIJASS J1240+32 | 12:40:10.00 | 32:39:30.0 | 1.2 | 759 6 | ID | J124010.08+323930.4 | 12:40:10.04 | 32:39:31.6 | 776 | 0.0 | 17 |
| HIJASS J1241+41 | 12:41:38.22 | 41:11:02.9 | 0.4 | 556 3 | ID | NGC4618 | 12:41:32.85 | 41:09:02.8 | 544 | 2.2 | 12 |
| - | - | - | - | - | - | NGC4625 | 12:41:52.72 | 41:16:26.3 | 598 | 6.0 | 42 |
| HIJASS J1242+32 | 12:42:06.94 | 32:31:54.0 | 0.1 | 610 2 | ID | NGC4631 | 12:42:08.01 | 32:32:29.4 | 606 | 0.6 | 4 |
| - | - | - | - | - | - | J124146.99+325124.8 | 12:41:47.13 | 32:51:24.9 | 696 | 20.0 | 86 |
| - | - | - | - | - | - | NGC4627 | 12:41:59.68 | 32:34:24.8 | 542 | 2.9 | 68 |
| HIJASS J1242+38 | 12:42:15.55 | 38:30:38.5 | 0.7 | 354 3 | ID | IC3687 | 12:42:15.10 | 38:30:12.0 | 354 | 0.5 | 0 |
| HIJASS J1243+24 | 12:43:05.87 | 24:27:03.9 | 2.8 | 1823 6 | IDf | KUG1240+247 | 12:43:05.87 | 24:27:03.9 | 1825 | 0.0 | 2 |
| HIJASS J1243+32 | 12:43:51.42 | 32:10:18.4 | 0.1 | 642 3 | ID | NGC4656NED01 | 12:43:57.67 | 32:10:12.9 | 664 | 1.3 | 22 |
| - | - | - | - | - | - | J124348.72+320813.8 | 12:43:48.72 | 32:08:13.8 | 705 | 2.2 | 63 |
| - | - | - | - | - | - | J12440599+3212340c | 12:44:05.98 | 32:12:32.3 | 617 | 3.8 | 25 |
| HIJASS J1244+34 | 12:44:25.63 | 34:23:24.7 | 0.7 | 601 2 | ID | UGC07916 | 12:44:25.14 | 34:23:11.5 | 607 | 0.2 | 6 |
| HIJASS J1244+28 | 12:44:36.09 | 28:28:46.4 | 1.9 | 936 6 | ID | UGCA294 | 12:44:38.15 | 28:28:21.0 | 947 | 0.6 | 11 |
| HIJASS J1245+27 | 12:45:16.60 | 27:07:02.9 | 1.9 | 1077 10 | ID | NGC4670 | 12:45:17.07 | 27:07:31.5 | 1069 | 0.5 | 8 |
| - | - | - | - | - | - | J124516.87+270730.7 | 12:45:16.87 | 27:07:30.8 | 1045 | 0.5 | 32 |
| HIJASS J1246+36 | 12:46:58.34 | 36:28:33.1 | 0.7 | 332 3 | ID | UGC07949 | 12:46:59.80 | 36:28:35.0 | 331 | 0.3 | 1 |
| HIJASS J1250+25 | 12:50:23.64 | 25:30:27.1 | 0.2 | 1205 3 | ID | NGC4725 | 12:50:26.58 | 25:30:02.9 | 1206 | 0.8 | 1 |
| HIJASS J1250+41 | 12:50:54.65 | 41:06:50.3 | 0.8 | 304 4 | ID | MESSIER094 | 12:50:53.06 | 41:07:13.7 | 308 | 0.5 | 4 |
| HIJASS J1251+26 | 12:51:44.44 | 26:06:37.8 | 1.5 | 1241 7 | ID | KUG1249+263 | 12:51:44.45 | 26:06:37.8 | 1225 | 0.0 | 16 |
| HIJASS J1251+25 | 12:51:47.91 | 25:48:27.3 | 0.3 | 1201 5 | ID | NGC4747 | 12:51:45.95 | 25:46:37.5 | 1190 | 1.9 | 11 |
| HIJASS J1254+27 | 12:54:03.66 | 27:09:27.1 | 0.3 | 373 2 | ID | NGC4789A | 12:54:05.25 | 27:08:58.7 | 374 | 0.6 | 1 |
| a The most likely counterpart of a HIJASS source is given in the first row. Potentially confused HIJASS sources, with multiple galaxies within the gridded beam or | |||||||||||
| the H I intensity contours (for large sources) and within the velocity range of the H I detection, are listed in the subsequent rows. | |||||||||||
| b Unless stated differently, identifications starting with ‘J’ are SDSS galaxies and their full names are of the form: SDSS X, where X is the stated ID. | |||||||||||
| c 2MASX objects with full identifications of the form: 2MASXY, where Y is the stated ID. | |||||||||||
| d MAPS-NGP object with full identification of the form: MAPS-NGP Z, where Z is the stated ID. | |||||||||||
| e Redshift information available in SDSS DR8 (Aihara et al., 2011) – not listed in NED. | |||||||||||
| f Redshift information available in ALFALFA (Haynes et al., 2011) – not listed in NED. | |||||||||||
| g HIJASS name consistent with Lang et al. (2003). | |||||||||||
| (corr) | (corr) | rms | Distance | |||||||||
|---|---|---|---|---|---|---|---|---|---|---|---|---|
| HIJASS name | Jy | Jy | Jy | Jy km s-1 | Jy km s-1 | Jy km s-1 | km s-1 | km s-1 | Jy | Mpc | flagsa | |
| (B1) | (B2) | (B3) | (B4) | (B5) | (B6) | (B7) | (B8) | (B9) | (B10) | (B11) | (B12) | (B13) |
| HIJASS J1048+46 | 0.059 | - | 0.012 | 4.22 | - | 1.73 | 9812 | 11018 | 0.012 | 11.1 | 8.09 | |
| HIJASS J1054+49 | 0.101 | 0.091 | 0.021 | 10.35 | 11.54 | 3.83 | 12430 | 17345 | 0.020 | 20.0 | 9.04 | ec |
| HIJASS J1102+52 | 0.106 | - | 0.017 | 4.39 | - | 1.75 | 4614 | 6821 | 0.016 | 14.5 | 8.34 | |
| HIJASS J1108+53 | 0.109 | 0.098 | 0.017 | 8.75 | 9.76 | 2.72 | 9412 | 10918 | 0.016 | 18.6 | 8.90 | ec3 |
| HIJASS J1109+50 | 0.074 | - | 0.010 | 6.91 | - | 1.48 | 12514 | 15521 | 0.009 | 13.9 | 8.50 | n |
| HIJASS J1110+46 | 0.069 | - | 0.011 | 6.54 | - | 1.66 | 12012 | 13518 | 0.010 | 20.7 | 8.82 | |
| HIJASS J1113+53 | 0.269 | - | 0.017 | 10.76 | - | 1.08 | 444 | 616 | 0.010 | 14.4 | 8.72 | c |
| HIJASS J1120+53 | 0.560 | - | 0.031 | 49.6 | - | 2.08 | 1014 | 1256 | 0.013 | 17.1 | 9.53 | cd |
| HIJASS J1123+50 | 0.069 | - | 0.014 | 8.48 | - | 2.64 | 17714 | 19321 | 0.014 | 17.1 | 8.77 | |
| HIJASS J1123+52 | 0.218 | - | 0.015 | 34.23 | - | 2.13 | 1976 | 2199 | 0.010 | 18.4 | 9.44 | d |
| HIJASS J1126+53 | 0.333 | 0.298 | 0.027 | 35.95 | 40.3 | 4.35 | 1306 | 1429 | 0.022 | 10.4 | 9.01 | e |
| HIJASS J1132+53 | 0.540 | 0.477 | 0.032 | 151.09 | 170.97 | 6.77 | 4676 | 4889 | 0.021 | 17.1 | 10.07 | ec |
| HIJASS J1132+39 | 0.103 | - | 0.014 | 8.11 | - | 1.96 | 8214 | 11521 | 0.013 | 22.5 | 8.98 | |
| HIJASS J1133+47 | 0.532 | 0.476 | 0.033 | 94.21 | 105.75 | 5.83 | 2626 | 2829 | 0.023 | 17.1 | 9.86 | ec |
| HIJASS J1133+49 | 0.059 | - | 0.009 | 2.12 | - | 0.92 | 4010 | 5215 | 0.009 | 4.2 | 6.95 | vi |
| HIJASS J1136+45 | 0.622 | - | 0.033 | 48.51 | - | 1.50 | 834 | 1006 | 0.010 | 3.2 | 8.07 | vi |
| HIJASS J1136+36 | 0.174 | 0.157 | 0.019 | 40.68 | 45.41 | 4.92 | 26710 | 28915 | 0.017 | 22.5 | 9.73 | ec |
| HIJASS J1137+47 | 0.354 | 0.317 | 0.022 | 53.33 | 59.8 | 3.51 | 2138 | 25512 | 0.015 | 17.1 | 9.61 | ec |
| HIJASS J1138+35 | 0.104 | 0.097 | 0.014 | 10.38 | 11.35 | 2.39 | 16016 | 19724 | 0.013 | 23.2 | 9.16 | e |
| HIJASS J1138+33 | 0.078 | 0.072 | 0.013 | 9.81 | 10.82 | 2.50 | 19912 | 21218 | 0.012 | 26.3 | 9.25 | ec |
| HIJASS J1138+43 | 0.047 | - | 0.006 | 5.26 | - | 1.08 | 15616 | 20624 | 0.006 | 17.1 | 8.56 | cn |
| HIJASS J1139+46 | 0.346 | - | 0.022 | 28.55 | - | 2.01 | 896 | 1259 | 0.013 | 17.1 | 9.29 | cd |
| HIJASS J1140+45 | 0.655 | 0.587 | 0.037 | 25.7 | 28.8 | 2.62 | 414 | 596 | 0.022 | 17.1 | 9.30 | ec |
| HIJASS J1141+46 | 0.057 | - | 0.008 | 4.45 | - | 1.05 | 10310 | 12115 | 0.007 | 17.1 | 8.49 | dn |
| HIJASS J1141+36 | 0.147 | 0.134 | 0.017 | 32.24 | 35.73 | 4.45 | 27314 | 31221 | 0.016 | 21.0 | 9.57 | e |
| HIJASS J1141+32 | 0.093 | 0.085 | 0.014 | 9.60 | 10.62 | 2.47 | 12916 | 15824 | 0.013 | 25.8 | 9.22 | ecn |
| HIJASS J1142+51 | 0.058 | - | 0.010 | 8.75 | - | 2.09 | 18420 | 22530 | 0.010 | 17.1 | 8.78 | c |
| HIJASS J1143+31 | 0.064 | - | 0.009 | 7.62 | - | 1.49 | 14810 | 16515 | 0.008 | 25.4 | 9.06 | c |
| HIJASS J1144+48 | 0.176 | 0.159 | 0.024 | 13.09 | 14.61 | 3.75 | 8810 | 10415 | 0.023 | 17.1 | 9.00 | e |
| HIJASS J1145+50 | 0.042 | - | 0.011 | 2.48 | - | 1.44 | 7130 | 10945 | 0.011 | 24.3 | 8.54 | fn |
| HIJASS J1146+50 | 0.068 | - | 0.013 | 5.18 | - | 1.93 | 8622 | 12933 | 0.013 | 17.1 | 8.55 | |
| HIJASS J1146+47 | 0.099 | - | 0.011 | 18.65 | - | 2.34 | 33710 | 36315 | 0.010 | 17.1 | 9.11 | c |
| HIJASS J1147+49 | 0.070 | - | 0.013 | 2.74 | - | 1.28 | 7514 | 9321 | 0.012 | 17.1 | 8.28 | b |
| HIJASS J1148+48 | 0.348 | - | 0.020 | 82.6 | - | 2.62 | 2626 | 3069 | 0.010 | 17.1 | 9.76 | cd |
| HIJASS J1149+39 | 0.123 | 0.114 | 0.020 | 12.05 | 13.25 | 3.49 | 15814 | 17521 | 0.019 | 12.5 | 8.69 | e |
| HIJASS J1149+48 | 0.137 | - | 0.014 | 5.39 | - | 1.28 | 428 | 5812 | 0.012 | 17.1 | 8.57 | d |
| HIJASS J1149+51 | 0.052 | - | 0.012 | 5.75 | - | 2.15 | 15222 | 17833 | 0.012 | 19.1 | 8.70 | cd |
| HIJASS J1150+45 | 0.100 | 0.093 | 0.015 | 11.74 | 12.91 | 2.81 | 14616 | 17324 | 0.014 | 17.1 | 8.95 | e |
| HIJASS J1150+51 | 0.130 | - | 0.013 | 23.81 | - | 2.53 | 2786 | 2929 | 0.011 | 17.1 | 9.21 | cd |
| HIJASS J1150+38 | 0.926 | - | 0.048 | 38.26 | - | 1.31 | 424 | 686 | 0.012 | 2.6 | 7.80 | vi |
| HIJASS J1151+38 | 0.235 | 0.210 | 0.016 | 28.21 | 31.66 | 2.51 | 1516 | 1689 | 0.012 | 13.3 | 9.12 | e3 |
| HIJASS J1151+48 | 0.090 | - | 0.011 | 6.06 | - | 1.40 | 6314 | 10221 | 0.010 | 16.9 | 8.61 | ci |
| HIJASS J1152+52 | 0.116 | - | 0.012 | 14.28 | - | 2.08 | 1388 | 15812 | 0.011 | 17.1 | 8.99 | cd |
| HIJASS J1152+44 | 0.904 | 0.808 | 0.046 | 76.02 | 85.37 | 4.02 | 934 | 1126 | 0.023 | 17.1 | 9.77 | ec |
| HIJASS J1152+50 | 0.076 | - | 0.011 | 5.61 | - | 1.46 | 8812 | 10818 | 0.010 | 17.1 | 8.59 | |
| HIJASS J1152+37 | 0.078 | - | 0.010 | 15.29 | - | 2.14 | 26212 | 28618 | 0.009 | 12.2 | 8.73 | i |
| HIJASS J1153+47 | 0.207 | 0.187 | 0.028 | 41.31 | 46.01 | 6.94 | 25116 | 28224 | 0.026 | 17.1 | 9.50 | ec |
| HIJASS J1153+52 | 0.165 | - | 0.014 | 38.2 | - | 2.85 | 4038 | 42712 | 0.011 | 17.1 | 9.42 | d |
| HIJASS J1154+30 | 0.063 | - | 0.010 | 3.58 | - | 1.15 | 5118 | 9127 | 0.009 | 13.6 | 8.20 | n |
| HIJASS J1156+50 | 0.164 | - | 0.011 | 22.83 | - | 1.61 | 1846 | 2069 | 0.008 | 17.1 | 9.20 | d5 |
| HIJASS J1156+48 | 0.140 | - | 0.012 | 13.21 | - | 1.65 | 9214 | 16921 | 0.010 | 17.1 | 8.96 | |
| HIJASS J1157+50 | 0.107 | - | 0.010 | 8.93 | - | 1.40 | 1188 | 13912 | 0.009 | 17.1 | 8.79 | d |
| HIJASS J1157+49 | 0.359 | 0.323 | 0.023 | 37.53 | 41.95 | 3.30 | 1216 | 1389 | 0.017 | 17.1 | 9.46 | e |
| HIJASS J1157+53 | 0.306 | 0.271 | 0.025 | 80.95 | 91.39 | 6.56 | 4578 | 48412 | 0.021 | 17.1 | 9.80 | ec |
| HIJASS J1158+38 | 0.297 | 0.266 | 0.025 | 35.33 | 39.61 | 4.36 | 1488 | 16612 | 0.021 | 13.2 | 9.21 | e |
| HIJASS J1158+50 | 0.207 | - | 0.015 | 11.46 | - | 1.39 | 5810 | 12015 | 0.011 | 17.1 | 8.90 | cd |
| HIJASS J1158+43 | 0.189 | 0.174 | 0.018 | 34.32 | 37.86 | 4.02 | 38710 | 41115 | 0.016 | 17.1 | 9.42 | e |
| HIJASS J1158+47 | 0.161 | 0.146 | 0.018 | 34.19 | 38.03 | 4.39 | 25310 | 27515 | 0.016 | 17.1 | 9.42 | e |
| HIJASS J1158+42 | 0.103 | 0.097 | 0.013 | 22.2 | 24.21 | 3.23 | 36612 | 38918 | 0.012 | 17.1 | 9.22 | ec |
| HIJASS J1158+45 | 0.142 | - | 0.011 | 6.43 | - | 0.92 | 466 | 629 | 0.008 | 17.1 | 8.65 | |
| HIJASS J1158+30 | 0.099 | 0.091 | 0.017 | 12.35 | 13.63 | 3.33 | 15216 | 17224 | 0.016 | 10.8 | 8.57 | e |
| HIJASS J1159+52 | 0.242 | 0.218 | 0.023 | 30.03 | 33.52 | 4.22 | 1758 | 19112 | 0.020 | 17.1 | 9.36 | ec |
| HIJASS J1201+33 | 0.070 | - | 0.011 | 2.86 | - | 1.09 | 5116 | 8224 | 0.010 | 11.2 | 7.93 | |
| HIJASS J1203+44 | 0.185 | 0.168 | 0.024 | 34.28 | 38.08 | 5.64 | 23716 | 27824 | 0.022 | 17.1 | 9.42 | ec |
| HIJASS J1204+52 | 0.623 | - | 0.033 | 32.31 | - | 1.23 | 554 | 816 | 0.010 | 4.4 | 8.16 | vi |
| HIJASS J1204+31 | 0.110 | 0.103 | 0.021 | 20.58 | 22.5 | 5.03 | 29520 | 32730 | 0.020 | 10.8 | 8.79 | e |
| HIJASS J1205+50 | 0.529 | 0.463 | 0.032 | 137.08 | 156.12 | 6.87 | 3306 | 3549 | 0.022 | 17.1 | 10.03 | ec |
| HIJASS J1205+47 | 0.420 | 0.378 | 0.030 | 72.0 | 80.54 | 5.71 | 25012 | 32718 | 0.023 | 9.1 | 9.19 | ec |
| HIJASS J1206+49 | 0.219 | 0.199 | 0.020 | 37.93 | 42.17 | 4.21 | 28218 | 37627 | 0.017 | 17.1 | 9.46 | ec |
| HIJASS J1206+43 | 0.284 | 0.231 | 0.039 | 47.59 | 59.63 | 10.12 | 23024 | 28736 | 0.037 | 15.0 | 9.50 | eci |
| HIJASS J1207+39 | 0.092 | 0.080 | 0.020 | 2.49 | 2.86 | 2.04 | 4816 | 6224 | 0.020 | 12.8 | 8.05 | e |
| HIJASS J1208+36 | 0.442 | 0.391 | 0.029 | 50.16 | 56.75 | 4.31 | 1496 | 1669 | 0.021 | 15.6 | 9.51 | e |
| HIJASS J1209+30 | 0.065 | - | 0.012 | 6.58 | - | 2.05 | 11518 | 14227 | 0.012 | 3.5 | 7.28 | v |
| HIJASS J1209+29 | 0.596 | 0.529 | 0.034 | 51.36 | 57.95 | 3.92 | 886 | 1109 | 0.022 | 8.5 | 8.99 | e |
| HIJASS J1209+53 | 0.081 | - | 0.011 | 11.46 | - | 2.02 | 17310 | 18815 | 0.010 | 17.1 | 8.90 | |
| HIJASS J1209+43A | 0.093 | - | 0.012 | 20.08 | - | 2.75 | 27718 | 33627 | 0.011 | 13.8 | 8.95 | i |
| HIJASS J1209+43B | 0.065 | - | 0.011 | 3.79 | - | 1.30 | 6712 | 8218 | 0.010 | 17.1 | 8.42 | n |
| HIJASS J1210+46 | 0.429 | 0.384 | 0.031 | 57.29 | 64.28 | 5.28 | 1606 | 1819 | 0.024 | 6.9 | 8.85 | evi |
| HIJASS J1210+39A | 0.361 | - | 0.021 | 57.04 | - | 2.35 | 2184 | 2356 | 0.011 | 15.0 | 9.48 | cd |
| HIJASS J1210+39B | 0.559 | - | 0.030 | 51.97 | - | 1.97 | 1214 | 1416 | 0.012 | 14.7 | 9.42 | cd |
| HIJASS J1211+50 | 0.489 | 0.436 | 0.033 | 122.01 | 137.23 | 7.55 | 3986 | 4229 | 0.025 | 17.1 | 9.98 | ec |
| HIJASS J1212+36 | 0.226 | - | 0.014 | 6.96 | - | 0.76 | 344 | 506 | 0.008 | 3.0 | 7.16 | vi |
| HIJASS J1212+29 | 0.391 | 0.351 | 0.031 | 43.48 | 48.65 | 5.01 | 1598 | 17912 | 0.025 | 15.8 | 9.46 | e |
| HIJASS J1212+37 | 0.095 | - | 0.014 | 6.89 | - | 1.88 | 7914 | 10621 | 0.013 | 15.4 | 8.58 | |
| HIJASS J1213+52 | 0.056 | - | 0.010 | 4.03 | - | 1.44 | 8614 | 10521 | 0.010 | 17.1 | 8.44 | |
| HIJASS J1213+43 | 0.376 | 0.337 | 0.030 | 57.46 | 64.38 | 5.88 | 2356 | 2529 | 0.025 | 17.1 | 9.65 | e |
| HIJASS J1213+24 | 0.080 | - | 0.009 | 3.97 | - | 0.96 | 568 | 7112 | 0.008 | 13.0 | 8.20 | |
| HIJASS J1213+36 | 0.424 | - | 0.024 | 20.02 | - | 1.29 | 516 | 769 | 0.011 | 2.8 | 7.57 | dbvi |
| HIJASS J1215+35 | 0.160 | 0.143 | 0.018 | 12.1 | 13.57 | 2.65 | 7514 | 11121 | 0.016 | 13.7 | 8.78 | ec |
| HIJASS J1215+33 | 0.162 | 0.146 | 0.024 | 30.21 | 33.76 | 5.95 | 23222 | 29133 | 0.023 | 15.1 | 9.26 | eci |
| HIJASS J1215+51 | 0.106 | - | 0.011 | 11.14 | - | 1.74 | 11410 | 14715 | 0.010 | 7.9 | 8.21 | |
| HIJASS J1215+43 | 0.078 | - | 0.008 | 5.82 | - | 1.03 | 8910 | 11515 | 0.007 | 8.7 | 8.01 | |
| HIJASS J1215+36 | 3.438 | - | 0.172 | 206.03 | - | 1.45 | 644 | 906 | 0.011 | 2.9 | 8.60 | cdbvi |
| HIJASS J1215+48 | 0.071 | - | 0.013 | 7.64 | - | 2.29 | 14016 | 16524 | 0.013 | 17.1 | 8.72 | c |
| HIJASS J1215+47 | 0.123 | - | 0.014 | 34.83 | - | 3.72 | 39012 | 42118 | 0.013 | 17.1 | 9.38 | 5 |
| HIJASS J1216+52 | 0.293 | 0.250 | 0.019 | 8.68 | 10.13 | 1.52 | 346 | 559 | 0.014 | 4.2 | 7.62 | ecvi |
| HIJASS J1216+46 | 0.053 | - | 0.008 | 5.98 | - | 1.45 | 14310 | 15515 | 0.008 | 17.1 | 8.61 | |
| HIJASS J1216+28 | 0.189 | 0.171 | 0.016 | 11.7 | 13.01 | 2.08 | 698 | 9412 | 0.014 | 17.1 | 8.95 | e |
| HIJASS J1217+45 | 0.426 | 0.383 | 0.029 | 42.27 | 47.27 | 4.16 | 1146 | 1359 | 0.022 | 8.2 | 8.88 | e |
| HIJASS J1217+37 | 2.639 | 2.263 | 0.117 | 377.52 | 437.73 | 6.63 | 2014 | 2216 | 0.028 | 4.3 | 9.28 | ecbvi |
| HIJASS J1217+22 | 0.246 | 0.223 | 0.028 | 35.4 | 39.42 | 5.88 | 22112 | 25218 | 0.026 | 5.1 | 8.39 | e |
| HIJASS J1218+46 | 0.079 | - | 0.012 | 6.26 | - | 1.67 | 16410 | 17715 | 0.011 | 5.8 | 7.69 | fdnb |
| HIJASS J1218+47 | 1.463 | 1.233 | 0.068 | 457.69 | 540.16 | 9.97 | 4174 | 4406 | 0.028 | 7.6 | 9.87 | ecdi |
| HIJASS J1219+46 | 0.076 | - | 0.008 | 2.36 | - | 0.66 | 346 | 479 | 0.007 | 6.6 | 7.38 | dn |
| HIJASS J1220+45 | 0.048 | - | 0.009 | 3.21 | - | 1.25 | 7918 | 11027 | 0.009 | 17.1 | 8.34 | f |
| HIJASS J1220+29 | 0.046 | - | 0.009 | 10.47 | - | 2.31 | 39222 | 43233 | 0.009 | 16.1 | 8.81 | ci |
| HIJASS J1220+47 | 0.071 | - | 0.013 | 3.13 | - | 1.47 | 4918 | 8027 | 0.013 | 17.1 | 8.33 | 3 |
| HIJASS J1220+46 | 0.229 | - | 0.015 | 36.51 | - | 1.93 | 17310 | 24315 | 0.009 | 8.4 | 8.78 | d |
| HIJASS J1220+38 | 0.125 | - | 0.013 | 3.51 | - | 0.99 | 318 | 5312 | 0.011 | 8.7 | 7.79 | |
| HIJASS J1221+45 | 0.248 | - | 0.014 | 8.51 | - | 0.60 | 324 | 536 | 0.006 | 7.5 | 8.05 | dc |
| HIJASS J1221+35 | 0.077 | - | 0.011 | 3.29 | - | 1.11 | 4610 | 6015 | 0.010 | 10.7 | 7.95 | |
| HIJASS J1222+32 | 0.146 | 0.133 | 0.019 | 8.67 | 9.63 | 2.61 | 6114 | 8921 | 0.018 | 16.4 | 8.79 | e |
| HIJASS J1222+39 | 0.066 | - | 0.011 | 2.90 | - | 1.13 | 5210 | 6415 | 0.010 | 15.9 | 8.24 | n |
| HIJASS J1224+31 | 0.140 | 0.127 | 0.034 | 20.06 | 22.32 | 7.44 | 19516 | 20724 | 0.033 | 17.9 | 9.23 | e |
| HIJASS J1224+39 | 0.059 | - | 0.012 | 5.72 | - | 2.01 | 10726 | 15839 | 0.012 | 15.3 | 8.50 | |
| HIJASS J1225+26 | 0.116 | 0.107 | 0.024 | 14.36 | 15.82 | 4.76 | 13724 | 17236 | 0.023 | 5.1 | 7.98 | eci |
| HIJASS J1225+28 | 0.151 | 0.136 | 0.020 | 6.84 | 7.66 | 2.43 | 4416 | 8124 | 0.019 | 6.6 | 7.90 | e |
| HIJASS J1225+45 | 0.052 | - | 0.009 | 7.14 | - | 1.79 | 16814 | 18921 | 0.009 | 17.1 | 8.69 | |
| HIJASS J1225+27 | 0.434 | 0.389 | 0.029 | 44.84 | 50.27 | 4.26 | 1226 | 1459 | 0.022 | 10.5 | 9.12 | e |
| HIJASS J1225+33 | 3.067 | 2.681 | 0.139 | 315.03 | 359.38 | 7.29 | 1184 | 1386 | 0.037 | 4.7 | 9.28 | ei |
| HIJASS J1226+31 | 0.310 | 0.278 | 0.028 | 74.1 | 83.04 | 7.06 | 35414 | 42121 | 0.024 | 17.7 | 9.79 | ei |
| HIJASS J1226+27 | 0.040 | - | 0.010 | 2.40 | - | 1.32 | 7320 | 9230 | 0.010 | 5.2 | 7.18 | f |
| HIJASS J1227+37 | 0.407 | - | 0.023 | 24.78 | - | 1.33 | 644 | 876 | 0.010 | 5.0 | 8.16 | dvi |
| HIJASS J1227+43 | 0.546 | - | 0.030 | 13.88 | - | 1.12 | 284 | 426 | 0.013 | 2.6 | 7.34 | dbvi |
| HIJASS J1228+22A | 0.069 | - | 0.010 | 3.14 | - | 1.03 | 498 | 5912 | 0.009 | 8.0 | 7.67 | df |
| HIJASS J1228+44 | 2.752 | - | 0.138 | 250.36 | - | 2.43 | 916 | 1429 | 0.015 | 4.3 | 9.03 | dvi |
| HIJASS J1228+37 | 0.180 | - | 0.011 | 12.03 | - | 0.97 | 698 | 11012 | 0.007 | 4.7 | 7.80 | dvi |
| HIJASS J1228+35 | 0.191 | 0.173 | 0.018 | 5.20 | 5.79 | 1.58 | 2910 | 5515 | 0.016 | 4.7 | 7.49 | e5i |
| HIJASS J1228+43 | 0.498 | - | 0.027 | 26.04 | - | 1.35 | 594 | 766 | 0.011 | 8.5 | 8.65 | b |
| HIJASS J1228+22B | 0.243 | - | 0.016 | 30.18 | - | 2.09 | 1364 | 1536 | 0.011 | 8.7 | 8.73 | d |
| HIJASS J1228+42 | 0.064 | - | 0.010 | 2.04 | - | 0.96 | 4018 | 8127 | 0.010 | 6.7 | 7.34 | fd |
| HIJASS J1230+42 | 0.097 | - | 0.012 | 11.09 | - | 2.00 | 15114 | 19221 | 0.011 | 6.3 | 8.01 | fc5 |
| HIJASS J1230+41 | 2.324 | 2.019 | 0.108 | 361.91 | 414.95 | 9.27 | 1758 | 24112 | 0.038 | 8.9 | 9.89 | ecd |
| HIJASS J1231+29 | 0.146 | 0.131 | 0.017 | 8.77 | 9.81 | 2.36 | 678 | 8012 | 0.016 | 9.2 | 8.29 | e |
| HIJASS J1232+39 | 0.140 | - | 0.012 | 4.35 | - | 0.95 | 338 | 5612 | 0.010 | 10.4 | 8.04 | db |
| HIJASS J1232+42 | 0.249 | 0.226 | 0.021 | 16.77 | 18.65 | 2.78 | 808 | 10112 | 0.018 | 8.5 | 8.50 | eb |
| HIJASS J1232+37 | 0.233 | 0.211 | 0.024 | 29.4 | 32.76 | 4.67 | 18112 | 21218 | 0.022 | 7.7 | 8.66 | e |
| HIJASS J1232+31 | 0.610 | 0.543 | 0.034 | 37.5 | 42.22 | 3.00 | 614 | 786 | 0.020 | 4.9 | 8.37 | ei |
| HIJASS J1233+32 | 0.089 | 0.080 | 0.014 | 5.81 | 6.49 | 1.99 | 7318 | 10927 | 0.013 | 13.3 | 8.44 | ec5 |
| HIJASS J1233+33 | 0.083 | 0.074 | 0.014 | 2.42 | 2.73 | 1.34 | 3024 | 7636 | 0.013 | 12.1 | 7.97 | e |
| HIJASS J1233+24 | 0.068 | 0.060 | 0.015 | 2.05 | 2.34 | 1.59 | 3232 | 8048 | 0.015 | 18.4 | 8.27 | e |
| HIJASS J1233+39 | 0.108 | - | 0.011 | 3.26 | - | 0.93 | 338 | 5012 | 0.010 | 10.0 | 7.89 | d |
| HIJASS J1233+30 | 0.081 | 0.075 | 0.014 | 8.68 | 9.55 | 2.50 | 14922 | 19533 | 0.013 | 16.8 | 8.80 | e |
| HIJASS J1234+39 | 0.105 | - | 0.012 | 7.85 | - | 1.62 | 768 | 9212 | 0.011 | 10.3 | 8.29 | |
| HIJASS J1234+35 | 0.692 | 0.617 | 0.036 | 66.77 | 75.07 | 3.38 | 1224 | 1396 | 0.018 | 11.8 | 9.39 | e |
| HIJASS J1235+41 | 0.065 | - | 0.011 | 1.78 | - | 0.89 | 3112 | 4718 | 0.010 | 9.4 | 7.57 | |
| HIJASS J1235+27 | 1.566 | 1.380 | 0.073 | 273.75 | 310.4 | 5.87 | 2424 | 2576 | 0.023 | 11.5 | 9.99 | ec |
| HIJASS J1236+25 | 1.292 | 1.127 | 0.062 | 272.72 | 311.65 | 7.36 | 4976 | 5239 | 0.026 | 12.0 | 10.02 | eci |
| HIJASS J1236+40 | 0.172 | 0.155 | 0.020 | 24.25 | 27.1 | 4.05 | 19010 | 20615 | 0.018 | 8.1 | 8.63 | e |
| HIJASS J1238+32 | 0.485 | 0.435 | 0.026 | 13.79 | 15.45 | 1.52 | 294 | 446 | 0.015 | 3.8 | 7.73 | ei |
| HIJASS J1239+44 | 0.193 | 0.175 | 0.020 | 7.32 | 8.14 | 2.09 | 388 | 5512 | 0.018 | 8.9 | 8.18 | e |
| HIJASS J1240+32 | 0.079 | - | 0.008 | 5.58 | - | 1.00 | 7512 | 11318 | 0.007 | 11.1 | 8.21 | df |
| HIJASS J1241+41 | 1.050 | 0.911 | 0.052 | 110.61 | 126.98 | 5.22 | 1366 | 1799 | 0.026 | 8.7 | 9.36 | ec |
| HIJASS J1242+32 | 1.848 | - | 0.094 | 449.62 | - | 3.98 | 2984 | 3246 | 0.015 | 7.3 | 9.75 | cdi |
| HIJASS J1242+38 | 0.522 | 0.469 | 0.036 | 23.65 | 26.48 | 3.45 | 476 | 629 | 0.027 | 4.6 | 8.11 | ei |
| HIJASS J1243+24 | 0.047 | - | 0.010 | 4.62 | - | 1.69 | 11512 | 12418 | 0.010 | 25.8 | 8.86 | f |
| HIJASS J1243+32 | 2.050 | - | 0.103 | 255.85 | - | 2.28 | 1346 | 1849 | 0.012 | 9.4 | 9.73 | cd |
| HIJASS J1244+34 | 0.246 | 0.223 | 0.016 | 13.13 | 14.62 | 1.65 | 584 | 726 | 0.012 | 9.0 | 8.44 | eb |
| HIJASS J1244+28 | 0.079 | 0.070 | 0.011 | 4.87 | 5.49 | 1.51 | 7112 | 9218 | 0.010 | 13.4 | 8.37 | e |
| HIJASS J1245+27 | 0.105 | 0.097 | 0.015 | 9.82 | 10.81 | 2.52 | 10220 | 15730 | 0.014 | 15.3 | 8.78 | ec |
| HIJASS J1246+36 | 0.554 | 0.493 | 0.038 | 19.02 | 21.41 | 3.25 | 336 | 559 | 0.029 | 3.0 | 7.65 | ei |
| HIJASS J1250+25 | 0.508 | - | 0.027 | 101.09 | - | 1.92 | 3826 | 4139 | 0.008 | 12.4 | 9.56 | di |
| HIJASS J1250+41 | 0.581 | 0.504 | 0.042 | 98.67 | 113.17 | 8.42 | 2108 | 23912 | 0.033 | 4.4 | 8.71 | ei |
| HIJASS J1251+26 | 0.069 | - | 0.009 | 3.36 | - | 0.95 | 5114 | 8721 | 0.008 | 17.7 | 8.39 | df |
| HIJASS J1251+25 | 0.402 | - | 0.023 | 32.19 | - | 1.68 | 7810 | 17615 | 0.011 | 17.1 | 9.34 | d |
| HIJASS J1254+27 | 1.037 | 0.911 | 0.051 | 90.71 | 103.07 | 4.16 | 924 | 1106 | 0.023 | 4.0 | 8.60 | ei |
| a Flags for extended (e) and confused (c) H I sources, H I sources without a central position from a position fit (f), newly detected sources in the | ||||||||||||
| 21–cm emission line (n), H I sources lying nearby negative bandpass sidelobes (b), DUCHAMP double detections (d), H I sources with systemic | ||||||||||||
| velocities below 300 km s-1 (v) and sources with independent distance measurements available (i). Numbers indicate H I sources with higher | ||||||||||||
| order baseline fits to their spectra. | ||||||||||||
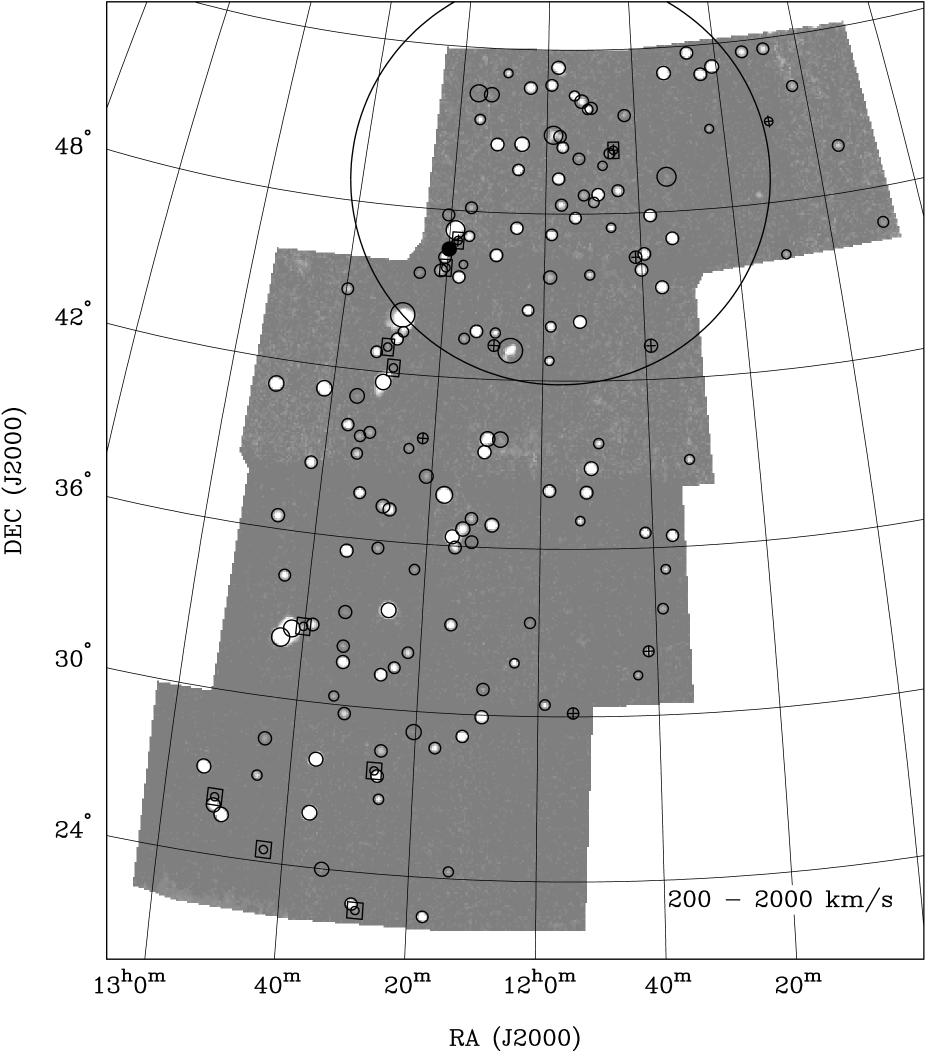
| HIJASS J1226+27 (IC3341f) | HIJASS J1228+42 (MCG+07-26-011fd) | |||
|

|
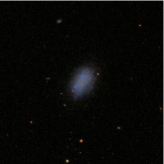
|

|
|
| HIJASS J1228+35 (UGC07605e5i) | HIJASS J1235+41 (UGC07751) | |||
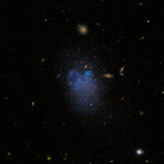
|

|
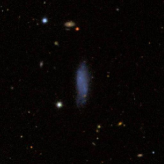
|

|
|
| HIJASS J1246+36 (UGC07949ei) | HIJASS J1228+22A (UGC07584df) | |||
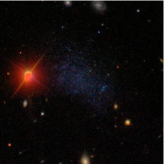
|

|
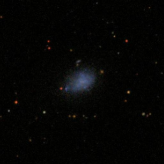
|

|
|
| HIJASS J1238+32 (UGCA292ei) | HIJASS J1220+38 (KUG1218+387) | |||
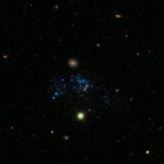
|

|
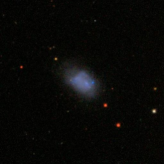
|

|
|
| HIJASS J1233+39 (MCG+07-26-024d) | HIJASS J1201+33 (UGC07007) | |||
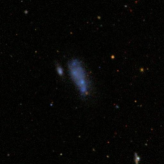
|

|
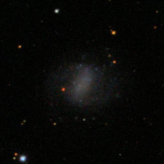
|

|
|
| HIJASS J1219+46dn | HIJASS J1218+46 (SDSSJ121811.04+465501.2fdnb) | |||
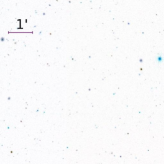
|
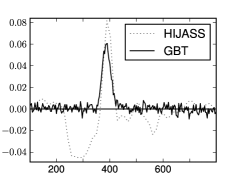
|
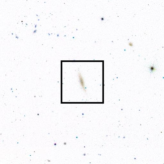
|
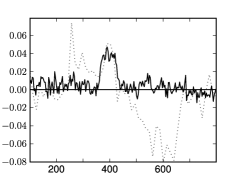
|
|
| HIJASS J1222+39 (SDSSJ122206.12+394452.4n) | HIJASS J1209+43B (UGC07146n) | |||
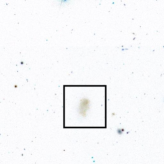
|
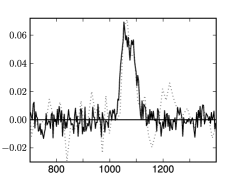
|
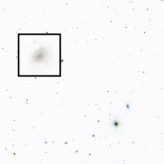
|
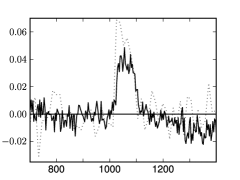
|
|
| HIJASS J1141+46 (CGCG242-075dn) | HIJASS J1145+50 (SDSSJ114506.26+501802.4fn) | |||
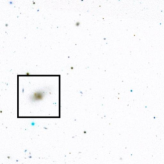
|
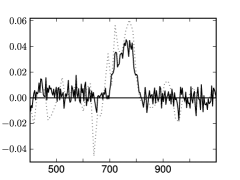
|
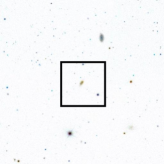
|
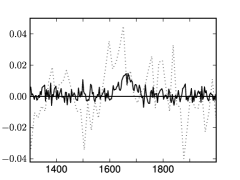
|
|
| HIJASS J1138+43 (UGC06611cn) | HIJASS J1154+30 (SDSSJ115404.42+300634.6n) | |||
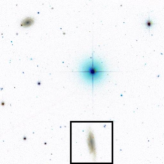
|
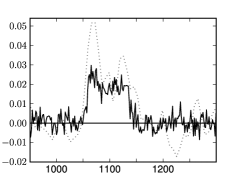
|
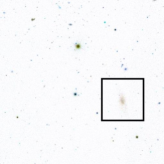
|
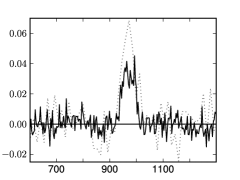
|
|
| HIJASS J1109+50 (UGC06202n) | HIJASS J1141+32 (MRK0746ecn) | |||
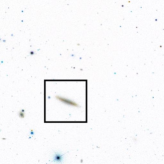
|
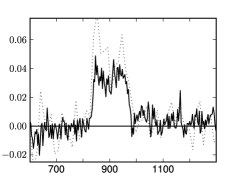
|
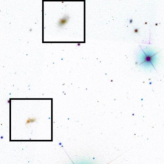
|
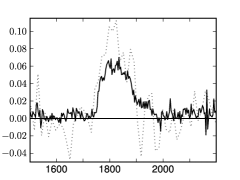
|
|
3.4 Candidate galaxy/HI cloud
The presented catalogue of 166 H I sources in the Ursa Major region contains 162 H I detections, which are clearly associated with previously catalogued galaxies as listed in the NASA/IPAC Extragalactic Database (NED – with cross-identfications) or the Sloan Digital Sky Survey (SDSS DR8 – redshift confidence level ). Another three HIJASS detections – namely HIJASS J1226+27, HIJASS J1243+24 and HIJASS J1233+24 – can be matched up with H I sources listed in the ALFALFA 40 per cent catalogue (Haynes et al., 2011) and have been assigned to IC3341, KUG1240+247 and MAPS-NGP O3780206985 respectively. Note that HIJASS J1233+24 was first catalogued in Lang et al. (2003) using the same HIJASS data set and is therefore listed in NED (without cross-identifications). Therefore, only one H I detection – HIJASS J1219+46 – does not have a previously catalogued optical counterpart with known velocity listed in NED, SDSS or ALFALFA (HIJASS J1219+46 lies outside the ALFALFA declination range).
To identify a potential optical counterpart of the candidate galaxy/H I cloud we investigate SDSS and Digitized Sky Survey (DSS) images. We compare the images centered on the central position of HIJASS J1219+46 to the ones of the lowest H I mass and previously catalogued galaxies in the sample (see Figure 4). One might expect that the candidate dwarf galaxy has a similar optical counterpart as the known galaxies within the same mass bin - however, as it has not been previously catalogued one might also expect it to have lower surface brightness and thus be less easily visible. All of the lowest H I mass galaxies show faint patches of nebulosity in the multi-colour SDSS images (Figure 4). Furthermore, we show HIJASS sources that are newly detected in the 21-cm emission line in Figure 5. These SDSS images are centred on the H I position and therefore show typical offsets from the optical counterparts. For clarification we invert the colours of the multi-colour SDSS images in Figure 5 (as opposed to Figure 4). We do not find a similar galaxy in the images for HIJASS J1219+46 within the search radius (the position uncertainty is 1.2 arcmin as given in Table LABEL:tab:A_cat). There are multiple galaxies listed in SDSS with no redshift measurements, which match in position to the candidate galaxy/H I cloud. To determine the optical counterpart(s) and/or confirm the H I cloud accurate position is required from follow-up observations. It is also quite possible that deeper optical imaging is required to determine any optical counterparts.
In Figure 6 we show a 1.4 deg 1.4 deg DSS B-band image of the candidate galaxy/H I cloud and its surroundings with overlaid H I intensity contours integrated over the velocity range from 360 to 430 km s-1. HIJASS J1219+46 is a confused source in the DUCHAMP output with HIJASS J1220+46/NGC4288. The angular separation to NGC4288 is 0.3 deg, which corresponds to a distance of 40 kpc assuming that the region lies at a distance of 7.6 Mpc. To the north of HIJASS J1219+46 lies HIJASS J1218+46 (SDSSJ121811.04+465501.2) and HIJASS J1218+47/M106 (including NGC4248, UGC07356 and two SDSS galaxies). The angular separation to M106 is 0.7 deg, which corresponds to 93 kpc. Although, HIJASS J1219+46 lies nearby negative bandpass sidelobes emerging from HIJASS J1218+47/M106 the Green Bank Telescope follow-up observations confirm the H I properties measured in HIJASS as given in Table 4 (the GBT and HIJASS spectra are shown in Figure 5 – the negative bandpass sidelobes are apparent at 220 to 360 km s-1 in the HIJASS spectrum). The nature of HIJASS J1219+46 could be tidally stripped gas or a dwarf companion.
Wilcots et al. (1996) observed NGC4288 using the Very Large Array (D-configuration; channel width of 5.2 km s-1 and a rms nois of 1.0 mJy beam-1) finding a gas cloud to the south of NGC4288 (also see Kovač et al. 2009). Furthermore, the gas cloud shows a tidally disrupted H I stream that extends well beyond the optical disk of NGC4288 (Wilcots et al., 1996) towards HIJASS J1219+46. However, HIJASS J1219+46 lies just outside the area covered by Wilcots et al. (1996) and Kovač et al. (2009).
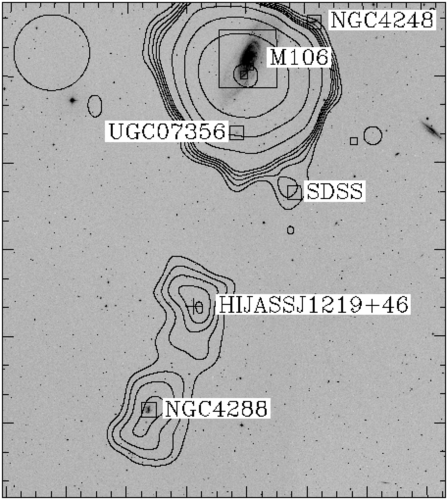
3.5 Comparison of measured HI parameters with values in the literature and follow-up observations
We find 165 H I sources with one or more associate optical counterparts as listed in NED and SDSS in the HIJASS data. For H I detections with one, clear associate counterpart, i.e. H I sources that are not confused (c), not double detections (d) and not in the vicinity of negative bandpass (b) sidelobes (as labelled in this catalogue in Section 3.2), we show the position and velocity offsets from our measured H I parameters to previously obtained H I parameters in Figure 7. We compare our results to recent literature values: (i) Verheijen & Sancisi (2001) extensively studied 43 spiral galaxies in the Ursa Major cluster using WSRT, (ii) Springob et al. (2005) have compiled a homogenous sample of H I properties of more than 9000 galaxies from single dish observations, (iii) Kovač et al. (2009) have conducted a blind H I survey in the Canes Venatici region using the WSRT and (iv) the ongoing ALFALFA survey using the Arecibo covers a strip in the southern part of the region () (Haynes et al., 2011). The congruent sample of clear H I sources in this study and the literature includes 78 galaxies. The central positions and velocities presented in this paper are generally consistent with the literature values within the errors (see Figure 7).
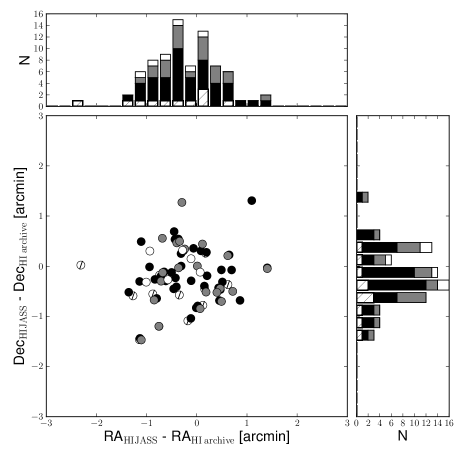
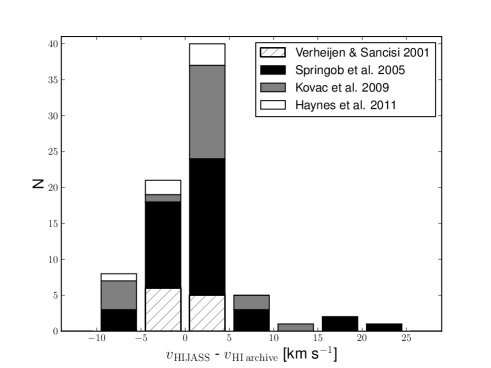
In Figure 8 we compare the integrated fluxes measured in HIJASS to recent literature values as well as the GBT follow-up observations listed in Table 4. We show a comparison of the percentage difference of integrated fluxes measured in HIJASS to the ones in the literature and with the GBT (top) as well as the comparison of the absolute flux values for the sample (bottom). The percent difference is calculated as follows:
Some integrated fluxes differ by more than 20, in particular in comparison to Kovač et al. (2009). This may be explained as they use an interferometric dataset (obtained with WSRT) which is not sensitive to diffuse H I emission compared to a single-dish observation.
There are some data points that lie outside the displayed range in Figure 8 (top): HIJASS J1254+27/NGC4789A with Diff = 219 in comparison with Springob et al. (2005). We find a wide range of literature values for this dwarf irregular galaxy. NGC4789A has a large H I to optical radius ratio (Hoffman et al., 1996), therefore some telescopes may resolve out significant flux. There are two outliers in comparison with the GBT follow-up observations – HIJASS J1218+46/SDSSJ121811.04+465501.2 (Diff = 152) and HIJASS J1145+50/SDSSJ114506.26+501802.4 (Diff = 202). See Figure 5 for the comparison of the GBT and HIJASS spectra. HIJASS J1218+46 is a double detection with HIJASS J1218+47 including M106, UGC07356, NGC4248 and two SDSS galaxies (also see Figure 6). Given that the angular separation between SDSSJ121811.04+465501.2 and M106 is 24.5 arcmin and the angular separation between SDSSJ121811.04+465501.2 and UGC07356 is 14.4 arcmin, these galaxies may contribute a significant amount of flux to the HIJASS detection (FWHM 13.1 arcmin) in comparison to the GBT observation (FWHM 9 arcmin). Regarding SDSSJ114506.26+501802.4, the mean signal-to-noise ratio in the HIJASS data is only 1.5 – therefore the rms noise contributes significantly to the measured integrated H I flux in comparison to the GBT data. In general, this literature comparison shows that H I properties of galaxies measured with different telescopes and obtained with different parametrization procedures lead to consistent results within the errors. However, for H I detections near the detection limit, the noise can cause fluctuations in the H I measurements.
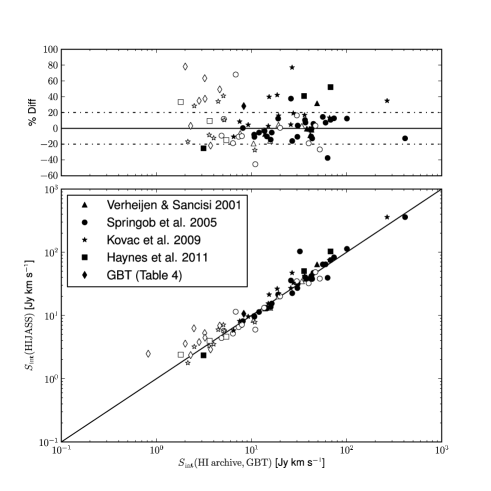
| rms | ||||||||
|---|---|---|---|---|---|---|---|---|
| HIJASS name | km s-1 | Jy | Jy | Jy km s-1 | Jy km s-1 | km s-1 | km s-1 | Jy |
| (A1) | (A5) | (B2) | (B4) | (B5) | (B7) | (B8) | (B9) | (B10) |
| HIJASS J1109+50 | 905 2 | 0.049 | 0.006 | 4.63 | 0.36 | 132 4 | 146 6 | 0.005 |
| HIJASS J1138+43 | 1190 2 | 0.030 | 0.004 | 3.22 | 0.28 | 155 4 | 171 6 | 0.004 |
| HIJASS J1141+46 | 755 3 | 0.045 | 0.006 | 3.24 | 0.33 | 75 6 | 105 9 | 0.005 |
| HIJASS J1141+32 | 1852 4 | 0.070 | 0.008 | 8.29 | 0.55 | 123 8 | 198 12 | 0.007 |
| HIJASS J1145+50 | 1663 8 | 0.015 | 0.005 | 0.82 | 0.27 | 68 16 | 105 24 | 0.005 |
| HIJASS J1154+30 | 972 2 | 0.045 | 0.007 | 2.01 | 0.31 | 60 4 | 72 6 | 0.006 |
| HIJASS J1209+43B | 1061 3 | 0.049 | 0.007 | 2.81 | 0.38 | 69 6 | 90 9 | 0.007 |
| HIJASS J1218+46 | 398 2 | 0.047 | 0.006 | 2.48 | 0.30 | 62 4 | 75 6 | 0.006 |
| HIJASS J1219+46 | 390 1 | 0.061 | 0.004 | 2.29 | 0.14 | 36 2 | 56 3 | 0.003 |
| HIJASS J1222+39 | 1071 2 | 0.069 | 0.006 | 3.71 | 0.28 | 59 4 | 81 6 | 0.005 |
4 Discussion and results
4.1 Velocity Distribution
The velocity distribution of galaxies residing in the Ursa Major region is shown in Figure 9. The top panel shows the velocity distribution of galaxies as listed in SDSS (white) with spectroscopic redshifts with confidence levels and additional galaxies listed in NED (grey) with cross-identifications. To avoid duplicates we cross-correlate the galaxies listed in NED and SDSS within 1 arcmin and 50 km s-1 of the central position and velocity. The bottom panel shows the velocity distribution of the H I selected galaxies as catalogued in this paper with systemic velocities between 300 and 1900 km s-1. The H I detections are colour-coded according to H I sources with associate optical counterparts (in grey) and the previously uncatalogued candidate galaxy/H I cloud (in black).
One can see the large scale structure of the region - the overdensity appearing at 950 km s-1 in the optical and (less clearly) in the H I selected sample indicates the presence of the Ursa Major cluster. There are 212 galaxies listed in SDSS and NED within the Ursa Major cluster definition by Tully et al. (1996). In this paper we present 51 H I detections within the cluster definition by Tully et al. (1996) that contain 96 previously catalogued galaxies. The high number of confused detections in our data is due to a high density of galaxies in the cluster. We will discuss cluster/group membership, substructures and HIJASS non-detections in a forthcoming paper but the number of high-probability cluster members is likely to increase significantly from the 79 cluster members identified in Tully et al. (1996).
There are many groups nearby the cluster, which overlap and make the cluster difficult to define. In paricular foreground galaxy groups with velocities km s-1 lead to an asymmetric galaxy distribution in the optical and H I selected sample. The number of galaxies with velocities km s-1 is lower than the number of galaxies residing in the foreground. This may be a selction effect or could indicate the filamentary structure: the Ursa Major cluster (at 17.1 Mpc) is connected with the Virgo cluster (at 16 Mpc Mei et al. 2007) via the galaxies and galaxy groups lying at the low velocity end.
Figure 9 also shows one nearby candidate galaxy/H I cloud. We find no candidate galaxies/H I clouds in the Ursa Major cluster, where one might expect to find some e.g. due to previously uncatalogued gas-rich dwarf irregular galaxies or the presence of stripped H I gas. Given that our H I mass limit at the distance of the Ursa Major cluster is 2.5 M⊙ (assuming a velocity width of 100 km s-1) we cannot rule out candidate galaxies/H I clouds below the H I mass limit.
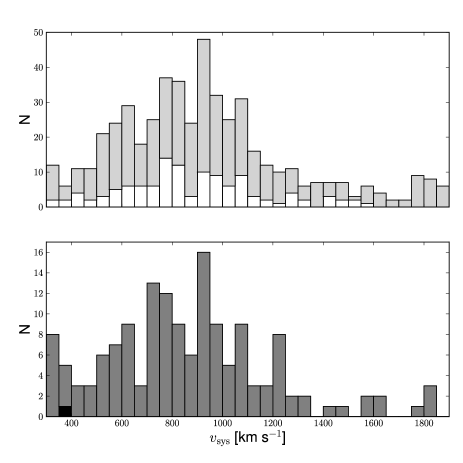
4.2 HI Mass Distribution
Figure 10 shows the H I mass distribution of 151 H I sources as listed in this catalogue (excluded are 15 galaxies with central velocities below 300 km s-1). H I sources that have been previously detected and are listed in NED/SDSS are shown in grey whereas the candidate galaxy/H I cloud is presented in black. The latter inhabits the low H I mass end and is likely to be a dwarf galaxy, i.e. of the same galaxy population as the previously catalogued galaxies within the same mass bin. Taylor & Webster (2005) note that ‘dark’ (optically invisible) H I galaxies are unlikely to be detected in our studied mass range between and M⊙ as the H I gas is normally associated with star formation or is destroyed. Meurer et al. (2006) also find that dormant (non-star-forming) galaxies with H I masses above M⊙ are very rare. However, high resolution follow-up observations are required to determine the nature of HIJASS J1219+46. We discussed the candidate galaxy/H I cloud in more detail in Section 3.4. We note that we did not find a numerous low-mass population of gas-rich dwarf galaxies to solve the dwarf deficiency problem as discussed in Trentham et al. (2001).
We can place an upper limit on the H I mass for the galaxies listed in NED/SDSS within the Ursa Major region, which we did not detect in HIJASS. The survey sensitivity is M⊙ (assuming a velocity width of 100 km s-1 and a distance of 17.1 Mpc). A lower H I mass limit is valid for galaxies lying in the foreground groups and filamentary structure (with km s-1 and distances Mpc), wheras for background galaxies ( km s-1) with distances Mpc a slightly higher H I mass limit is appropriate (as ).
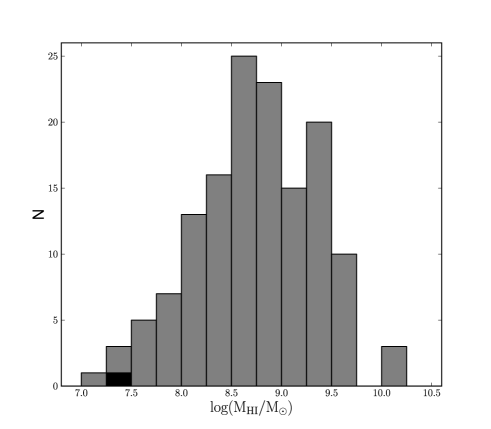
4.3 Candidates for galaxy-galaxy interactions
In this paper, there are 54 H I detections (33 per cent) which have two or more optical counterparts as listed in NED/SDSS within the gridded beam size and within the velocity range of the H I detection (see H I detections labelled with ‘c’ in the catalogue in Section 3.2). We can not clearly associate the H I content with only one optical counterpart. However, these H I detections with multiple optical counterparts are intriguing objects as galaxy-galaxy interactions might take place due to the small separation between the galaxies (e.g. 10 arcmin corresponds to 50 kpc at a distance of 17.1 Mpc).
For example, HIJASS J1141+32 encompasses four previously known dwarf galaxies within 1700 and 1900 km s-1 (see Figure 11): MRK0746, KUG1138+327, WAS28 and SDSSJ114135.98+321654.0 (which has no cross-identification in NED and is therefore not listed in our catalogue) – there are no previous detections in the 21-cm emission line for any of these galaxies. High resolution follow up observations are required to study the H I distribution, kinematics and possible interaction of these galaxies.
HIJASS J1220+29 encompasses three previously catalogued galaxies (see Figure 11) at km s-1, namely NGC4278 (elliptical), SDSSJ122005.73+291650.0 (spiral) and NGC4286 (spiral) (ordered with increasing angular separation from the central H I position). Morganti et al. (2006) have conducted a WSRT observation of NGC4278, NGC4286 and SDSSJ122005.73+291650.0 – the observations reveal two tail-like structures west and south-west of NGC4278.
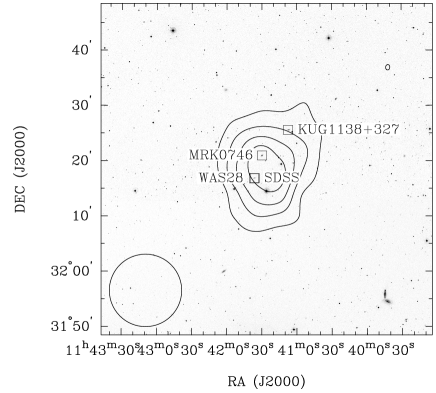
|
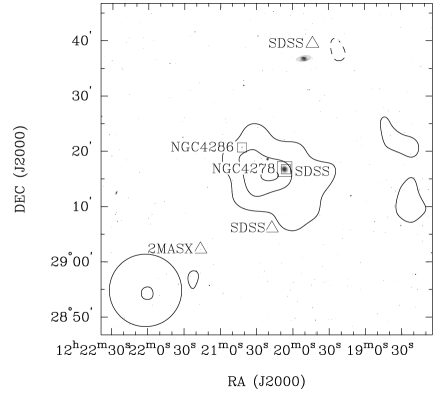
|
Out of the 54 confused HIJASS detections, 33 galaxies appear to have dwarf companions (one or two small objects as listed in SDSS, 2MASX, SBS, MCG, HS, CGCG). This leaves us with 21 high-probability candidates for galaxy-galaxy interactions of which 11 HIJASS detections (52 per cent) are within the Ursa Major cluster as defined by Tully et al. (1996). It is remarkable that the Ursa Major cluster as defined by Tully et al. (1996) only comprises approximately 12 per cent of the surveyed volume discussed in this paper but contains about half of all high-probablility candidates for galaxy-galaxy interactions. This is also the case (48 per cent) if we include two nearby DUCHAMP double detections, i.e. we do not only consider galaxies within the gridded beam (as the physical size of the beam is smaller for nearby regions) but also merged H I detections as candidates for high-probability galaxy-galaxy interactions. Verheijen & Sancisi (2001) have observed 10 of the high-probability candidates for galaxy-galaxy interactions in the Ursa Major cluster. The sample includes the most massive galaxy (Messier109), the largest (NGC3718) and some of the brightest systems (NGC4026, NGC4111 and NGC4088).
According to Verheijen & Sancisi (2001) the interacting systems are: (i) NGC3769 is strongly interacting with its dwarf companion NGC3769A. (ii) NGC3893 is an interacting pair with NGC3896. (iii) Some tidal debris can be seen in the interacting pair IC0750 and IC0749. (iv) The largest galaxy in the cluster – NGC3718 – shows distorted morphology and may be interacting with NGC3729. (v) NGC4088 is one of the brightest systems in the Ursa Major cluster with ongoing vigorous star formation. The system is strongly disturbed and in close vicinity of NGC4085. (vi) The NGC4111 and (vii) NGC4026 groups are also known to be interacting and discussed in more detail in Section 4.4.
Three of the high-probability candidates – namely NGC3917, Messier109 and NGC4157 – do not show any signs of interactions with their dwarf companions (Verheijen & Sancisi, 2001).
Verheijen & Sancisi (2001) find further interacting galaxy pairs: NGC3949 may be interacting with a small companion (SDSSJ115340.69+475156.4) and UGC06818 may be tidally interacting with a faint companion – these systems are not included in our sample of high-probability candidates for galaxy-galaxy interactions as they include interactions with dwarf companions. Note that we quote UGC06818 as a clear single detection in our catalogue – there are no galaxies listed in close vicinity of UGC06818 in NED/SDSS with know redshifts. Verheijen & Sancisi (2001) also find NGC3998 with disturbed H I content, which lies just outside the HIJASS data cubes at Dec. .
4.4 HIJASS detections with extended HI envelopes
We find two H I detections with extended H I envelopes that do not have previously catalogued galaxies within the H I extension.
Within the Ursa Major cluster lies the H I extension/plume in the NGC4026 group (see Figure 12), which has already been studied by Appleton (1983; Jodrell Bank), van Driel et al. (1988; WSRT) and Verheijen & Zwaan (2001; VLA D-array). Six galaxies are listed in NED with heliocentric velocities km s-1, four of which are included in the H I envelope (boxes) and two of which are in vicinity of the H I extensions (triangles; non-detection in HIJASS). The WSRT observations reveal an H I filament at and with a systemic velocity of km s-1 (van Driel et al., 1988). The H I filament measures approximately 38 kpc in size (which corresponds to 7.5 arcmin at the distance of 17.1 Mpc) and contains M⊙. Furthermore, van Driel et al. (1988) determine the H I mass of NGC4026 M⊙, UGC06956 M⊙, UGC06922 M⊙ and UGC06917 M⊙. We detect NGC4026, UGC06956 and the H I filament combined in HIJASS J1158+50 and we measure an H I mass of M⊙ – this matches the total H I mass measured by van Driel et al. (1988) within 1 per cent. Regarding UGC06922 and UGC06917, we measure an H I mass of M⊙ and M⊙, respectively. One may expect to measure a larger H I flux using a single dish telescope compared to van Driel et al. (1988) using WSRT. However, the H I content of UGC06922 is likely confused as UGC06956 lies in close vicinity.
High resolution observations of this system conducted with the VLA D-array (Verheijen & Zwaan, 2001) reveal an H I filament of 97 kpc in size (which corresponds to 18 arcmin and indicated by a cross in Figure 12). The origin of the H I filament is likely to be tidally stripped gas of NGC4026. Verheijen & Zwaan (2001) note that all three bright lenticular galaxies in the Ursa Major cluster including NGC4026 have disturbed H I.
Another intriguing H I extension in the Ursa Major cluster is seen in the NGC4111 system, which has already been studied by Verheijen & Zwaan (2001; VLA D-array). There are six previously catalogued galaxies as listed in NED within 20 arcmin angular separation and within 150 km s-1 of the central H I velocity (see Figure 12). NGC4111 is also one of the three brightest lenticular galaxies in the Ursa Major cluster with disturbed H I (Verheijen & Zwaan, 2001). The H I extends approximately 122 kpc (which corresponds to 28 arcmin at the distance of 15.0 Mpc; Tully et al. 2009 and indicated by a cross in Figure 12) south of the projected central position of NGC4111 (Verheijen & Zwaan, 2001). Furthermore, the disturbed H I connects NGC4111 with its close neighbouring galaxies NGC4117 and NGC4118.
The third of the brightest lenticular galaxy in the Ursa Major cluster with disturbed H I content according to Verheijen & Zwaan (2001) – NGC3998 – lies just outside the HIJASS data cubes at Dec. .
We do not find any H I detections with extended H I envelopes outside the Ursa Major cluster as defined by Tully et al. (1996).
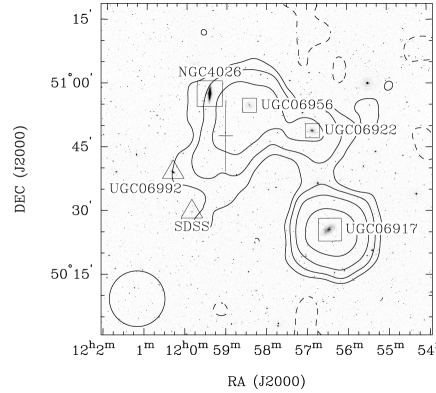
|
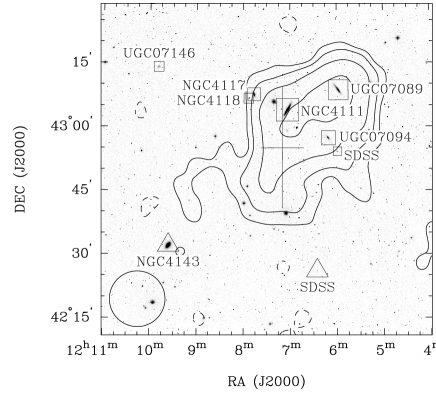
|
4.5 Comparison to large area blind HI surveys
Blind H I surveys have the potential for detecting previously uncatalogued galaxies and H I clouds. The two largest blind H I surveys to date are HIPASS (Staveley-Smith et al. 1996, Barnes et al. 2001, Koribalski et al. 2004, Meyer et al. 2004) and ALFALFA (Giovanelli et al. 2005, Haynes et al. 2011). While the HIPASS catalogues contain numerous sources without optical or infrared counterpart (e.g. in regions of high Galactic extinction), there is no evidence for any optically dark galaxies (Ryan-Weber et al. 2002, Koribalski et al. 2004). One of the most massive star-less H I clouds is HIPASS J0731-69 ( M⊙; Ryder et al. 2001). It is located near the asymmetric spiral galaxy NGC 2442 in the NGC 2434 group. A possible sceanrio for its origin is discussed in Bekki et al. (2005). Australia Telescope Compact Array (ATCA) observations by Ryder & Koribalski (2004) reveal several H I clumps that are probably embedded in a common envelope of diffuse H I. A group of H I clouds found around 400 km s-1, including HIPASS J1712–64 (Kilborn et al., 2000), HIPASS J1718–59 and HIPASS J1616–55 (Koribalski et al., 2004), are likely tidal debris related to the Magellanic Clouds and the Leading Arm. In areas of high stellar density and dust obscuration, it can be difficult to detect optical or infrared counterparts to H I-detected galaxies. Apart from the Galactic Plane, other sources — like the Magellanic Clouds – may hide the stellar component of galaxies. An example is HIPASS J0546-68 ( km s-1) behind the LMC (Ryan-Weber et al., 2002).
The ALFALFA 40 per cent survey has detected nearly 16,000 H I sources in the velocity range from to km s-1 (Haynes et al., 2011), among these are 1013 sources without assigned optical counterparts. Of the latter, 814 are at velocities from to km s-1, i.e. likely to be HVCs. The remaining are H I cloud candidates, with per cent located near galaxies of similar redshifts (e.g. Leo Ring, Stierwalt et al. 2009). About 50 candidates (0.3 per cent) for isolated H I clouds remain; these require follow-up optical and interferometric H I observations to identify their nature.
In our survey of the Ursa Major region we were able to confirm just one H I source without a definite optical counterpart (HIJASS J1219+46; km s-1). It is located near the peculiar galaxy NGC 4288 (HIJASS J1220+46; km s-1; also see Wilcots et al. 1996 and Kovač et al. 2009) in the Canes Venatici region. This H I source is discussed in more detail in Section 3.4. The nature of this H I source could be a dwarf companion or tidally stipped gas. H I imaging and deep optical follow-up will be required to determine the true nature.
5 Summary
The first blind H I survey of the Ursa Major region was conducted in 2001–2002 as part of HIJASS. The nearby Ursa Major region is within a velocity range from 300 to 1900 km s-1 and covers an area of 480 deg2. Using the automated source finder DUCHAMP we identify 166 H I sources in the data based on their peak flux density. The measured H I properties of the sources are presented in a comprehensive catalogue. We address the catalogue completeness and reliability – we find that the catalogue is 95 per cent complete above our peak flux density cut (33 mJy). The H I mass limit of the catalogue is M⊙ (assuming a velocity width of 100 km s-1 and a distance of 17.1 Mpc).
The catalogue includes 165 H I sources for which optical counterparts are identified using NED and SDSS. We find multiple counterparts within the gridded beam for 33 per cent of the H I detections, which are candidates for galaxy-galaxy interactions. There are 21 high-probability interacting systems – about half of these are within the Ursa Major cluster and have been studied by Verheijen & Sancisi (2001). It is remarkable that the Ursa Major cluster as defined by Tully et al. (1996) only comprises approximately 12 per cent of the surveyed volume discussed in this paper but contains about half of all high-probablility candidates for galaxy-galaxy interactions. We discuss four examples of interacting systems, two of which show intriguing extended H I content. The latter have been already been studied with higher resolution and revealed H I filaments and H I distortions of the bright lenticular galaxies.
The HIJASS data contain 10 H I sources that are newly detected in the 21-cm emission line. One of these does not have a visible associate optical counterpart and is likely to be a candidate galaxy/H I cloud. This previously uncatalogued H I source requires follow-up observations to investigate its nature.
Acknowledgments
We thank the HIJASS team for providing the data. HIJASS was funded by the UK PPARC (Grant No. PPA/G/S/1998/00620 to Cardiff). We also acknowledge the UK PPARC (Grant No. GR/K28237 to Jodrell Bank) that funded the multibeam receiving system at Jodrell Bank. We thank David Barnes and Mark Calabretta for their help with the fake source injection into the raw data. We thank Felix James ‘Jay’ Lockman for his help with the Green Bank Telescope follow-up observations from setting up, execution to the data reduction. We thank Emma Ryan-Weber, Glenn Kacprzak and the anonymous referee for useful comments. This research has made use of the NASA/IPAC Extragalactic Database, which is operated by the Jet Propulsion Laboratory, California Institute of Technology, under contract with the National Aeronautics and Space Administration. Digitized Sky Survey material is acknowledged, which was produced at the Space Telescope Science Institute under US Government grant NAG W-2166. This research has also made use of the Sloan Digital Sky Survey (SDSS). Funding for the SDSS and SDSS-II was provided by the Alfred P. Sloan Foundation, the Participating Institutions, the National Science Foundation, the U.S. Department of Energy, the National Aeronautics and Space Administration, the Japanese Monbukagakusho, the Max Planck Society, and the Higher Education Funding Council for England. The SDSS was managed by the Astrophysical Research Consortium for the Participating Institutions.
References
- Aihara et al. (2011) Aihara, H., Allende Prieto, C., An, D., et al. 2011, ApJS, 195, 26
- Allsopp (1979) Allsopp, N. J. 1979, MNRAS, 188, 765
- Andreon & Ettori (1999) Andreon, S., & Ettori, S. 1999, ApJ, 516, 647
- Appleton & Davies (1982) Appleton, P. N., & Davies, R. D. 1982, MNRAS, 201, 1073
- Auld et al. (2006) Auld, R., Minchin, R. F., Davies, J. I., et al. 2006, MNRAS, 371, 1617
- Barnes et al. (2001) Barnes, D. G., et al. 2001, MNRAS, 322, 486
- Becker et al. (1995) Becker, R. H., White, R. L., & Helfand, D. J. 1995, ApJ, 450, 559
- Bekki et al. (2005) Bekki, K., Koribalski, B. S., Ryder, S. D., & Couch, W. J. 2005, MNRAS, 357, L21
- Butcher & Oemler (1984) Butcher, H., & Oemler, A., Jr. 1984, ApJ, 285, 426
- Butcher & Oemler (1978) Butcher, H., & Oemler, A., Jr. 1978, ApJ, 219, 18
- Cappellari et al. (2011) Cappellari, M., Emsellem, E., Krajnović, D., et al. 2011, MNRAS, 416, 1680
- Chung et al. (2009) Chung, A., van Gorkom, J. H., Kenney, J. D. P., Crowl, H., & Vollmer, B. 2009, AJ, 138, 1741
- Colless et al. (2001) Colless, M., Dalton, G., Maddox, S., et al. 2001, MNRAS, 328, 1039
- De Propris et al. (2004) De Propris, R., Colless, M., Peacock, J. A., et al. 2004, MNRAS, 351, 125
- Disney (1976) Disney, M. J. 1976, Nature, 263, 573
- Dressler (1980) Dressler, A. 1980, ApJ, 236, 351
- English et al. (2010) English, J., Koribalski, B., Bland-Hawthorn, J., Freeman, K. C., & McCain, C. F. 2010, AJ, 139, 102
- Fairley et al. (2002) Fairley, B. W., Jones, L. R., Wake, D. A., et al. 2002, MNRAS, 330, 755
- Fouqué et al. (1990) Fouqué, P., Durand, N., Bottinelli, L., Gouguenheim, L., & Paturel, G. 1990, A&AS, 86, 473
- Gavazzi et al. (2005) Gavazzi, G., Boselli, A., van Driel, W., & O’Neil, K. 2005, A&A, 429, 439
- Giovanelli & Haynes (1985) Giovanelli, R., & Haynes, M. P. 1985, ApJ, 292, 404
- Giovanelli et al. (2005) Giovanelli, R., et al. 2005, AJ, 130, 2598
- Gómez et al. (2003) Gómez, P. L., Nichol, R. C., Miller, C. J., et al. 2003, ApJ, 584, 210
- Haynes et al. (2011) Haynes, M. P., Giovanelli, R., Martin, A. M., et al. 2011, AJ, 142, 170
- Hoffman et al. (1996) Hoffman, G. L., Salpeter, E. E., Farhat, B., et al. 1996, ApJS, 105, 269
- Kilborn et al. (2000) Kilborn, V. A., Staveley-Smith, L., Marquarding, M., et al. 2000, AJ, 120, 1342
- Kilborn et al. (2005) Kilborn, V. A., Koribalski, B. S., Forbes, D. A., Barnes, D. G., & Musgrave, R. C. 2005, MNRAS, 356, 77
- Kilborn et al. (2006) Kilborn, V. A., Forbes, D. A., Koribalski, B. S., Brough, S., & Kern, K. 2006, MNRAS, 371, 739
- Kilborn et al. (2009) Kilborn, V. A., Forbes, D. A., Barnes, D. G., Koribalski, B. S., Brough, S., & Kern, K. 2009, MNRAS, 400, 1962
- Koribalski (2001) Koribalski, B. S. 2001, Gas and Galaxy Evolution, 240, 439
- Koribalski & López-Sánchez (2009) Koribalski, B. S., & López-Sánchez, Á. R. 2009, MNRAS, 400, 1749
- Koribalski & Manthey (2005) Koribalski, B., & Manthey, E. 2005, MNRAS, 358, 202
-
Koribalski & Staveley-Smith (2009)
Koribalski, B. S., & Staveley-Smith, L. 2009, ASKAP Science Proposal
http://www.atnf.csiro.au/research/WALLABY/proposal.html - Koribalski et al. (2004) Koribalski, B. S., et al. 2004, AJ, 128, 16
- Kovač et al. (2009) Kovač, K., Oosterloo, T. A., & van der Hulst, J. M. 2009, MNRAS, 400, 743
- Lang et al. (2003) Lang, R. H., et al. 2003, MNRAS, 342, 738
- Lewis et al. (2002) Lewis, I., Balogh, M., De Propris, R., et al. 2002, MNRAS, 334, 673
- Margoniner et al. (2001) Margoniner, V. E., de Carvalho, R. R., Gal, R. R., & Djorgovski, S. G. 2001, ApJ, 548, L143
-
McIntyre (2003)
McIntyre, V., Star formation and internal kinematics of irregular galaxies, PhD thesis, Department of Engineering Physics, University of Wollongong, 2003.
http://ro.uow.edu.au/theses/356 - Mei et al. (2007) Mei, S., Blakeslee, J. P., Côté, P., et al. 2007, ApJ, 655, 144
- Metevier et al. (2000) Metevier, A. J., Romer, A. K., & Ulmer, M. P. 2000, AJ, 119, 1090
- Meurer et al. (2006) Meurer, G. R., Hanish, D. J., Ferguson, H. C., et al. 2006, ApJS, 165, 307
- Meyer et al. (2004) Meyer, M. J., et al. 2004, MNRAS, 350, 1195
- Minchin et al. (2003) Minchin, R. F., Disney, M. J., Boyce, P. J., et al. 2003, MNRAS, 346, 787
- Morganti et al. (2006) Morganti, R., de Zeeuw, P. T., Oosterloo, T. A., et al. 2006, MNRAS, 371, 157
- Omar & Dwarakanath (2005) Omar, A., & Dwarakanath, K. S. 2005, Journal of Astrophysics and Astronomy, 26, 1
- Oosterloo & van Gorkom (2005) Oosterloo, T., & van Gorkom, J. 2005, A&A, 437, L19
- Rosenberg & Schneider (2000) Rosenberg, J. L., & Schneider, S. E. 2000, ApJS, 130, 177
- Ryan-Weber et al. (2002) Ryan-Weber, E., Koribalski, B. S., Staveley-Smith, L., et al. 2002, AJ, 124, 1954
- Ryder & Koribalski (2004) Ryder, S. D., & Koribalski, B. S. 2004, Recycling Intergalactic and Interstellar Matter, 217, 44
- Ryder et al. (2001) Ryder, S. D., et al. 2001, ApJ, 555, 232
- Sault et al. (1995) Sault, R. J., Teuben, P. J., & Wright, M. C. H. 1995, Astronomical Data Analysis Software and Systems IV, 77, 433
- Schombert et al. (1992) Schombert, J. M., Bothun, G. D., Schneider, S. E., & McGaugh, S. S. 1992, AJ, 103, 1107
- Simon & Geha (2007) Simon, J. D., & Geha, M. 2007, ApJ, 670, 313
- Solanes et al. (2001) Solanes, J. M., Manrique, A., García-Gómez, C., et al. 2001, ApJ, 548, 97
- Springel et al. (2005) Springel, V., White, S. D. M., Jenkins, A., et al. 2005, Nature, 435, 629
- Springob et al. (2005) Springob, C. M., Haynes, M. P., & Giovanelli, R. 2005, ApJ, 621, 215
- Staveley-Smith et al. (1996) Staveley-Smith, L., et al. 1996, PASA, 13, 243
- Stierwalt et al. (2009) Stierwalt, S., Haynes, M. P., Giovanelli, R., et al. 2009, AJ, 138, 338
- Taylor & Webster (2005) Taylor, E. N., & Webster, R. L. 2005, ApJ, 634, 1067
- Toribio et al. (2011) Toribio, M. C., Solanes, J. M., Giovanelli, R., Haynes, M. P., & Martin, A. M. 2011, ApJ, 732, 93
- Trentham et al. (2001) Trentham, N., Tully, R. B., & Verheijen, M. A. W. 2001, MNRAS, 325, 385
- Tully (1987) Tully, R. B. 1987, ApJ, 321, 280
- Tully et al. (1996) Tully, R. B., Verheijen, M. A. W., Pierce, M. J., Huang, J.-S., & Wainscoat, R. J. 1996, AJ, 112, 2471
- Tully et al. (2008) Tully, R. B., Shaya, E. J., Karachentsev, I. D., et al. 2008, ApJ, 686, 1523
- Tully et al. (2009) Tully, R. B., Rizzi, L., Shaya, E. J., et al. 2009, AJ, 138, 323
- van Driel et al. (1988) van Driel, W., et al. 1988, A&A, 199, 41
- Verheijen & Sancisi (2001) Verheijen, M. A. W., & Sancisi, R. 2001, A&A, 370, 765
- Verheijen & Zwaan (2001) Verheijen, M. A. W., & Zwaan, M. 2001, Gas and Galaxy Evolution, 240, 867
- Westmeier et al. (2011) Westmeier, T., Popping, A., & Serra, P. 2011, arXiv:1112.3093
- White & Rees (1978) White, S. D. M., & Rees, M. J. 1978, MNRAS, 183, 341
-
Whiting (2012)
Whiting, M. 2012, MNRAS, in press (arXiv:1201.2710v1)
http://www.atnf.csiro.au/people/Matthew.Whiting/Duchamp - Wilcots et al. (1996) Wilcots, E. M., Lehman, C., & Miller, B. 1996, AJ, 111, 1575
- Wong et al. (2006) Wong, O. I., et al. 2006, MNRAS, 371, 1855
- Wong et al. (2009) Wong, O. I., Webster, R. L., Kilborn, V. A., Waugh, M., & Staveley-Smith, L. 2009, MNRAS, 399, 2264
- Yahil et al. (1977) Yahil, A., Tammann, G. A., & Sandage, A. 1977, ApJ, 217, 903
- Zwaan et al. (1997) Zwaan, M. A., Briggs, F. H., Sprayberry, D., & Sorar, E. 1997, ApJ, 490, 173
- Zwaan et al. (1999) Zwaan, M. A., Verheijen, M. A. W., & Briggs, F. H. 1999, PASA, 16, 100
- Zwaan et al. (2004) Zwaan, M. A., et al. 2004, MNRAS, 350, 1210