Ab initio prediction of equilibrium boron isotope fractionation between minerals and aqueous fluids at high and
Abstract
Over the last decade experimental studies have shown a large B isotope fractionation between materials carrying boron incorporated in trigonally and tetrahedrally coordinated sites, but the mechanisms responsible for producing the observed isotopic signatures are poorly known. In order to understand the boron isotope fractionation processes and to obtain a better interpretation of the experimental data and isotopic signatures observed in natural samples, we use first principles calculations based on density functional theory in conjunction with ab initio molecular dynamics and a new pseudofrequency analysis method to investigate the B isotope fractionation between B-bearing minerals (such as tourmaline and micas) and aqueous fluids containing and species. We confirm the experimental finding that the isotope fractionation is mainly driven by the coordination of the fractionating boron atoms and have found in addition that the strength of the produced isotopic signature is strongly correlated with the B-O bond length. We also demonstrate the ability of our computational scheme to predict the isotopic signatures of fluids at extreme pressures by showing the consistency of computed pressure-dependent factors with the measured pressure shifts of the B-O vibrational frequencies of and in aqueous fluid. The comparison of the predicted with measured fractionation factors between boromuscovite and neutral fluid confirms the existence of the admixture of tetrahedral boron species in neutral fluid at high and found experimentally, which also explains the inconsistency between the various measurements on the tourmaline-mica system reported in the literature. Our investigation shows that the calculated equilibrium isotope fractionation factors have an accuracy comparable to the experiments and give unique and valuable insight into the processes governing the isotope fractionation mechanisms on the atomic scale.
keywords:
stable isotope fractionation , boron , fluid speciation , DFT , molecular dynamicsiinit
1 Introduction
The use of isotopes as geochemical tracers depends upon the existence of reliable -dependent equilibrium isotope fractionation data between solids, fluids and melts. The common method used for determination of such data is to conduct experiments, where the phases of interest are equilibrated at a range of different conditions and individually measured for their equilibrium isotopic compositions. Recently, with the development of computational methods, software and increase in hardware performance it is also possible to simulate and compute the isotope fractionation with ab initio methods. These computational considerations complement the experimental effort and provide information on the mechanisms governing the equilibrium isotope fractionation processes on the atomic scale. By establishing an efficient computational approach for materials at high and and testing its reliability by computing Li isotope fractionation between minerals and aqueous fluids, Kowalski & Jahn, (2011) have shown that ab initio methods can provide a reliable estimation of equilibrium isotope fractionation factors at an accuracy level comparable to experiments. Motivated by the encouraging results for the fractionation of lithium isotopes we applied our new method to study boron isotope fractionation. The main goals of the present study are to make theoretical predictions and obtain a better understanding of the B isotope fractionation process between tourmaline, B-bearing mica and fluids at various pressures and temperatures, to compare these data to results from recent in situ experimental studies (Wunder et al.,, 2005; Meyer et al.,, 2008) and measurements of isotopic signatures in natural samples (Klemme et al.,, 2011; Marschall,, 2005; Hervig et al.,, 2002) and to investigate the underlying mechanisms driving the boron isotope fractionation processes between the considered materials.
With two stable isotopes 10B and 11B, of relatively large mass difference of about , boron isotopes strongly fractionate during geological processes, thus leading to natural -variations ranging from to (Barth,, 1993). Therefore, B isotopes are ideal for the distinction of different geological environments and for quantifying mass transfer processes, e.g. in the range of subduction zones. First-order criteria driving isotope fractionation in Earth materials are differences in coordination and in the bonding environments of coexisting phases. The lighter isotope usually preferentially occupies the higher coordinated site, which is generally accompanied with a longer cation-anion bond length and weaker bond strength (Schauble et al.,, 2009; Wunder et al.,, 2011).
Tourmaline has an extensive chemical variability and is the most widespread borosilicate in various rocks over a large range of bulk compositions. It has a large -stability which ranges from surface conditions to high pressures and temperatures of at least 7.0 GPa and about as determined experimentally for dravitic tourmaline (Krosse,, 1995). Most tourmaline minerals contain 3 boron atoms per formula unit (pfu) with B in trigonal planar coordination (B[3]). High pressure combined with an Al-rich environment can lead to the formation of olenitic tourmaline with significant amounts of excess B substituting for Si at the tetrahedral site (B[4]). The highest amounts of up to 1.2 B[4] pfu have been found in olenitic tourmaline from Koralpe, Austria (Ertl et al.,, 1997). Al-rich tourmaline with up to 2.2 B[4] pfu was synthesized experimentally at , 600oC (Schreyer et al.,, 2000). The maximum possible amount of B[4] in olenitic tourmaline is limited to three B[4] pfu, due to structural and crystal chemical reasons.
As tourmaline is not stable at basic pH (Morgan & London,, 1989), the dominant B-species of fluids coexisting with tourmaline is . Therefore, due to the absence of change in boron coordination, B-isotopic fractionation between B[4]-free tourmaline and fluid ((tour-fl)) should be small. However, at , the experimentally determined (tour-fl)-values of at 400 and at 700 (Meyer et al.,, 2008) suggest small but significant differences in the B-O(H) bond strength between tourmaline and the neutral fluids. Incorporation of into tourmaline is expected to significantly increase the fractionation of boron isotopes between the mineral and aqueous fluid (i.e. increase of (tour-fl)). In this contribution we present calculated -dependent data on B-isotope fractionation between B[4]-bearing tourmaline and fluid, which so far are not available from experiments.
Despite of its low boron content of up to maximum values of (Domanik et al.,, 1993), potassic white mica is probably the main host of boron in metasedimentary and metabasaltic blueschists and eclogites, because of its high modal abundance and B-incompatibility in all other stable minerals of these rocks (Brenan et al.,, 1998). During subduction the modal amount of mica continuously decreases by dehydration reactions and the chemistry of residual micas is shifted towards phengitic compositions. Phengitic mica has an extended stability, extending as deep as within cold subduction zones (Schmidt,, 1996). In contrast to most tourmalines, boron is tetrahedrally coordinated in mica, where it substitutes for aluminum. Due to the coordination change from mostly three-fold coordinated in near-neutral fluids (Schmidt et al.,, 2005) to B[4] in mica, B-isotopic fractionation between B-bearing mica and such fluids is much larger than for tourmaline – fluid. (mica-fl)-values determined experimentally at , are at 500 and at 700 (Wunder et al.,, 2005). Such a strong B-isotope fractionation and its pronounced -dependence, in combination with the continuous dehydration of micas during ongoing subduction and boron transport via fluids into mantle wedge regions of arc magma-formation, probably determines the boron variations and B-isotopic signatures in volcanic arcs (Wunder et al.,, 2005).
Using in situ Raman spectroscopic measurements of near-neutral B-bearing fluids, Schmidt et al., (2005) observed a significant amount of 4-fold B-species at high and . The abundance of these species increases with temperature and pressure and at and there should be a considerable amount () of species in the fluid. Such a significant amount of tetrahedrally coordinated B-species in high temperature and pressure fluids should affect solid–fluid B-isotopic fractionation, which we investigate in our calculations. In the light of this, we also discuss recently determined B-isotope data from coexisting natural tourmaline and B-bearing mica (Klemme et al.,, 2011; Marschall,, 2005; Hervig et al.,, 2002), which show slight inconsistency with in situ measurements of Wunder et al., (2005) and Meyer et al., (2008).
Reliable ab initio computational methods to predict isotope fractionation factors have been established recently. Several groups have proved that such calculations can contribute towards understanding geochemical mechanisms responsible for production of isotope signatures (Driesner,, 1997; Yamaji et al.,, 2001; Schauble,, 2004; Domagal-Goldman et al.,, 2008; Hill & Schauble,, 2008; Meheut et al.,, 2009, 2007; Schauble et al.,, 2009; Zeebe,, 2009; Hill et al.,, 2010; Rustad et al., 2010a, ; Rustad et al, 2010b, ; Zeebe,, 2009, 2010; Kowalski & Jahn,, 2011). The majority of these works, however, concentrate on the computation of the stable isotope fractionation between various, mostly simple crystalline minerals, and the aqueous solutions are usually computed using an isolated cluster containing fractionating species and a hydration shell (e.g. Zeebe, (2010, 2009); Hill et al., (2010); Rustad et al., 2010a ; Domagal-Goldman et al., (2008); Hill & Schauble, (2008); Rustad et al, 2010b ; Zeebe, (2005)). However, aqueous solutions at high pressure and temperature must be computed with caution as discussed in Kowalski & Jahn, (2011). This is because the distribution of cation coordination and cation-oxygen bond lengths that affect the isotope fractionation (Bigeleisen & Mayer,, 1947) is driven by the dynamics of the system and change under compression (Jahn & Wunder,, 2009; Wunder et al.,, 2011; Kowalski & Jahn,, 2011). The only recent ab initio work, besides Kowalski & Jahn, (2011), that accounts for the dynamical effects on the isotope fractionation in fluid is by Rustad & Bylaska, (2007) who considered boron equilibrium isotope fractionation between and species in aqueous solution. They performed ab initio molecular dynamics simulations of these fluids and attempted to use the vibrational density of states, derived through the Fourier transform of the velocity auto-correlation function, as an input for the calculation of the 11B/10B isotope fractionation coefficient. However, the resulting fractionation factor happened to be much lower than the experimental value of . Interestingly, the discrepancy between experiment and theory is cured by quenching the selected configurations along the molecular dynamics trajectory and computing the harmonic frequencies. The fractionation factor derived using these frequencies exactly reproduces the experimental value.
In our approach both solids and fluids are treated as extended systems by application of periodic boundary conditions in all three spatial directions, which is crucial to model high pressure materials. Large enough supercells are chosen to avoid significant interaction between atoms and their periodic images, as well as to reduce the number of k-points and q-vectors for sampling the Brillouin zones and the phonon spectra of the crystals, respectively (for a liquid or fluid, both the Brillouin zone and phonons are not defined). In our investigation we use cells of at least width in each spatial dimension. A representative statistical sampling of the fluid structure is obtained by performing Car-Parrinello molecular dynamics simulations (Car & Parrinello,, 1985). For the calculation of the isotope fractionation factors in fluids, several random snapshots from the simulation runs are chosen. The force constants acting on the fractionating element and the resulting fractionation factors are then obtained for each ionic configuration, and the relevant fractionation factor for the boron species in the fluid is computed as an average over the whole set of considered geometries. In Kowalski & Jahn, (2011) it was shown that in line with the Bigeleisen & Mayer, (1947) approximation, considering the force constants acting on the fractionating atom only leads to a satisfactory estimation of the Li isotope fractionation factors for high temperature fluids and minerals. Here, we will show that approximating the vibrational spectrum by the three pseudofrequencies derived from the force constants allows for further improvement of the accuracy of the predicted isotope fractionation factors, especially at lower temperatures.
In this contribution we present the theoretical prediction of B isotope fractionation factors between B bearing aqueous fluids and solids, specifically tourmaline and B-muscovite, for which experimental data and measurements on natural samples are available for comparison (Wunder et al.,, 2005; Meyer et al.,, 2008; Klemme et al.,, 2011). We will show that the application of ab initio methods to B-bearing crystalline solids and fluids not only provides unique insight into the mechanisms driving equilibrium B-isotope fractionation on the atomic scale, but helps in proper interpretation of the data.
| method | ||||||
|---|---|---|---|---|---|---|
| theoretical: | ||||||
| BLYP (this work) | 656/680 | 1366/1408 | 793/807 | 870/886 | 1051/1063 | 1132/1154 |
| BLYP 1 | 642/667 | 1390/1437 | 807/821 | 916/947 | 1020/1025 | 1156/1179 |
| HF/6-31G∗ 2 | 736/764 | 1562/1615 | ||||
| HF/aug-cc-pVDZ∗ 3 | -/754 | -/1531 | ||||
| BP86/aug-cc-pVDZ∗ 3 | -/655 | -/1412 | ||||
| B3LYP/aug-cc-pVDZ∗ 3 | -/684 | -/1447 | ||||
| MP2/aug-cc-pVDZ∗ 3 | -/684 | -/1435 | ||||
| CCSD(T)/aug-cc-pVDZ∗ 3 | -/684 | -/1438 | ||||
| experimental: | ||||||
| solution 4 | 632/666 | 1412/1454 | 937/975 | |||
| vapour 5 | 674/700 | 1429/1477 | ||||
| solution 6 | 639/668 | 1428/1490 | 947/- | |||
| vapour 7 | 666/692 | 1415/1472 | ||||
| vapour 8 | 675/701 | 1426/1478 | ||||
| solution and vapour 9 | 639-675/- | 1421-1450/- | 935-958/- |
| T (K) | meth. (1) | meth. (2) | meth. (3) | meth. (1) | meth. (2) | meth. (3) | ||
|---|---|---|---|---|---|---|---|---|
| 300 | 211.3 | 283.1 | 225.1 | 20.5 | 167.3 | 203.4 | 175.2 | 13.9 |
| 600 | 64.1 | 70.8 | 65.6 | 7.3 | 48.1 | 50.9 | 48.6 | 4.5 |
| 800 | 37.6 | 39.8 | 38.1 | 4.3 | 27.8 | 28.6 | 27.9 | 2.5 |
| 1000 | 24.6 | 25.4 | 24.7 | 2.8 | 18.0 | 18.3 | 18.0 | 1.7 |
| Dravite | Boromuscovite 1M | |||||||
| 300 | 202.8 | 267.7 | 216.0 | 19.3 | 139.1 | 160.8 | 142.2 | 11.6 |
| 600 | 60.7 | 66.9 | 62.4 | 6.7 | 38.6 | 40.2 | 38.8 | 3.5 |
| 800 | 35.5 | 37.6 | 36.1 | 4.0 | 22.1 | 22.6 | 22.2 | 1.8 |
| 1000 | 23.2 | 24.1 | 23.5 | 2.5 | 14.3 | 14.5 | 14.3 | 1.4 |
2 Computational approach
2.1 Theoretical model
2.1.1 The single atom approximation: Bigeleisen & Mayer, (1947) approach
Mass-dependent equilibrium isotope fractionation is driven by the change in molecular and crystalline vibration frequencies resulting from the different masses of the isotopes. The fractionation between species and an ideal monoatomic gas is called the factor. In the harmonic approximation it is given by the formula (Bigeleisen & Mayer,, 1947; Urey,, 1947; Chacko et al.,, 2001):
| (1) |
where , is the Planck constant, is the vibrational frequency of the -th degree of freedom, is the Boltzmann constant, is the number of degrees of freedom, which for being the number of atoms in the considered system (molecule, mineral or fluid) is equal to for a diatomic molecule, for multiatomic molecules and for crystals, and a star symbol marks the heavier isotope. The fractionation factor between two substances A and B, is computed as the ratio of the relevant factors, which is well approximated by the differences in the factors:
| (2) |
The calculation of the factor requires only knowledge of the vibrational properties of the considered system computed for the two different isotopes. However, computation of the whole vibrational spectra of complex, multiparticle minerals or fluids requires substantial computational resources and is currently limited to systems containing a few dozens of atoms or less. In our recent work (Kowalski & Jahn,, 2011) we proposed to use an efficient method for computing the high temperature isotope fractionation factors between complex materials such as fluids and crystalline solids, which requires the knowledge of the force constants acting upon the fractionating element only. The factor (Eq. 1) can be then approximated by (Bigeleisen & Mayer,, 1947; Kowalski & Jahn,, 2011):
| (3) |
where are the force constants acting on the isotopic atom in the three perpendicular spatial directions (x, y and z), , where and are the masses of the lighter and heavier isotopes of the fractionating element. As the computation of the factors from formula 3 requires the knowledge of properties of the fractionating element only we will call such an approach the single atom approximation throughout the paper. The validity criteria restricts the usage of the formula to frequencies (assuming , see Fig. 1 of Bigeleisen & Mayer, (1947)). We are interested in temperature range -. The highest vibrational frequency of the modes involving movement of B atoms for is and of is (Table 1). In case of , the single atom approximation may produce an error of in the factor at . The relevant error for is (Table 2). A further improvement to the method is therefore desired.
2.1.2 The single atom approximation with pseudofrequencies: our improvement
We will show that the error of the single atom approximation can be substantially reduced if one uses the three frequencies derived from the force constants acting on the fractionating element (). We call them “pseudofrequencies”, and compute the factors using formula 1. In the following we present the formal justification of such an approach. According to Bigeleisen & Mayer, (1947), equation 1 for small reduces to (Bigeleisen & Mayer, (1947), Eq. 11a):
| (4) |
The Taylor expansion of the function appearing under the summation sign is:
| (5) |
When we consider just the first term of the expansion the factor is:
| (6) |
which is exactly equation 3.
| species | |||
|---|---|---|---|
| 644/675 | 1129/1184 | 1130/1185 | |
| dravite | 618/648 | 1085/1138 | 1120/1174 |
| 809/848 | 845/886 | 872/915 | |
| boromuscovite 1M | 722/757 | 723/758 | 801/840 |
| boromuscovite 1M1 | boromuscovite 2M11 | dravite2 | olenite3 | |
| a (Å) | 10.204 | 10.180 | 15.945 | 15.5996 |
| b (Å) | 8.788 | 8.822 | 15.945 | 15.5996 |
| c (Å) | 10.076 | 19.8189 | 7.210 | 7.0224 |
| (∘) | 90 | 90 | 90 | 90 |
| (∘) | 101.23 | 95.62 | 90 | 90 |
| (∘) | 90 | 90 | 90 | 120 |
| 84 | 168 | 163 | 162 |
Let us consider the Taylor expansion of the different estimations of factors. Equation 4 then reads:
| (7) |
The Bigeleisen & Mayer, (1947) approximation given by equation 3 reads:
| (8) |
and the proposed approximation based on pseudofrequencies is:
| (9) |
In the above equation . Next we check how this approximation compares to the Bigeleisen & Mayer, (1947) approximation given by equations 3 and 8. In order to make a comparison we derive the differences between the two approximate expressions , and the exact one (Eq. 7). In the case of the Bigeleisen & Mayer, (1947) approximation we have:
| (10) |
and having from equations 3 and 8 that
| (11) |
in the case of the proposed approximation we get:
| (12) |
Because relation holds for any (see Bigeleisen & Mayer, (1947), Fig. 1), the function
| (13) |
and . On the other hand the expression for is given by a difference of the higher order terms of the Taylor expansions of the two expressions for the factor. In the considered cases the values of pseudofrequencies are similar to the real frequencies that are affected upon B isotope substitution in a given B-bearing system. This can be seen by comparing the pseudofrequencies computed for the selected cases of B-bearing molecules and crystalline solids considered here and reported in Table 3 with the real frequencies given in Table 1. This indicates that the two terms of opposite signs in Eq. 12 should be similar in value and cancel out to a great extent, so . Therefore the approach proposed here to compute the factor based on pseudofrequencies and Eq. 1 should give a better approximation to the exact factors than equation 3, which we will show in section 3.1. The difference to the Bigeleisen & Mayer, (1947) approximation is given by:
| (14) |
and can be easily computed for any considered system. We assume that the pseudofrequency-based approach to the computation of factors is applicable if it is just a correction to equation 3, i.e. when:
| (15) |
We also note that the proposed approach satisfies the Redlich-Teller product rule (Redlich,, 1935) when the mass of considered isotope is much smaller than the mass of the whole considered system , namely,
| (16) |
We notice that we could force the strict conservation of the Redlich-Teller product by just adjusting the ratios of . However, such a modification would not preserve relation 11 and the pseudofrequency approach would not recover exactly the high temperature limit (Eq. 3) of the exact solution (Eq. 1), which is a more important constraint to fulfill strictly by the proposed approximation.
2.2 Representation of solids
In this paper we investigate the boron isotope fractionation between dravite, olenite and boromuscovite minerals and aqueous fluids. The solids were represented by large cells containing at least 84 atoms. The number of atoms used in the crystal calculations together with the lattice parameters of modeled crystals are summarized in Table 4. The lattice parameters and chemical compositions of the modeled crystalline solids are the experimental values measured at ambient conditions found in the literature. Dravite is the crystalline solid which was used in the experiments on tourmaline by Meyer et al., (2008). The chemical composition of the supercell used in the investigation is with structural data of Marler et al., (2002). Olenite can contain B in both trigonal and tetragonal sites. The modeled structure is that of Ertl et al., (2010). The chemical composition of the unit cell used in the investigation is . For boromuscovite, the 1M and 2M1 crystal structures of Liang et al., (1995) were used. In the isotope fractionation experiments of Wunder et al., (2005) boromuscovite forms two polytypes, 1M and 2M1, with relative abundances of and respectively. In boromuscovite B occupies the 4-fold coordinated site occupied mainly by Si atoms. The constructed model constitutes a 2x1x1 supercell of elementary chemical composition .
2.3 Representation of aqueous solution
The aqueous solution was represented by a periodically repeated box containing up to 64 water molecules and one or molecule. The pressure and temperature conditions were chosen to be close to the experimental conditions of Wunder et al., (2005) and Meyer et al., (2008). The pressure of the aqueous solution for a given temperature and volume was calculated according to the equation of state of Wagner & Pruss, (2002). The ab initio molecular dynamics simulations (AIMD) of aqueous fluids were performed for fixed temperature and volume using the Car-Parrinello scheme (Car & Parrinello,, 1985). The temperature during each run was controlled by a Nosé–Hoover chain thermostat (Nosé & Klein,, 1983; Hoover,, 1985). For each conditions at least long trajectories were generated with an integration step of .
2.4 Computational technique
The calculations of pseudofrequencies and factors for solids and aqueous solutions were performed by applying density functional theory (DFT) methods, which are currently the most efficient methods allowing for treating extended many particle systems quantum-mechanically. We used the planewave DFT code CPMD (Marx & Hutter,, 2000), which is especially suited for ab initio simulations of fluids, the BLYP exchange-correlation functional (Becke,, 1988; Lee et al.,, 1988) and norm-conserving Goedecker pseudopotentials for the description of the core electrons (Goedecker et al.,, 1996). One advantage of using the BLYP functional is that it usually gives harmonic frequencies that most closely resemble the observed frequencies of benchmark chemical systems (Finley & Stephens,, 1995; Alecu et al.,, 2010) 111If the computed harmonic frequencies are closer to the observed, anharmonic frequencies than to the real harmonic frequencies of the computed system the resulted fractionation factor (Eq. 1) computed from these frequencies should be closer to the real fractionation factor than the computed on a set of accurate harmonic frequencies.. The energy cut-off for the plane wave basis set was for geometry relaxations and molecular dynamics simulations and for computation of vibrational frequencies. Periodic boundary conditions were applied for both crystalline solids and aqueous solutions to preserve the continuity of the media.
| 6-31+G(d) | 216.6 | 174.4 | 1.0359 | 35.3 |
|---|---|---|---|---|
| 6-311+G(d,p) | 215.0 | 170.5 | 1.0380 | 37.3 |
| our work | 211.3 | 167.3 | 1.0377 | 37.0 |
The force constants and frequencies needed for the computation of the factors were computed using the finite displacement scheme. Before performing the calculations of the crystal structures all atomic positions were relaxed to the equilibrium positions to minimize the forces acting on the atoms. We note that to compute the factors for crystals one formally should account for phonon dispersion. Here we use large supercells and restrict our calculations to a single phonon wave-vector (). Schauble, (2011) has shown recently for fractionation in Mg-bearing minerals that supercells containing more than 20 atoms are sufficient to get very accurate factors even at (error of 0.1‰). At the error is in the order of 0.01‰. The accuracy of the high temperature isotope fractionation factors computed on a single phonon wave-vector is also demonstrated for iron-bearing minerals by Blanchard et al., (2009) and confirmed with good agreement of the predicted with the measured Li isotope fractionation factors between staurolite, spodumene, micas and aqueous fluid presented in our previous work (Kowalski & Jahn,, 2011).
Prior to the computation of the force constants and frequencies of boron atoms in the fluids the positions of all the atoms constituting the boron-carrying molecule ( or ) were relaxed to the equilibrium positions, while all other atomic positions remained unchanged. The full normal mode analyzes were performed using the same method, but displacing all the atoms constituting the considered system. In the latter case the frequencies were obtained through the diagonalization of the full dynamical matrix (Schauble,, 2004) as implemented in CPMD code. The effect of the various approximations on the derived fractionation factors was studied by additional computations of and isolated clusters. For that purpose we used a large, isolated simulation box with a cell length of , forcing the charge density to be zero at the boundary, as implemented in CPMD code. In order to compute the factors of boron species in the aqueous fluid we apply the same method as in our recent work on Li isotopes (Kowalski & Jahn,, 2011), with the exception that we use the pseudofrequencies, i.e. the frequencies obtained from the three force constants acting on the fractionating element, and formula 1 for calculation of factors, as discussed in section 2.1.2. In order to fully account for the spatial continuity of the fluid and its dynamical motion we produced long molecular dynamics trajectories of systems consisting of 64 H2O molecules and one or molecule for different , and and pressure of , which closely resembles the experimental conditions of Wunder et al., (2005) and Meyer et al., (2008). The corresponding simulation box length is at . The factors were computed on the ionic configuration snapshots extracted uniformly in intervals along the molecular dynamics trajectories.
2.5 Error estimation technique
The errors in the computed value of the and fractionation factors were estimated from an average error of vibrational frequencies computed using the chosen DFT method. Finley & Stephens, (1995), Menconi & Tozer, (2002) and Alecu et al., (2010) estimated the errors made in calculations of vibrational frequencies of small molecules using different DFT functionals. According to these works the BLYP functional systematically overestimates the harmonic frequencies by , with a deviation from the mean offset of . Therefore, we expect that using BLYP functional the and values are systematically overestimated by and that in addition there is a error in derived factors. Similar errors result from using other functionals or even more sophisticated and time consuming post-Hartree-Fock methods such as MP2 (Finley & Stephens,, 1995; Alecu et al.,, 2010).
3 Results and discussion
3.1 Test of the computational method
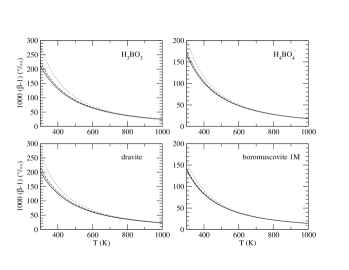
First, we illustrate the performance of the approximation proposed in section 2.1.2 by computing the factors for the isolated and molecules and selected crystalline solids. In Figure 1 we present three sets of calculations of factors: (1) the “exact” result obtained from a full normal mode analysis and formula 1, (2) the results obtained applying Kowalski & Jahn, (2011) method based on Eq. 3, (3) the results obtained using pseudofrequencies computed for the fractionating element and Eq. 1 for the estimation of the factor. The numerical values for selected temperatures are reported in Table 2. Approach (3) results in much better agreement with the “exact” result. For , the factor is overestimated by only and for temperatures of and respectively. Applying method (2), the error is more pronounced, and respectively. In the case of molecular , the errors using method (3) for the same temperatures are only and respectively. The same behavior is shown for dravite and boromuscovite crystalline solids that contain boron in the coordinative arrangement that resemble the configurations of aforementioned B-bearing molecules. For the proposed method represents only a few percent correction to the approximation given by equation (3), so the relation (15) is satisfied. It is evident that for B-bearing materials considered here the improvement made by using the pseudofrequencies based approach is substantial. It corrects for about 75 of error of the Bigeleisen & Mayer, (1947) approximation (Eq. 3). However, the question of general applicability of the proposed method to other isotopic systems would require careful testing on a large set of materials, which is well beyond the scope of the current paper.
3.2 B isotope fractionation in gas and fluid phases
3.2.1 B isotope fractionation between and in the gas phase
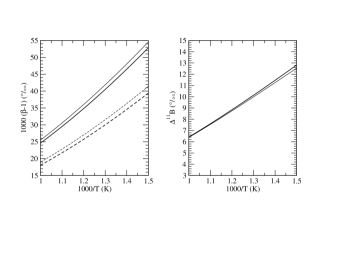
In a first step of our investigation of boron-rich aqueous fluids we derived the full frequency spectra of molecules in the gas phase (isolated molecules). The relevant factors were computed using Equation 1. These studies were performed in order to compare our results with the published values of Zeebe, (2005), both computed using the same DFT BLYP functional. In Table 1 we report the computed frequencies that are affected by the different B isotope substitutions along with other theoretical estimations and experimental measurements. The computed frequencies are in good agreement with earlier theoretical predictions and show similar agreement with the experimental measurements. The results in terms of computed factors for the two considered species are reported in Figure 2, where we compare our results with the values computed using frequencies of Zeebe, (2005). The comparison of the two sets of calculations reveals that our factors for both species are smaller by at than the values of Zeebe, (2005). However, the difference between factors of and remains nearly identical in both sets of calculations and the agreement is nearly perfect for higher temperatures. We note, that for the comparison we used the frequencies of Zeebe, (2005) computed using 6-31+G(d) basis set, as only these are provided by the authors. and factors obtained at using a more extended 6-311+G(d,p) basis set indicate that the factors using 6-31+G(d) basis set are not fully converged. In particular, the factor of computed with 6-311+G(d,p) basis set is smaller than the one derived using 6-31+G(d). In Table 5, we compare these results with the results of our calculation. It is clearly seen that for lower temperatures such as the values computed with 6-311+G(d,p) basis set are in better agreement with our results indicating that plane-wave based DFT approach we use provides adequate vibrational frequencies and resulting isotope fractionation factors.
3.2.2 B isotope fractionation between and in aqueous fluid
In order to obtain the temperature dependent factor for aqueous fluids we fitted the function to the computed values using the least squares minimization procedure. The computed values for in fluid are: , and and for in fluid are: , and , for the temperatures of , and respectively. The resulting temperature dependent factor for is and for is .
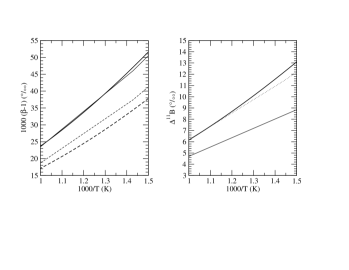
The results for and in aqueous solutions are shown in Figure 3. As was observed for the isolated molecules, the factor of -bearing fluid is substantially larger than the one for the . This can be understood in terms of the substantial difference in the B-O bond lengths exhibited by the two considered species. In case of isolated molecules our calculations indicate a B-O bond length of for and for . We compared our factors with the values computed by Sanchez-Valle et al., (2005), which were derived by the combination of force field methods and experimental data to derive accurate vibrational frequencies. For we got a nearly identical result. In case of our calculation predicts a value which is lower by . However, Rustad et al, 2010b and Rustad & Bylaska, (2007) revealed the improper assignment of a major fractionating vibrational mode of in the force field by Sanchez-Valle et al., (2005). This leads to the underestimation of the fractionation factor between aqueous and by Sanchez-Valle et al., (2005). Assuming that and having the difference between BLYP calculations of Rustad et al, 2010b and Sanchez-Valle et al., (2005) of at , the value reported by Sanchez-Valle et al., (2005) should be underestimated by , which results in at . Corrected in such as way result of Sanchez-Valle et al., (2005) is also plotted in Figure 3. It is now very consistent with our prediction.
3.2.3 Discussion of computational errors
Most previous computational studies of boron isotope fractionation in aqueous solutions concentrate on the computation of the isotope fractionation at ambient conditions (Rustad et al, 2010b, ; Rustad & Bylaska,, 2007; Liu & Tossell,, 2005; Zeebe,, 2005). Rustad et al, 2010b performed detailed analysis of impact of the chosen computational method (HF, MP2, different DFT functionals) and size of the basis set on the calculated fractionation factors between and . They found that DFT methods are not performing well for the borate system and concluded that DFT ”is of limited usefulness in chemically accurate predictions of isotope fractionation in aqueous systems” (Rustad et al, 2010b, ). The empirically derived error of the derived fractionation factor is of the order of for a total fractionation of . We note that this is expected and clearly visible if we apply the error estimation procedure outlined in section 2.5. For instance, at room temperature the derived beta factors using the BLYP functional are and respectively (Rustad et al, 2010b , Table 2). This gives a fractionation factor of 1.0343. Following our error estimation scheme, the absolute error of the fractionation factor is , and the properly reported computed value is . When one corrects for the systematic error of and assumes of statistical error on factors, then the value of decreases and the error is slightly smaller, i.e. . This is in good agreement with the experimental data reported in Rustad et al, 2010b and explains the spread of the values computed using different methods and reported in that paper. It is very difficult to get the fractionation factors for ambient conditions, as the fractionation factor is often just a small fraction of the relevant factors, in the considered case. Assuming that , a error in the factors leads to an absolute error in of , i.e. of relative error in the derived fractionation factor . On the other hand, we note that such a big error is not substantially larger than the uncertainties in the experimental data reported by Rustad et al, 2010b in their Figure 2. Thus, the case of boron fractionation in aqueous fluid at ambient conditions does not necessarily show the limited usefulness of DFT in the prediction of isotope fractionation factors, but only reflects the fact that precise estimation or measurement of the B isotopes fractionation factors at ambient condition requires unprecedented accuracy of both experimental or computational techniques. For instance, in order to get the value of with a relative error of (at ambient conditions) one needs to estimate the factors or measure relevant quantities with precision of less than . At higher temperatures the situation is different. Looking just at the fractionation between and in the gas phase or the aqueous solution one can see that for the fractionation factor between the two substances, , is at least of the factor. This results in smaller for and for relative error, which is acceptable in our calculations. Nevertheless, this case shows the importance of proper error estimation on the computed fractionation factors. Such an estimation is usually omitted or not provided explicitly, which can lead to wrong conclusions when the theoretical prediction is confronted with the measured data.
3.2.4 Pressure dependence of the fluid fractionation factor
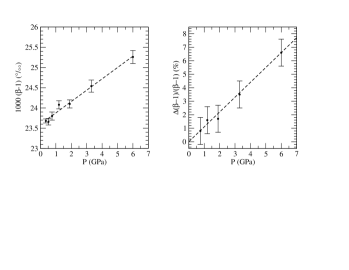
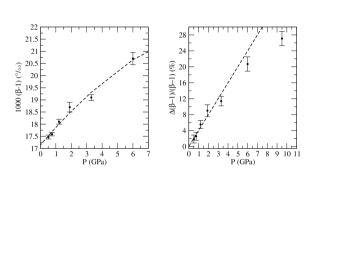
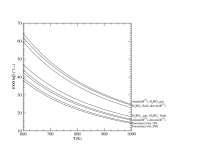
In our recent paper (Kowalski & Jahn,, 2011) we have shown that due to compression the factor of Li in aqueous fluid increases with increase in pressure (for ). The same should happen for and aqueous fluid as the vibrational frequencies of boron species in aqueous fluid increase with increase in pressure (Sanchez-Valle et al.,, 2005; Schmidt et al.,, 2005). Having the experimental data we checked whether the derived pressure-dependent factors are consistent with the pressure shifts of vibrational frequencies of considered boron species measured by Sanchez-Valle et al., (2005). For that purpose we performed a set of calculations using supercells containing 8 water molecules and the relevant boron species. We note that in line with our previous results for Li (Kowalski & Jahn,, 2011), the obtained values of () at are within in agreement with the values obtained for supercells containing 64 water molecules. The results are given in Figures 4 and 5. The computed values for fluid show a linear dependence in pressure, . This is expected as (Schauble,, 2004) and is a linear function of pressure (Sanchez-Valle et al.,, 2005; Schmidt et al.,, 2005). In case of the pressure-dependence is linear up to and it becomes less steep at higher pressures. In order to quantitatively check the consistency of our prediction with the measured vibrational frequency shifts of Sanchez-Valle et al., (2005) we derived the relative shifts in the factor assuming that and the measured pressure dependence of the frequency shifts: and for and vibrational frequencies of and for the vibrational frequency of . The chosen vibrational frequencies are the ones affected by the different B isotope substitution. Our predicted shift of matches well the shifts derived from the measured frequency shifts. Such a good agreement with the experimental data validates further our computational approach and shows that ab initio calculations can be successfully used in derivation of the pressure dependence of the fractionation factors and pressure-induced vibrational frequencies shifts. Moreover, first principles calculations can be useful in extrapolation of the experimental values for and to more extreme conditions, which otherwise are extremely difficult to reach by experimental techniques.
3.3 Fluid-mineral fractionation
Next we present the results of the fractionation between boron bearing fluids and minerals such as dravite, olenite and boromuscovite. The aim of these studies is to investigate the mechanisms driving the fractionation process, the role of coordination and the B-O bond length. Below we discuss each case separately.
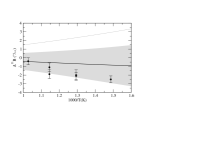
3.3.1 Tourmaline-neutral fluid
Meyer et al., (2008) measured the boron isotope fractionation between tourmaline and neutral fluid at and . In the experiment the tourmaline was represented by dravite. In contrast to the former measurements of Palmer et al., (1992) the measured fractionation is very small and does not exceed at . Our calculated fractionation curve together with the experimental data are given in Figure 6. Our result correctly reproduces the experimental measurements within the computational accuracy. The dravite-fluid fractionation is small as the two materials contain boron in units. We also predict a small fractionation between olenite carrying 3-fold coordinated boron only and aqueous fluid, although the olenite-fluid fractionation is positive because of the shorter B-O bond lengths for olenite ( vs. ).
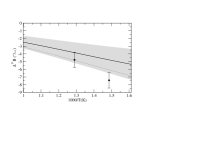
3.3.2 Boromuscovite-strongly basic fluid
Boromuscovite synthesized in the experiments of Wunder et al., (2005) consisted of two type of polytypes, 1M () and 2M1 (). In order to be consistent with the experimental conditions, we derived the factors for both polytypes and computed their weighted average. We note that the factors for both polytypes of mica are similar with the difference in not larger than . This is consistent with similar B-O bond lengths () found in both polytypes. Boromuscovite contains boron in tetrahedral sites. Therefore, in order to investigate the impact of the B-O bond length on the fractionation we first compare the fractionation between the mineral and a strongly basic fluid containing boron in . The result, together with the measurements of Wunder et al., (2005) of the fractionation between boromuscovite and strongly basic fluid, is summarized in Figure 7. Our calculations predict a negative fractionation between mica and the fluid. The agreement of our prediction with the experimental measurements is relatively good; however, the experimental data indicate slightly stronger fractionation. We note that the experimental conditions of Wunder et al., (2005) do not assure that the measured basic fluid contained four-fold coordinated boron species, i.e. , only. As we indicate in the Figure 7, the presence of as little as of in the measured basic fluid brings the prediction and measurements into much better agreement. It makes sense that the factor of boromuscovite is smaller than for aqueous as the average B-O bond length in mica is , while it is and therefore shorter in case of aqueous .
We note that in our derivation we assumed that the fluid consists mostly of species. As we already mentioned, although Wunder et al., (2005) call the fluid “strongly basic” its exact composition, especially the amount of species is unknown. However, if for instance the to ratio was , then the predicted mica-basic fluid fractionation at would be larger than measured. This would result in a large inconsistency between the computed values and the experimental data. On the other hand, good agreement between the prediction and the measurements indicates that the strongly basic fluid was dominated by species, which is in line with previous studies (Zeebe,, 2005; Sanchez-Valle et al.,, 2005).
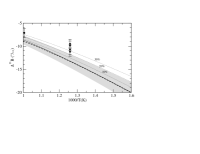
3.3.3 Boromuscovite-neutral fluid
The fractionation between boromuscovite and neutral fluid involves a change in coordination from in boromuscovite to in neutral fluid. Wunder et al., (2005) measured the fractionation between the two materials at , shown in Figure 8. The predicted fractionation is about larger than the measured value. Looking for potential sources of this discrepancy, we have checked for the effect of the change in lattice parameters due to combined thermal expansion and compression. For that purpose we applied the EOS of Holland and Powell, (2011) for muscovite, which gives , and decrease in volume for , and respectively and . As muscovites show highly anisotropic compressibility patterns, in line with Comodi & Zanazzi, (1995) we applied the and driven change in volume assuming the , and contribution to compression along the , , lattice vectors. On the other hand factors of and in aqueous solutions at increase by and respectively (Figures 4 and 5), leading to pressure-induced increase in the boromuscovite-aqueous fluid fractionation at the experimental pressure. The factor, corrected for effects of thermal expansion and compression of boromuscovite and compression of fluid, is also given in Figure 8. Because the high and effects result in similar increases in the factors for both solid and aqueous fluid, the resulting fractionation factor between these two phases is close to the one derived at ambient conditions. Therefore, thermal expansion and compression effects cannot explain the observed discrepancy between prediction and the measurements of Wunder et al., (2005).
On the other hand, the comparison of our results with the experimental data suggests that the fractionation between boromuscovite and fluid is the same as between and fluids (see Figure 3), which is at odds with the non-negligible and negative fractionation between boromuscovite and a strongly basic fluid. In section 3.3.2 we have shown that we are able to correctly reproduce the fractionation between boromuscovite and strongly basic fluid, which indicates that our result for boromuscovite is reliable. This suggests that another, unaccounted effect leads to the decrease of the boron isotope fractionation between mica and neutral fluid in the experiments of Wunder et al., (2005).
One possible solution for the discrepancy is a non-negligible amount of boron residing in four-fold coordinated configurations in neutral solution. This is in line with the Raman spectroscopy measurements of Schmidt et al., (2005), who detected a broad peak in the Raman spectra of neutral -dominated fluid and attributed it to species. The integrated area of this peak, compared to the peak of the Raman line of species, indicates the presence of at least of species by mole fraction. Assuming that there is of species present in the fluid and that the factor of these species is similar to that of , the fractionation factor between boromuscovite and aqueous fluid decreases bringing the theory and the experiment to better agreement, which is illustrated in Figure 8. If this interpretation is true, it suggests that boron isotope fractionation could be used to gather information on the speciation of B in aqueous fluids.
3.4 B isotope fractionation between minerals
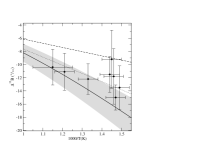
The boron isotope fractionation between B-bearing crystalline solids has received considerable attention recently (Wunder et al.,, 2005; Meyer et al.,, 2008; Klemme et al.,, 2011; Marschall,, 2005; Hervig et al.,, 2002). We focus here on the investigation of boron isotope fractionation between mica and tourmaline as boron atoms in these minerals occupy sites of different coordination, which should result in a large B isotope fractionation between these two minerals. In micas boron substitutes for silicon in the four-fold coordinated site (Wunder et al.,, 2005), while in tourmaline (dravite) it is incorporated in the three fold coordinated site (Meyer et al.,, 2008). Comparing the B isotope fractionation between different minerals, melts and fluids Wunder et al., (2005) have shown that the fractionation between two materials of different B coordination is large, reaching at and much higher values at lower temperatures. Klemme et al., (2011),Marschall, (2005) and Hervig et al., (2002) measured the fractionation between coexisting phases of the two minerals in natural samples. The fractionation between these two minerals is also derived from experimental isotopic fractionation data of B-muscovite-fluid (Wunder et al.,, 2005) and tourmaline-fluid (Meyer et al.,, 2008) systems. The results of these measurements and our computed -dependent fractionation curve are given in Figure 9. The first striking observation is that our predicted fractionation factors are much larger (taking the absolute value) than the experimental values (Wunder et al.,, 2005; Meyer et al.,, 2008). The latter are also inconsistent with the natural samples data of Klemme et al., (2011) and previous studies discussed in that paper (Marschall,, 2005; Hervig et al.,, 2002). On the other hand, the measurements on natural samples are consistent with our calculated values, which tends to validate our predictions. We notice that the most recent measurements of boron isotope signatures of tourmaline and white mica from the Broken Hill area in Australia by Klemme et al., (2011) indicate for the assumed temperature of 600 oC that the fractionation factor between the two phases is 10.4, which is in good agreement with our computed value of . The experimental mica–tourmaline B isotope fractionation factors of Wunder et al., (2005) and Meyer et al., (2008) are and smaller at temperatures of and respectively, with an experimental uncertainty of . However, this discrepancy can be resolved by assuming that in the experiments of Wunder et al., (2005) the fluid contained a significant admixture of species, which leads to the underestimation of the experimental boromuscovite-fluid fractionation factor by at and at , as is seen in Figure 8. The experimental mica–tourmaline fractionation factor corrected for the presence of species is also plotted in Figure 9. It is now more consistent with the natural data. We note that this result independently supports the conclusion underlined in section 3.3.3 and result of Schmidt et al., (2005) that high-, B-bearing neutral fluids contain significant admixtures of species.
Olenite is a mineral which can incorporate boron in both trigonal and tetrahedral sites as it substitutes for both Al and Si atoms. It is therefore interesting to check the fractionation of boron isotopes between the two differently coordinated sites in one mineral and compare it with the above result for mica and tourmaline. The computed fractionation between the trigonal and tetrahedral sites at 600 oC is , which is consistent with the fractionation between tourmaline and mica, indicating that the coordination of the B atom is the driving factor for the fractionation of the B isotopes. Similarly, we computed the boron isotopes fractionation between trigonal and tetragonal boron sites in dravite. In order to create the tetragonal B site we replaced one Si atom with B and we added one H atom forming an additional OH group to compensate the charge. The computed fractionation between the sites at 600 oC is , which is also in agreement with the aforementioned results. Next, we will show that the value of the factor depends not only on coordination but is also strongly correlated with B-O bond length.
3.5 Fractionation between and materials
The factors computed for all the considered materials are grouped together in Figure 10. factors can be grouped into two sets, one that includes materials with boron in three-fold coordination and another one that includes materials having boron in four-fold coordination. For olenite and dravite we also computed the factors with boron sitting on four-fold coordinated site. The factor for these crystalline solids with given ratio can be derived as a weighted average of the factors obtained for boron sitting on the two differently coordinated sites. The fractionation factor between materials of different boron coordination is on average at . We note that it is larger than the one deduced by Wunder et al., (2005) from measurements performed on solids, silicate melts and fluids, but this can be attributed to the underestimation of the fractionation factors for boromuscovite-fluid system by Wunder et al., (2005) due to potential admixture of species in the investigated fluid.
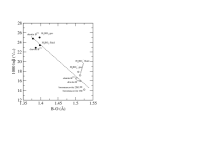
Our results show also a substantial spread of factors of substances containing boron of a given coordination. The spread is at least and results from different B-O bond lengths. We illustrate this in Figure 11 by plotting together the factors derived for all considered materials at as a function of B-O bond length. It is clearly seen that there is a roughly linear correlation between the factor and B-O bond length, which is especially evident comparing the results for crystalline solids. For instance, out of the considered -bearing minerals boromuscovite has the longest B-O bond length of (1M) and (2M1), followed by dravite and olenite with B-O bond length of . This tracks the differences in the factors derived for these materials. In addition the materials having B[3] species only exhibit shorter bond lengths of and higher factors, while the materials containing B[4] species having bond lengths of about show much smaller factors. Therefore, the tighter bonding of B[3] species likely explains why the heavy B isotope prefers the less coordinated phases. This clearly shows that the change in the B-O bond length during an isotope exchange is the leading factor driving the production of the boron equilibrium isotope signatures at high .
4 Conclusions
In this work we have presented a detailed analysis of boron isotope fractionation between boron-bearing crystalline solids and aqueous fluids at high and conditions. In order to perform our investigation we have applied and extended a computationally efficient approach for the computation of isotope fractionation factors for complex minerals and fluids at high temperatures and pressures presented by Kowalski & Jahn, (2011). As an extension to the Bigeleisen & Mayer, (1947) “single atom approximation” method we demonstrated that using the pseudofrequencies derived from the force constants acting on the fractionating element together with the full formula for computation of the reduced partition function ratios results in significant improvement in the accuracy of the computed fractionation factors, which is essential when lower temperature materials and high vibrational frequency complexes are considered.
In order to understand the fractionation between B-bearing crystalline solids and aqueous fluids we performed a set of calculations of factors for dravite, olenite, boromuscovite and aqueous solutions of and . In agreement with the experimental findings we show that the fractionation strongly correlates with coordination through the change in the B-O bond length. The lower trigonal coordination arrangement results in higher (by at ) than the tetrahedrally coordinated boron complexes, which exhibit longer B-O bonds. The computed fractionation between minerals and fluids of the same coordination are in good agreement with experiments. However, we predict larger isotope fractionation between boromuscovite and fluid (by at least a few ) than was measured in situ at high by Wunder et al., (2005) and Meyer et al., (2008), but that is consistent with measurements on natural samples. We note that the presence of in high- fluid could reconcile the in situ experimental results with our prediction and other measurements. This is expected from the experiments of Schmidt et al., (2005), but requires further experimental confirmation. If true, this would open the possibility for using the isotope fractionation techniques as a tool to measure the speciation of boron in fluids and crystalline solids. We have also demonstrated that with our computational approach we are able to correctly predict the pressure-induced isotope fractionation for compressed aqueous fluids, which indicates the ability of ab initio methods to predict the isotopic signatures of highly compressed materials, even those that are difficult to investigate experimentally.
Our study confirms that ab initio computer simulations are a useful tool not only for prediction but also understanding the equilibrium stable isotope fractionation processes between various phases, including aqueous solutions, at high pressures and temperatures. They can nicely complement experimental efforts, provide unique insight into the isotope fractionation process on the atomic scale and deliver data for conditions that are inaccessible by the current experimental techniques.
Acknowledgements
The authors wish to acknowledge financial support in the framework of DFG project no. JA 1469/4-1. Part of the calculations were performed on the IBM BlueGene/P JUGENE of the John von Neumann Institute for Computing (NIC). We are also grateful the associate editor Edwin A. Schauble and anonymous referees for constructive comments that helped improving the manuscript.
References
- Alecu et al., (2010) Alecu I. M., Zheng J. , Zhao Y. and Truhlar D. G. (2010) Computational Thermochemistry: Scale Factor Databases and Scale Factors for Vibrational Frequencies Obtained from Electronic Model Chemistries. J. Chem. Theory Comput. 6, 2872-2887.
- Andrews & Burkholder, (1992) Andrews, L., Burkholder, T.R., (1992) Infrared spectra of molecular B(OH)3 and HOBO in solid argon, J. Chem. Phys., 97, 10, 7203-7210.
- Barth, (1993) Barth S. (1993) Boron isotope variations in nature: a synthesis. Geol. Rundsch. 82, 640-651.
- Becke, (1988) Becke A. D. (1988) Density-functional exchange-energy approximation with correct asymptotic behavior. Phys. Rev. A 38, 3098-3100.
- Bigeleisen & Mayer, (1947) Bigeleisen J. and Mayer M. G. (1947) Calculation of Equilibrium Constants for Isotopic Exchange Reactions. J. Chem. Phys. 15, 262-267.
- Blanchard et al., (2009) Blanchard M., Poitrasson F., Meheut M., Lazzeri M., Mauri F., and Balan E. (2009) Iron isotope fractionation between pyrite (FeS2), hematite (Fe2O3) and siderite (FeCO3): A first-principles density functional theory study. Geochim. Cosmochim. Acta 73, 6565-6578.
- Brenan et al., (1998) Brenan J.M., Ryerson F.J. and Shaw H.F. (1998) The role of aqueous fluids in the slab-to-mantle transfer of boron, beryllium and lithium during subduction: experiments and models. Geochim. Cosmochim. Acta 62, 3337-3347.
- Car & Parrinello, (1985) Car R. and Parrinello M. (1985) Unified approach for molecular dynamics and density-functional theory. Phys. Rev. Lett. 55, 2471-2474.
- Chacko et al., (2001) Chacko T., Cole D. R., and Horita J. (2001) Equilibrium Oxygen, Hydrogen and Carbon Isotope Fractionation Factors Applicable to Geologic Systems. Rev. Mineral. Geochem., 43, 1-81.
- Comodi & Zanazzi, (1995) Comodi P. and Zanazzi P. F. (1995) High-pressure Structural Study of Muscovite. Phys. Chem. Miner. 22, 170-177.
- Domagal-Goldman et al., (2008) Domagal-Goldman S. D. and Kubicki J. D. (2008) Density functional theory predictions of equilibrium isotope fractionation of iron due to redox changes and organic complexation. Geochim. Cosmochim. Acta 72, 5201-5216.
- Domanik et al., (1993) Domanik K.J., Hervig R.L. and Peacock S.M. (1993) Beryllium and boron in subduction zone minerals: An ion microprobe study. Geochim. Cosmochim. Acta 57, 4997-5010.
- Driesner, (1997) Driesner T. (1997) The Effect of Pressure on Deuterium-Hydrogen Fractionation in High-Temperature Water. Science 277 791-794.
- Ertl et al., (1997) Ertl A., Pertik F. and Bernhardt H.-J. (1997) Investigations on olenite with excess boron from Koralpe, Styria, Austria. Anz. Abt. I 134, 3-10.
- Ertl et al., (2010) Ertl A. , Marschall H., Geister G., Henry D., Schertl H. P., Ntaflos T., Luvizotto G., Nasdala L., Tillmanns E. (2010) Metamorphic ultrahigh-pressure tourmaline: structure, chemistry, and correlations to P-T conditions Am. Mineral. 95, 1-10.
- Finley & Stephens, (1995) Finley J. W. and Stephens P. J. (1995) Density functional theory calculations of molecular structures and harmonic vibrational frequencies using hybrid density functionals. J. Mol. Struct. 357, 225-235.
- Gilson, (1991) Gilson, T. R. (1991) Characterisation of Ortho- and Meta-boric Acids in the Vapour Phase J. Chem. Soc., Dalton Trans. 2463-2466.
- Goedecker et al., (1996) Goedecker S., Teter M. and Hutter J. (1996) Separable dual-space Gaussian pseudopotentials. Phys. Rev. B 54, 1703–1710.
- Hervig et al., (2002) Hervig R.L., Moore G.M., Williams L.B., Peacock S.M., Holloway J.R. and Roggensack K. (2002): Isotopic and elemental partitioning of boron between hydrous fluid and silicate melt. Am. Mineral. 87, 769-774.
- Hill et al., (2010) Hill P. S., Schauble E. A. and Young E. D. (2010) Effects of changing solution chemistry on Fe3+/Fe2+ isotope fractionation in aqueous Fe–Cl solutions Original Research Article. Geochim. Cosmochim. Acta 74, 6669-6689.
- Hill & Schauble, (2008) Hill P. S. and Schauble E. A. (2008) Modeling the effects of bond environment on equilibrium iron isotope fractionation in ferric aquo-chloro complexes. Geochim. Cosmochim. Acta 72, 1939-1958.
- Holland and Powell, (2011) Holland T. J. B. and Powell R. (2011) An improved and extended internally consistent thermodynamic dataset for phases of petrological interest, involving a new equation of state for solids. J. Metamorph. Geol. 29, 333-383.
- Hoover, (1985) Hoover W. G. (1985) Canonical dynamics equilibrium phase-space distributions. Phys. Rev. A 31, 1695-1697.
- Jahn & Wunder, (2009) Jahn S. and Wunder B. (2009) Lithium speciation in aqueous fluids at high P and T studied by ab initio molecular dynamics and consequences for Li isotope fractionation between minerals and fluids. Geochim. Cosmochim. Acta 73, 5428-5434.
- Klemme et al., (2011) Klemme S., Marschall H. R., Jacob D. E., Prowatke S., and Ludwig T. (2011) Trace-element partitioning and born isotope fractionation between white mica and tourmaline. Can. Mineral. 49, 165-176.
- Kowalski & Jahn, (2011) Kowalski P. M. and Jahn S. (2011) Prediction of equilibrium Li isotope fractionation between minerals and aqueous solutions at high and : an efficient ab initio approach Geochim. Cosmochim. Acta 75, 6112-6123.
- Krosse, (1995) Krosse S. (1995) Hochdrucksynthese, Stabilität und Eigenschaften der Borsilikate Dravit und Kornerupin sowie Darstellung und Stabilitätsverhalten eines neuen Mg-Al-Borats. PhD thesis, Ruhr-University Bochum, 131 p.
- Lee et al., (1988) Lee C., Yang W. and Parr R. C. (1988) Development of the Colle-Salvetti correlation-energy formula into a functional of the electron density. Phys. Rev. B 37, 785–789.
- Liang et al., (1995) Liang J.-J., Hawthorne F. C., Novak M., Cerny P., Ottolini L. (1995) Crystal structure refinement of boromuscovite polytypes using a coupled Rietveld - static-structure energy minimization method Can. Mineral. 33, 859-865
- Liu & Tossell, (2005) Liu Y. and Tossell A. (2005) Ab initio molecular orbital calculations for boron isotope fractionations on boric acids and borates. Geochim. Cosmochim. Acta 69, 3995-4006.
- Marler et al., (2002) Marler B., Borowski M., Wodara U., Schreyer W. (2002) Synthetic tourmaline (olenite) with excess boron replacing silicon in the tetrahedral site: II. Structure analysis Eur. J. Mineral. 14, 763-771.
- Marschall, (2005) Marschall H. R. (2005): Lithium, Beryllium, and Boron in High-Pressure Metamorphic Rocks from Syros (Greece). PhD thesis, Universität Heidelberg, Heidelberg, Germany [http://www.ub.uni-heidelberg.de/archiv/5634].
- Marx & Hutter, (2000) Marx D. and Hutter J. (2000) Ab initio molecular dynamics: Theory and Implementation. Modern Methods and Algorithms of Quantum Chemistry 1 edited by J. Grotendorst, NIC, FZ Jülich, 301-449 ; CPMD code: J. Hutter et al., see: www.cpmd.org.
- Meheut et al., (2007) Meheut M., Lazzeri M., Balan E. and Mauri F. (2007) Equilibrium isotopic fractionation in the kaolinite, quartz, water system: Prediction from first-principles density-functional theory. Geochim. Cosmochim. Acta 71, 3170-3181.
- Meheut et al., (2009) Meheut M., Lazzeri M., Balan E. and Mauri F. (2009) Structural control over equilibrium silicon and oxygen isotopic fractionation; a first principles density functional theory study (in Applications of non-traditional stable isotopes in high temperature geochemistry). Chem. Geol. 258, 28-37.
- Menconi & Tozer, (2002) Menconi G. and Tozer D. J. (2002) Diatomic bond lengths and vibrational frequencies: assesment of recently developed exchange-correlation functionals. Chem. Phys. Lett. 360, 38-46.
- Meyer et al., (2008) Meyer Ch., Wunder B., Meixner A., Romer R. L., and Heinrich, W. (2008) Boron isotope fractionation between tourmaline and fluid; an experimental re-investigation. Contrib. Mineral. Petrol. 156, 259-267.
- Morgan & London, (1989) Morgan VI, G.B. and London, D. (1989) Experimental reactions of amphibolite with boron-bearing aqueous fluids at 200 MPa: implications for tourmaline stability and partial melting in mafic rocks. Contrib. Mineral. Petrol. 102, 281-298.
- Nosé & Klein, (1983) Nosé S. and Klein M. L. (1983) Constant pressure molecular dynamics for molecular systems. Mol. Phys. 50, 1055-1076.
- Ogden & Young, (1988) Ogden, J.S., Young, N.A. (1988) The Characterisation of Molecular Boric Acid by Mass Spectrometry and Matrix Isolation Infrared Spectroscopy J. Chem. Soc. Dalton Trans. 1645.
- Oi, (2000) Oi, T. (2000) Calculations of reduced partition function ratios of monomeric and dimeric boric acids and borates by the ab initio molecular orbital theory. J. Nucl. Sci. Technol. 38, 429-432.
- Palmer et al., (1992) Palmer M. R., London D, Morgan VI GB, Babb HA (1992) Experimental determination of fractionation of between tourmaline and aqueous vapor: a temperature- and pressure- dependent isotopic system. Chem. Geol. 101, 123-129.
- Redlich, (1935) Redlich, O. (1935). Eine allgemeine Beziehung zwichen den Schwingungsfrequenzen isotoper Molekeln. Z. Physikal. Chem. B 28, 371-382.
- (44) Rustad J. R, Casey W. H., Yin Q.-Z., Bylaska E. J., Felmy, A. R., Bogatko S. A., Jackson V. E., Dixon D. A. (2010) Isotopic fractionation of Mg2+(aq), Ca2+(aq), and Fe2+(aq) with carbonate minerals, Geochim. Cosmochim. Acta 74, 6301-6323.
- (45) Rustad J. R., Bylaska E. J., Jackson V. E. and Dixon D. A. (2010) Calculation of boron-isotope fractionation between B(OH)3(aq) and B(OH(aq). Geochim. Cosmochim. Acta 74, 2843-2850.
- Rustad & Bylaska, (2007) Rustad J. R. and Bylaska E. J. (2007) Ab Initio Calculation of Isotopic Fractionation in B(OH(aq) and BOH(aq). J. Am. Chem. Soc. (Communication) 129, 2222-2223.
- Sanchez-Valle et al., (2005) Sanchez-Valle C., Reynard B., Daniel I., Lecuyer C., Martinez I., and Chervin J. C. (2005) Boron isotopic fractionation between minerals and fluids; new insights from in situ high pressure-high temperature vibrational spectroscopic data Geochim. Cosmochim. Acta 69, 4301-4313
- Schauble, (2004) Schauble E. A. (2004) Applying Stable Isotope Fractionation Theory to New Systems. Rev. Mineral. Geochem. 55, 65-111.
- Schauble et al., (2009) Schauble E. A., Méheut M., and Hill P. S. (2009) Combining Metal Stable Isotope Fractionation Theory with Experiments. Elements 5 369-374.
- Schauble, (2011) Schauble E. A. (2011) First-principles estimates of equilibrium magnesium isotope fractionation in silicate, oxide, carbonate and hexaaquamagnesium(2+) crystals. Geochim. Cosmochim. Acta 75, 844-869.
- Schmidt, (1996) Schmidt M. W. (1996) Experimental constraints on recycling of potassium from subducted oceanic crust. Science 272, 1927-1930.
- Schmidt et al., (2005) Schmidt C. Thomas R. and Heinrich W. (2005) Boron speciation in aqueous fluids at 22 to 600°C and 0.1 MPa to 2 GPa. Geochim. Cosmochim. Acta 69, 275-281.
- Schreyer et al., (2000) Schreyer W., Wodara U., Marler B., van Aken P.A., Seifert F. and Robert J.-L. (2000) Synthetic tourmaline (olenite) with excess boron replacing silicon in the tetrahedral site: I. Synthesis conditions, chemical and spectroscopic evidence. Eur. J. Mineral. 12, 529-541.
- Urey, (1947) Urey, H. C. (1947). The Thermodynamic Properties of Isotopic Substances. J. Chem. Soc., 562–581.
- Wagner & Pruss, (2002) Wagner W. and Pruss A. (2002) The IAPWS formulation 1995 for the thermodynamic properties of ordinary water substance for general and scientific use. J. Phys. Chem. Ref. Data 31, 387-535.
- Wunder et al., (2011) Wunder B., Romer R. L., Meixner, A., Jahn, S. (2011) Li-isotope silicate – fluid fractionation: pressure dependence and influence of the bonding environment. Eur. J. Mineral. 23, 333-342.
- Wunder et al., (2005) Wunder B., Meixner A., Romer R. L., Wirth R., and Heinrich W. (2005) The geochemical cycle of boron; constraints from boron isotope partitioning experiments between mica and fluid Lithos 84, 206-216
- Yamaji et al., (2001) Yamaji K., Makita Y., Watanabe H., Sonoda A., Kanoh H., Hirotsu T. and Ooi K. (2001) Theoretical Estimation of Lithium Isotopic Reduced Partition Function Ratio for Lithium Ions in Aqueous Solution. J. Phys. Chem. A 105, 602–613.
- Zeebe, (2005) Zeebe R. E., (2005) Stable boron isotope fractionation between dissolved B(OH)3 and B(OH) Geochim. Cosmochim. Acta 69, 2753-2766
- Zeebe, (2009) Zeebe R. E. (2009) Hydration in solution is critical for stable oxygen isotope fractionation between carbonate ion and water. Geochim. Cosmochim. Acta 73, 5283-5291.
- Zeebe, (2010) Zeebe R. E. (2010) A new value for the stable oxygen isotope fractionation between dissolved sulfate ion and water. Geochim. Cosmochim. Acta 74, 818-828.