Revisiting Content Availability
in Distributed Online Social Networks
Abstract
Online Social Networks (OSN) are among the most popular applications in today’s Internet. Decentralized online social networks (DOSNs), a special class of OSNs, promise better privacy and autonomy than traditional centralized OSNs. However, ensuring availability of content when the content owner is not online remains a major challenge.
In this paper, we rely on the structure of the social graphs underlying DOSN for replication. In particular, we propose that friends, who are anyhow interested in the content, are used to replicate the users content. We study the availability of such natural replication schemes via both theoretical analysis as well as simulations based on data from OSN users. We find that the availability of the content increases drastically when compared to the online time of the user, e. g., by a factor of more than 2 for 90% of the users. Thus, with these simple schemes we provide a baseline for any more complicated content replication scheme.
I Introduction
Online social networks (OSNs) successfully claimed their place among the most popular Internet services. Despite their success, OSNs controlled by a single entity raise issues in terms of privacy of content and communication. To address these issues, recent works [1, 2, 3] have proposed decentralized online social networks (DOSNs), providing privacy and autonomy.
Privacy of user content involves two different aspects: the access to the data and the storage/replication of the data. Access to the data can be restricted through encryption [2], without requiring trust between the owner of the data and the intermediaries who store it. Where to store the data in decentralized systems is generally solved by having an external storage system in charge of keeping replicas of the data, for example through a distributed file system [4, 5].
The main challenge in decentralization comes from guaranteeing availability of the data when the owner of the data is not online [6]. Availability has been studied in P2P file-sharing [7, 8] and distributed file systems [4, 5]. File sharing is driven by popularity of content instead of social relations. Most P2P and distributed file systems introduce significant overhead when replicating data to achieve high availability, without sacrificing high scalability.
Almost all existing DOSN approaches rely on external storage services and therefore do not study content availability. Those DOSNs which do not rely on external storage amount to exactly one, i.e. PeerSoN [9] which proposes to use storage provided by a user’s friends. In this paper, we study availability in such DOSNs that do not rely on external storage and rather exploit the social graph of a user. As direct social friends are interested in a user’s content, they will store it as an effect of their interest. Contrary to existing data replication schemes that incur computation and communication overhead, our implicit content replication scheme avoids this overhead.
Given the lack of explicit replication of our strategy, one may expect that the resulting availability of a user’s data is very limited. We show in this paper that despite the limited replication provided by our strategy, the availability of content is relatively high. Furthermore, we show that by allowing a limited fraction of the users to be always online, e. g., by utilizing their own home gateway or an external storage service, the content availability is comparable to existing OSNs.
This paper makes the following contributions:
-
•
Using network traces, we study and model the connection patterns of today’s OSN users.
-
•
Based on these results, we simulate and analyze the performance of our replication scheme. Results show that friend-only replication allows a surprisingly good content availability.
-
•
We study the impact of users being always online and show that already a small fraction leads to high overall content availability.
The remainder of this paper is structured as follows. In Section II we present our notion of DOSNs, and introduce our replication schemes and metrics. In Section III, we provide an analytical model of the availability of our schemes. We present our simulation approach and our models for session characteristics in Section IV, before we discuss our simulation results in Section V. We discuss related work in Section VI and conclude in Section VII.
II Our DOSN concept and evaluation strategy
We first describe our concept of a Distributed Online Social Network (DOSN) and define some terminology. Then we present the content replication schemes we evaluate in this paper and describe our availability metrics.
II-A Terminology and System Description
DOSN users can engage in social relations with other users, e. g., online friendship, follow another’s activity, or subscribe to status updates. Independent of the type of social relation that connects two users, we call them friends and their relationship friendship. The entirety of users and their relationships form the social graph of the DOSN, where users and relations correspond to nodes and links, respectively. A user’s data—the user’s content—can be seen as the digital representation of a user, which is stored on a computing device and can be transmitted from one device to another. The content can contain information on location, work, education, interests, photos or status updates. Each user regularly produces such content, that she is eager to share with her friends with the help of the DOSN. We do not make any assumption on the type of data exchanged by users, but in the rest of the paper, we assume that the time to transfer a user’s data is negligible. Typically content in OSNs is small in size. Moreover, large objects such as videos can be uploaded into the cloud (e.g. YouTube) and only the link to this object is shared through the DOSN. Thus, as we consider DOSN and not P2P file-sharing systems, this assumption is reasonable.
We consider DOSNs in general, without limiting ourselves to a specific implementation. Yet, we focus on cases where there is no central server storing users’ data, e. g., PeerSon [9]. This implies that availability is a function of users being online and able to serve the data of a given user.
In this paper, we concentrate on DOSN data replication mechanisms. Therefore, we assume that the typical functions of OSNs, such as finding online friends and bonding to them, or creating interest groups, is ensured by another component of the DOSN. An often discussed, typical problem in P2P systems is the so called boot strapping problem, which describes the process and the related issues when a new node wants to join the system. We will not discuss the boot strapping problem in this context because it increases the complexity a lot while giving very little insight. Note however that our simulation does include nodes with only a few friends. Further details on boot strapping a DOSN are discussed in [9].
OSNs are highly dynamic, users join and leave, friendships are created and destroyed. This leads to a very complex scenario. To reduce this complexity we examine a static snapshot of an OSN. We do not assume that the graph is static itself but look at it in a certain state. We believe this simplification to be reasonable as long as the simulation time frame is limited. Throughout our simulations we do not allow users to join or leave, or edges to be added or removed. We further assume that for the time of the simulation the data does not change and because of that stays valid. In this study we want to follow a piece of data and its distribution over the system and the resulting availability. If the data would be changed, e.g. by adding new info, this would be equal to a restart of one of our simulation runs.
We consider a one-to-one mapping between a user and a node, and that the node corresponding to a user is always a replica of this user’s data. In other words, nodes always hold a complete copy of their user’s data. We further assume that each user uses exactly one device. We do not consider the case of one user using multiple devices (such as a smart-phone and a desktop computer), nor the case of multiple users sharing the same device (e. g., the family’s desktop computer). The assumption that each device holds a full copy is valid, because memory is cheap and even smart phones have a lot of storage capacity these days. A full system to handle different versions of data is given in [9]. This system uses a DHT to store a) information about available versions of the content and b) locations (i. e., which node) where each version can be found. This way a user is not necessarily tied to a single device. Thus, if a user utilizes multiple devices to access the DOSN and some device does not hold all content or the most recent version of the content, the DOSN knows about it. That way friends can make an informed decision to either download outdated content or wait for fresh content. Yet, this case might influence a user’s interaction with the DOSN and we can neither predict nor measure the effects of such a feature. Therefore we exclude this case from our analysis. We do not consider shared devices for two reasons. Either they only share data when the user is online, then there is not differences to our “exactly-one-device”-rule. Another option is that the device shares the data of all its users while any of the users is online. For that case our assumptions actually constitute a worst case.
II-B Replication schemes
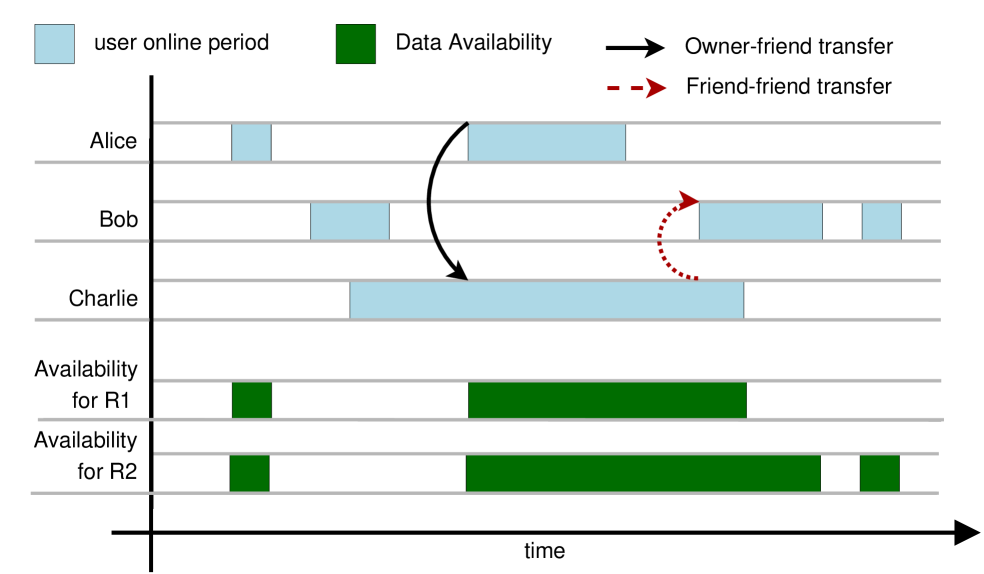
To improve data availability, data can be replicated on multiple nodes. These nodes become replicas. Choosing good replicas is a crucial question that has received a lot of attention in the context of distributed file sharing. In the context of DOSN however, one structure is by definition available: the underlying social graph. In this paper, we build an implicit replication strategy from this underlying social graph. The rationale behind this strategy is the fact that social friends are natural candidates for replicating a user’s data, as they are interested in that person. And since memory is cheap, friends can store a replica of an item even if they are not interested in it. We also assume that each user takes care to backup her own data. In case a friend’s hardware fails, the user still has the full data set and can transmit it to her friend as soon as their hardware works again. We study three different replication mechanisms that constitute different ways to exploit the social graph of a DOSN for data replication. The example in Figure 1 illustrates these replication schemes for user Alice:
- R0
-
No replication: In this scheme, only the user provides her own data. In other words, the data is available only when the corresponding user is online. It is arguably not a replication mechanism, but constitutes a baseline for comparison of the other schemes. In Figure 1, Alice’s R0 availability is equal to Alice’s online time. This is the only case where it could be a difference if a user has multiple devices. If Alice is online with her mobile phone and adds a new data item, this item will not be available in that moment from her home PC. On the other side, in that moment the home PC would probably not be online. In case it is, synchronization mechanisms like those explained in [9] will take care that both devices reach the same state again.
- R1
-
Direct replication only: In this scheme, the data is made available by the user and her friends. To be able to distribute user’s data, friends must obtain a copy of this data directly from the user itself. In Figure 1, Alice’s R1 availability is her online time, plus the online time of Charlie after he got a copy of Alice’s data. Since Bob and Alice were never simultaneously online, Bob cannot replicate Alice’s data.
- R2
-
Indirect replication: In this scheme, friends of a user can collaborate with other friends to obtain this user’s data when they are online. In Figure 1, Bob can in this case get Alice’s data from Charlie, and distribute it. Alice’s R2 availability is thus made by Alice, Charlie after he got the copy from Alice, and Bob after he got the copy from Charlie.
Note that if we represent the social network by its adjacency matrix , the links of , and correspond to replication graphs of R0, R1, and R2 strategies respectively, where an edge in the replication graph represents data exchange. It is however important to recall that data is only hosted by direct friends: common friends of a user might exchange the data of this common friend, but do not host each other’s data. For instance in Figure 1 if Bob is not Charlies’ friend, he will get Alice’s data from Charlie, but will not host Charlie’s data. Note also that to keep this “only direct friends are replicas rule”, strategy R2 is the best we can do.
II-C Metrics: Pure availability and Friend Availability
The term availability can have many definitions in the context of P2P and distributed systems. Definitions include hardware failure rate, churn rate of peers, or information about which parts of content can be downloaded from which peer. In this study we consider content availability, i. e., which fraction of time the data of a user is available to others in a DOSN. The content is available when the user’s node is online, or when a replica of the data is online.
One option to measure the availability would be to count how many data requests are successfully answered in a real system. This would require to model and simulate user requests. Although this is possible, we refrain from doing so because it substantially increases the simulation complexity and duration. Moreover, it is difficult to find real-world data that includes data request behavior and derive a good model from it. Therefore, we rely on time-based availability metrics.
We do not consider data updates in this study. Instead we assume that each user generates new content at some point of the simulation. We measure availability over a day (24 hours) following the new content generation. Note, that this also means that the only copy of the data available in the system at the beginning is held by the user’s node. We believe this constitutes a worst-case scenario. Consider Figure 1: The first time Bob is online he still has not downloaded Alice’s data. We therefore consider Alice’s data as unavailable. In reality, Bob has probably a local copy of Alice’s older data that he can serve as well: he just does not have the latest update.
Here, we do consider two different types of availability. The first one is the traditional content availability, as defined above: The fraction of time a piece of data is available. We refer to it as pure availability or metric M1.
In the context of DOSN however, we can again exploit the social graph. People interested in a given user’s data are primarily her friends. Recall that any kind of OSN relationship defines friendship. In a news service, only the followers that subscribed to a feed will receive the content. In Facebook or Google Plus many profiles are only shared with friends, such that an arbitrary user cannot see the profile.
Thus, in this paper, we also measure the friend availability or metric M2, which is the fraction of time a user’s data is available when her friends are online. This availability takes into account who is interested in the data that is available. This last availability can be seen as a convergence metric as once all the friends of a user have a copy of the data, this friend availability is one, even though friends are rarely online. Note also that pure availability can be higher than friend availability. For instance assume Figure 1 represents one day and Bob is Alice’s only friend. Because Alice and Bob are never simultaneously online, M2 would be zero but M1 corresponds to Alice’s availability.
In the remainder of this paper we refer to the combination of the replication scheme Rx and the metric My as RxMy, e. g., the combination of no replication and pure availability is referred to as R0M1 and indirect replication and friend availability is referred to as R2M2.
III Theoretical analysis of availability
Data availability has already been theoretically addressed in the context of peer-to-peer storage [10]. Despite the similarity of making data available in peer-to-peer networks and distributed replication of OSN user data, these problems differ on some fundamental points such as the model of replica failures.
III-A Model and assumptions
Let be the graph modeling the OSN friendship connectivity. We assume a discrete time model, and that does not vary over time. Let be the probability that node is online at time . We assume that all nodes have the same session characteristics: . The graph dynamics is captured by nodes being offline or online. We also assume that the probability of two nodes being connected (online) at a given time are independent of time: . In other words connections are independent and identically distributed. In the following, denotes the complement of .
Most of the related work focuses on achieving a highly reliable data storage system despite failures or departures of the peers holding the data. For instance in [11], a dynamic model is studied where peers continuously fail, and the replication rate must be adapted to compensate for these losses. Our model on the other hand considers that friends are reliable: they never fail nor depart from the system. Once the user data has been replicated to all its friends, the system is converged. The main aspect of our model is to consider that nodes can be temporarily disconnected by being dynamically online and offline.
III-A1 Data availability metric
The goal of P2P storage systems is to store large amounts of data in a reliable fashion, at low cost. Considerations such as the available disk space of a replica or the available bandwidth are therefore important. For instance, some of the works on P2P systems consider the use of error correcting codes as a mean to reduce the consumed space while keeping the desired availability. In this work, we assume that enough storage is available at every node.
In this paper, we are interested in the user’s data availability: during which fraction of time is user ’s data available? Formally, let be this availability, and be the measuring period:
Given that replication is made only among directly connected neighbors, the problem we address is a local one with respect to . As we will see, the most relevant graph property in our context is the out-degree of nodes, i. e., the number of potential replicas. Other graph properties such as diameter, connectedness or clustering do not have a major impact on availability.
III-A2 Converged case
We consider that a given node is in a converged state when all its neighbors have obtained a copy of ’s data, and are therefore able to act as ’s data replica. This constitutes an upper bound of the availability since cannot expect more replicas. Let be the number of neighbors of node . With the assumption of independence between online times, we have
This is the maximal availability a node with neighbors can hope for in our model.
III-A3 Non-converged case
Fix node . Let be the random variable representing the number of ’s replica in the system at time (be they online or not). We have , since the only available copy of ’s data at time is on node . Note that is strictly increasing: no replica ever deletes a hosted user’s data. Now, assume there are replicas in the system at time . Then the probability that is the probability that exactly nodes became replicas at time . In other words, using total probability law:
| (1) | |||||
Where is the random variable representing the number of replications happening at time . Let us express , the probability that exactly new replicas appear at time . Note that we need to differentiate the case where no new replica is created at this time () for the general case. Assume , two reasons for this: either no replica connected, or at least one replica was online, but no non-replica friend connected. Thus it writes:
Now assume , at least one replica is created, which also means that at least one replica is online, and exactly friends that are still not replicas connect. In the following, using total probability law, we decompose according to the number of replicas that are online at time , and use the fact that if at least one replica is online, the number of new replicas created is exactly the number of non-replica friends that are online:
Since we know that we can then iteratively compute .
Now that we can describe the evolution of ’s number of replicas over time, we can express the probability that ’s data is available at time : it is the complement of finding all the available replicas offline. Let be the event “’s data is available at time ”. We have
| (2) |
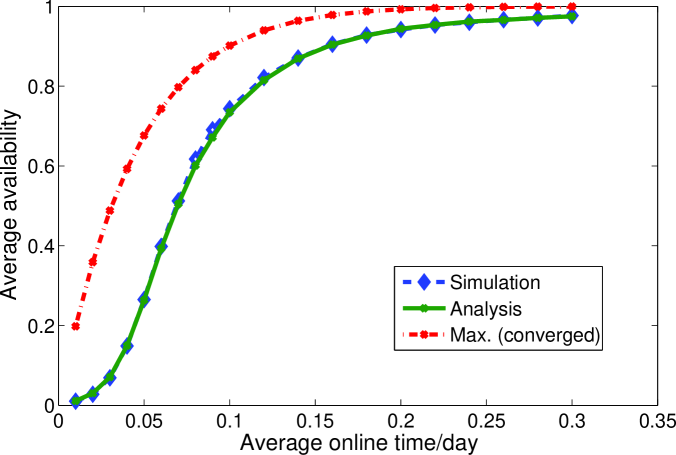
Using this relation, it is possible to numerically estimate the average availability of a given node over time with Monte-Carlo simulation (code is available[12]). Figure 2 compares the analytically derived average availability over a day with the results of the simulation, for different online patterns. We consider here nodes with a degree , and the probability of a node to be online in a given time bin is drawn uniformly at random over the day (). The theoretical maximum availability, i. e., the availability achieved in the converged case, is also plotted. The gap between the maximal availability and both analysis and simulations of convergence decreases as the average online time increases. This confirms the intuition that the more often nodes are online, the faster the converged situation is reached, i. e., all potential replicas have a copy of the data.
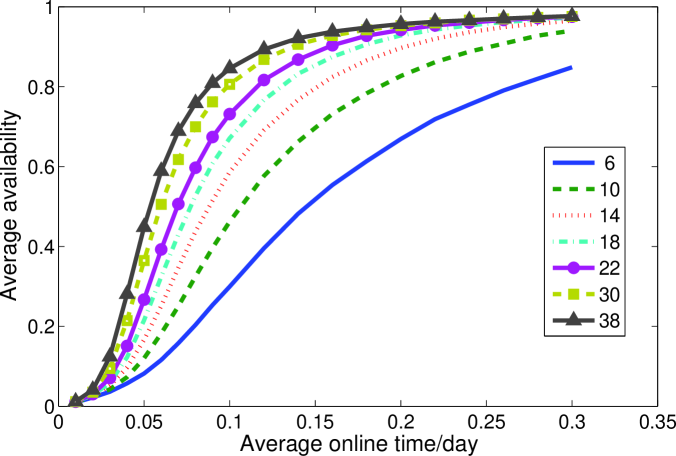
Figure 3 presents the average availability of nodes as a function of their average online time for various node degrees. The point (,) on the lower (blue) curve shows that according to our analysis, nodes with neighbors being online with probability in each time bin have on average availability. This illustrates the strong impact of node degree on availability: nodes with neighbors need to be online nearly 3 times less to achieve the same availability, and can expect more than availability with online time.
IV Simulation methodology
We evaluate DOSN content availability for different graphs and user online patterns. In this section, we describe the friendship graphs used, explain how we model the session characteristics of DOSN users, and present the simulation procedure.
IV-A Social Graphs and their Node Degree Distribution
| Name | #Nodes | avg. | |
| Degree | Distribution | ||
| G-StudiVZ | 1.04 M | 22.24 | Weibull (0.9; 22.5) |
| G-SynStudiVZ- | 24.12 | ||
| G-Twitter | 51.22 M | 41,71 | Power-law (2.25; 41) |
| G-SynTwitter- | 41 | ||
| G-Regular-- | nodes w/ degree |
As shown in Section III, the availability of content depends strongly on the social graph, especially its node degree distribution. For this study we use relationship graphs from two well-known OSNs, as well as synthetically generated graphs. The synthetic graphs allow us to explore social graphs with different average node degrees as well as the influence of graph size. Table I summarizes the relationship graphs we use in this study.
Regarding the real-world graphs, we use graphs derived from crawls by Fritsch [13] for the G-StudiVZ graph and Cha et al. [14] for the G-Twitter graph. StudiVZ is a popular Facebook like OSN for German speaking students. While G-StudiVZ is symmetric due to reciprocal friendships, G-Twitter is asymmetric. Being a follower is a unidirectional relation.
The Twitter dataset includes a link from user to user , when the crawl revealed that follows . This notion of edge direction is contrary to ours. We consider edges to point in the direction in which content is transferred: From the content originator to the friend that is interested in the data. In Twitter content flows from the followed () to the follower (). Therefore, when we want to use the Twitter dataset we need to consider the distribution of in-degrees, instead of out-degrees.
Both of these graphs have more than a million nodes, G-Twitter has 50 million. Running simulations with that many nodes is not feasible when exploring all our combinations of simulation parameters. In order to reduce the computation time we synthetically generate smaller graphs (e. g., nodes) that follow the same node degree distribution as the real-world graphs, using the gengraph tool by Viger and Latapy [15].
| Name | Durations | Arrivals/bin | Sessions per day | |||||
|---|---|---|---|---|---|---|---|---|
| Q1 | median | mean | Q3 | fitted Model | low | high | ||
| P-Facebook | 0m37s | 6m30s | 69m | 52m | Weibull (0.4; 1284) | -97 % | +107 % | 2.5 |
| P-Radius w/o always-on | 3m10s | 5m16s | 50m | 19m | Weibull (0.35; 550) | -52 % | +44 % | 4.5 |
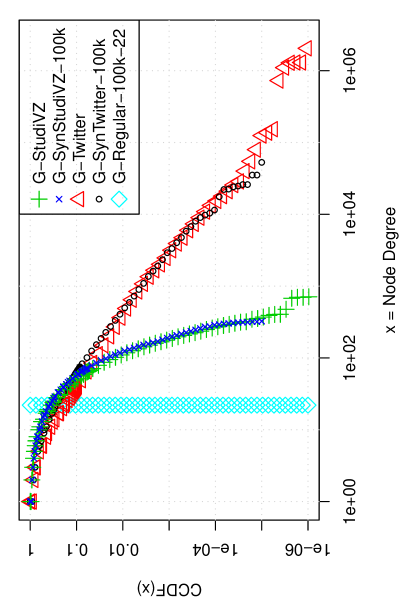
To produce the input degree distributions for gengraph, we fit the G-StudiVZ degrees with a Weibull distribution with shape 0.9 and scale 22.5. For Twitter’s in-degrees we fit a power-law distribution with and a mean of 41, using the node degree distribution generator distrib, which is part of gengraph. We validate our fitting through Kolmogorov-Smirnov (KS) tests as well as visual inspection (Figure 4). For comparison, we also generate regular graphs, i. e., graphs where each node has the same degree, with gengraph. We use these graphs to study the impact of different (average) node degrees and in contrast to the heavy-tailed real-world distributions.
In our simulations we do not consider that the underlying social graphs are changing. However, as users go online and offline the graph of active users is highly dynamic. We characterize and model these changes in the following subsection.
IV-B Session characteristics
For our time-based simulations, it is important to reproduce the session characteristics of DOSN users. Although we were able to get access to relationship graphs from real-world OSNs, there are no publicly available models of session durations and arrivals for those graphs. Therefore, we rely on two types of session characteristics derived from data gathered in the aggregation network of a large European ISP. First, we consider session characteristics of Facebook sessions observed from about 2,000 users (P-Facebook), see Schneider et al. [16] for details on the dataset and a study of popular user interactions with OSNs. Second, we consider DSL session characteristics (P-Radius) from about 20,000 customers, see Maier et al. [17] for details on the dataset.
From our DSL session data we observed that a significant fraction (57 %) of lines are always connected, i. e., they perform an automatic reconnect upon disconnects from the ISP. The exact fraction heavily depends on the (default) configuration of the DSL router, and is subject to change depending on the set of services provided by the ISP, e. g., a VoIP customer DSL line should be always connected. We choose to filter out those sessions and instead use a parameter in the simulations denoting the fraction of always-on nodes.
Because the number of users for which we observed the session characteristics does not match with the sizes of our social graphs, we need to determine a session model that can scale with the number of users. For each session we identify the login and logout timestamps and model the session start times and durations. Our session start time model accounts for time of day effects. We model the arrivals using a modulated Poisson process with 20-minute bins. In each bin the rate is modulated according to the observed probability that a session is starting in that bin.
We did not observe a strong correlation between the session’s start time (of day) and its duration. Pearson’s correlation coefficient is and for P-Facebook and P-Radius, respectively. Therefore, we model the session durations independently from the session start times, using Weibull distributions. Again we validate the fittings using KS tests.
Table IV-A summarizes the session characteristics observed. We show the mean durations as well as the median, together with the fitted distributions. Note that for P-Radius the statistics and the model only correspond to those DSL lines which are not permanently connected (referred to as ”w/o always-on”). In addition, we show the deviation from the average number of arrivals per bin and number of sessions per user per day.
IV-C Simulation setup
Our simulation takes three parameters: (i) the social graph, (ii) the session characteristics, and (iii) a configuration that determines the duration of the experiment and the time period considered to compute the availability metrics.
First we select a social graph which in turn defines , the number of nodes/users in the DOSN, and the node degree distribution as described in Section IV-A.
Second, we select one of the two session models from Section IV-B, and generate a (possibly empty) set of presence times for each of the nodes of the graph. A presence time consists of the start and end time of an online session. In addition to the session model, the online times of users depend on the fraction of nodes that are always connected. Note that the session models include time-of-day effects, that is nodes are online and offline depending on the time of day. Further the process used to generate the sessions randomly applies different sessions to all users, so that two users do not have the same on/off-pattern.
We generate a total of presence times, where is the average number of sessions per day and user (see Table IV-A). This allows to compare the results for graphs with different numbers of nodes. The session start times follow the time-of-day modulated bins. The session end times are produced by adding a duration drawn from the Weibull distribution corresponding to the session model. To keep simulation runs with the same session model comparable, we generate one big set of session durations per model and use them subsequently. Each session lasts for at least 5 seconds.
For the remaining nodes, we set the session start time to the beginning of the simulation and the session end time to the end of the simulation time. Once everything is prepared we compute the availability of each user’s content for the different replication schemes and availability metrics in one pass.
V Simulation results
In this section, we start by demonstrating that our reduced size graphs accurately capture availability. Then, we study the availability that can be expected from our socially-driven replication schemes, and highlight the importance of the way the availability metric is defined. We also discuss the impact of different social graphs and user session models. We close this section by assessing the improvements in availability gained from a fraction of always-online nodes as well as considering longer simulation periods.
V-A Graph sizes do not matter
In the remainder of this paper, we present results as cumulative distribution function (CDF) of the content availability (y-axis) as a function of the fraction of nodes/users (x-axis).
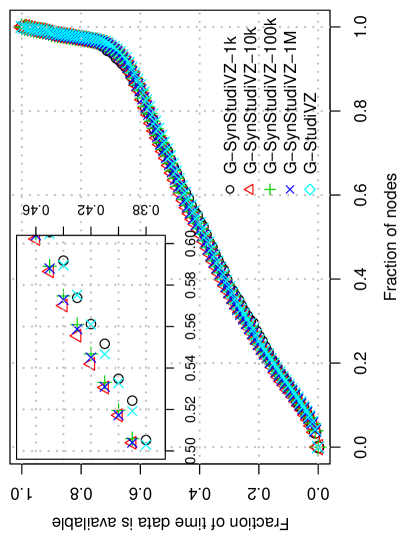
Figure 5 shows the availability of G-StudiVZ based graphs with a P-Facebook session model over 24 h simulation time for R2M1. Before computing the CDFs, we remove all nodes from the simulation output which never go online, and therefore never generate any content. For all simulations this exclusion affects around 6 % of the nodes for P-Facebook and 1 % for P-Radius.
Since simulating the replication process is an expensive task in terms of computational time, we do most of the experiments on scaled-down graphs. In Section IV-A we already showed the match between synthetic graphs and real-world graphs in terms of node degree distribution. In Figure 5 we now show that also the resulting availability is very similar, cf. G-StudiVZ and G-SynStudiVZ-1M. Moreover, scaling down the size of the network does not affect the availability distribution either, cf. G-SynStudiVZ-1k, G-SynStudiVZ-10k and G-SynStudiVZ-100k.
Based on this insight, we use the synthetic graphs with 100,000 nodes for all further simulations. Using smaller graphs significantly speeds up simulation time and thereby allows to explore a broader variety and combination of parameters. Unless otherwise mentioned we present results for G-SynStudiVZ-100k and P-Facebook for 24 h, which serves as our baseline scenario.
V-B The Gain of Replication
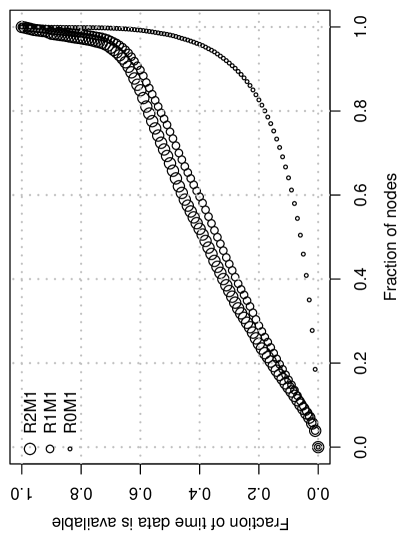
Next, we turn to understanding the impact of the different replication schemes that we introduced in Section II-B. Figure 6 shows R0M1, R1M1 and R2M1 for our baseline scenario. As compared to R0M1 which represents the availability of the nodes themselves (no replication), we observe a drastic increase in availability for both replication schemes R1 and R2. While R2 offers limited gains in availability for the bottom and top 5 % of nodes ranked by R0, the vast majority (90 %) of nodes double their availability and the median availability is shifted from less than to more that —an increase by a factor of 7. The bottom 5 % of nodes suffer from the reduced opportunities to hand over their data, due to their own limited online time. The top 5 % do not gain much as their own online time is already high.
Taking a detailed look at Figure 6, we see that replication schemes R2 and R1 produce very similar results. As expected, R2 has better availability compared to R1. However, the similar results indicate that passing along content over multiple friends does not happen often. One explanation for this is that contacts with the data owner occur before contacts between two friends. Indeed, increasing the simulation time to multiple days did not change this result.
Note that due to the small difference between R1 and R2 and given that the restriction of allowing to copy the data only from the originator is artificial, e. g., when relying on encryption of content, we refrain from presenting the results for R1 in the sequel. Further, R0 always produces the same curve for identical presence times, which only varies for different graph sizes and session characteristics.
V-C Difference between availability metrics
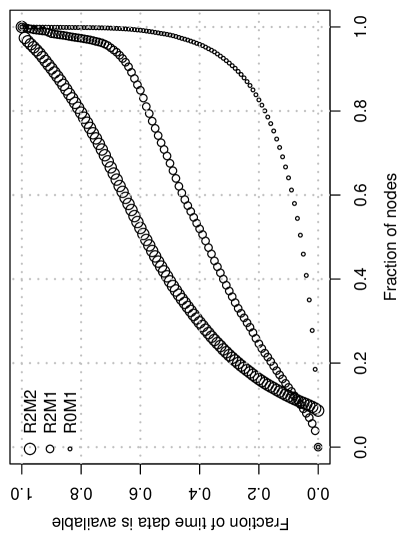
So far, we looked at the availability measured in relation to the total time of the experiment, which we defined in Section II as our first metric M1. Our second metric M2 is the data availability measured in relation to the online time of a user’s friends. In Figure 7 we observe that R2M2 is a significant improvement over R2M1 for the baseline scenario. The median availability increases to around 60 %. This corresponds to a 30 % gain for more than 60 % of the nodes over R2M1.
However, the availability of about 8 % of nodes reduces to zero for R2M2, cf. bottom left part of plot. Indeed, if no friend is online at the same time as the node itself, M2 reports 0 while M1 reports the node’s own availability. Our finding from the previous subsection holds, in that R2 is slightly better than R1 when comparing R1M2 with R2M2 (not shown). Without replication, M2 is still better than M1 but by very little. Therefore, from now on we focus on R0M1 (as reference), as well as R2M1 and R2M2 whenever useful.
V-D Impact of graphs types and node degree
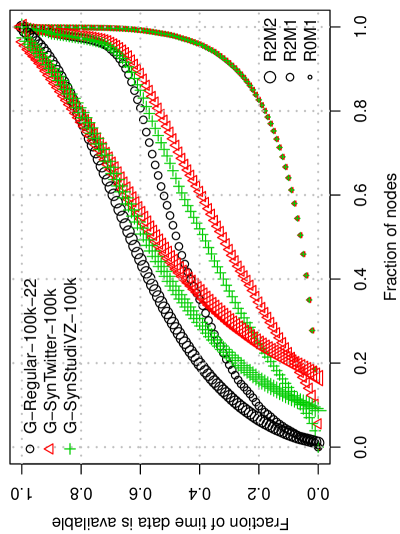
As introduced in Section IV-A, we use different types of graphs with different node degree distributions. In Figure 8, we present the availability of two graphs in addition to our G-SynStudiVZ-100k baseline graph: G-SynTwitter-100k and G-Regular-100k-22. We choose the average node degree of G-StudiVZ (22) as node degree for the regular graphs, to allow comparison.
G-Regular-100k-22 achieves the best availability, followed by G-SynStudiVZ-100k. G-SynTwitter-100k has the worst availability, although it has the highest average node degree. From this observation, we conclude that the degree distribution is more important than the average degree for availability. Both synthetic graphs have a lot of nodes with only a few friends, so that their opportunities to get their data replicated is lower. Indeed, G-SynTwitter-100k has significantly more nodes with single digit node degrees than G-SynStudiVZ-100k (50 % over 35 %). The G-Regular-100k-22 graph does not have nodes with zero R2M2 availability, as nodes do not need to rely on the opportunity to meet their one and only friend.
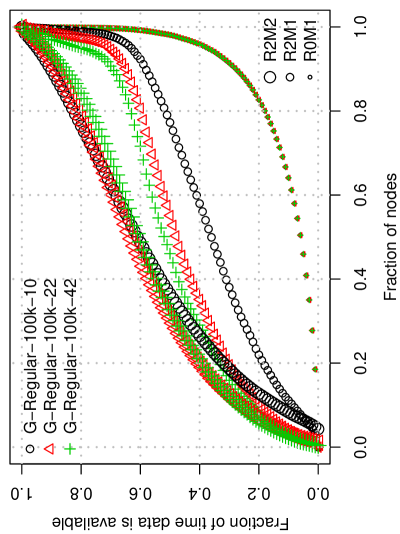
To study the impact of a graph’s node degree, we consider different versions of G-Regular-100k-?. Besides the degree of we also used G-Regular-100k-10, and G-Regular-100k-42. Figure 9 shows that the degree of each individual node has an impact on the availability, although it is limited, as can be observed through the saturation effect around 22 neighbors. While R2M1 is always better for higher node degrees, R2M2 is slightly worse for the top half of nodes (right sides of plot).
V-E Impact of session characteristics
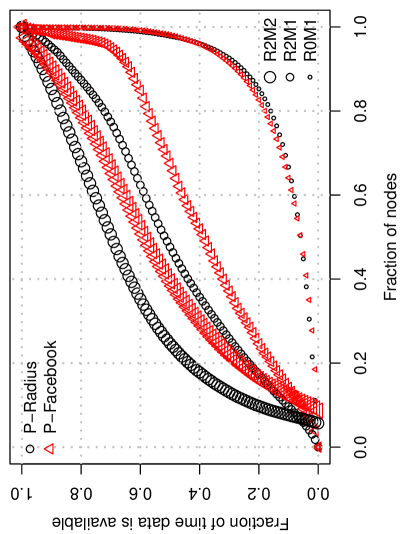
As described in Section IV-B, we use mainly two different distributions for the session characteristics, P-Radius and P-Facebook. Figure 10 compares those on G-StudiVZ. P-Radius shows higher availability for R2M1 and R2M2. Yet, for R0M1 the difference is limited. However, the gap between the two session models is certainly bigger than the gap between different graphs, highlighting the higher importance of the session models compared to the graph.
The difference in availability for the replication cases, corresponds to the expected total online time of all nodes. As shown in Table IV-A, the product of session per day and average duration is higher for P-Radius. This matches the expectation that a user usually is more often and longer online in the Internet than logged in to Facebook. Obviously, a user first needs to establish an Internet access connection before using Facebook.
The reason why the higher total online time of P-Radius is not as pronounced in the R0M1 curve is that the median session durations are tiny compared to the simulation duration, e. g., 6m30s corresponds to a value of 0.0045 on the y-axis.
V-F Adding always on nodes
Many DOSNs rely on external storage and consider storage as always available. Similarly, we saw more than half (57 %) of all P-Radius sessions being connected all the time. Therefore we now explore how much we can improve availability by replacing a fraction of nodes with always-on nodes. This can be achieved by running the DOSN client on a high availability platform, e.g., their home gateway which is usually always online, instead of their computer.
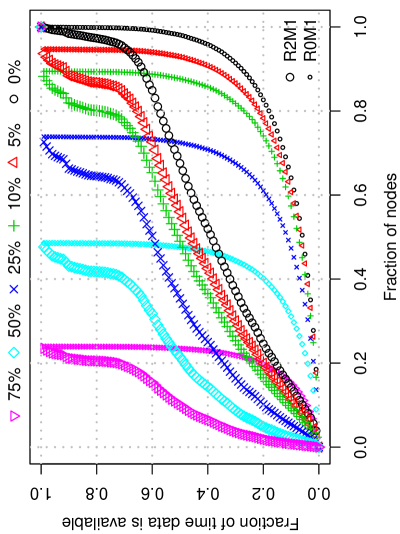
Figure 11 (legend on top) shows our baseline scenario for . Note, the compressed curves due to this fraction of always available nodes. Replacing only 5 % of the nodes, already increases the R2M1 availability of the 10 % top most available nodes to almost full availability.
V-G Considering longer time-frames
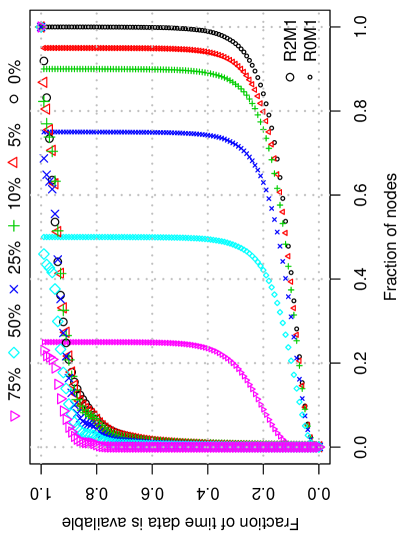
If in addition to always-on nodes, we consider a longer time frame until the data is requested, more contacts will have occurred and the content is spread to more replicas. Considering a time frame of a full week instead of 24 h, friends (R2M2) have almost a 100 % guarantee to obtain the desired data, as shown in Figure 12. In the most extreme case, looking at a 7 day experiment with 75 % always on nodes, each nodes availability is at least 80 %.
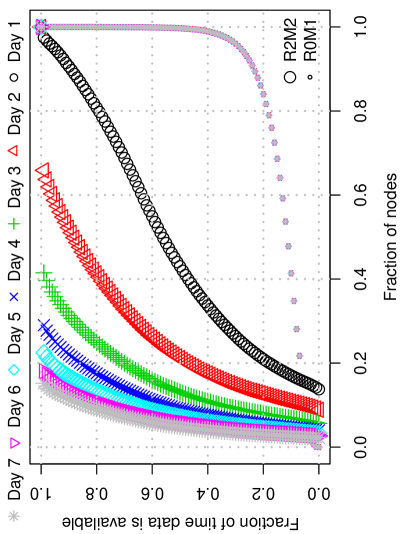
Observing such high availability we are interested in determining the convergence towards this full weeks results. Therefore, in Figure 13 we plot the R2M2 availability of DOSN contents for each day of the week. We observe steady but decreasing improvement on each day. Culminating in an almost vertical curve, at the last day of the week more than 80 % of all the nodes have full availability.
VI Related work
Two major strategies have been studied for data replication in distributed systems: replicate the whole file or replicate the pieces of a file. Works such as [18, 19] are examples of the first strategy. PAST [18] is a P2P file system built on top of Pastry [20], a DHT-based system. [19] explores different variations of the gain of replicating data to randomly chosen hosts on data availability. [19] shows that implicit replication that follows file popularity, as in Gnutella and BitTorrent, is not sufficient. The second replication approach splits a file into a pre-defined number of pieces and distributes them across the nodes. Examples of this approach include e. g., [21], or [22]. [23] extensively covers the related work in this area. Replicating the whole file and pieces of a file can be combined, as done in OceanStore [5] that uses a combination of different replication strategies for different data types, e. g., erasure codes for archiving. [10] compares the two replication strategies and finds that erasure codes lead to better availability than redundancy.
Availability has been studied in the context of P2P networks. [24] explores the properties of different coding schemes and finds that schemes which give better availability are in general the ones that have higher maintenance cost. [7] measures and analyzes host availability in a large structured P2P file sharing network. They find that host availability is dependent on the time of day, but not on other hosts. [25] confirmed the results of [7] in Gnutella and Napster. [26] also explore Gnutella and Napster but focus on the nature of end-hosts, and find they are very heterogeneous, e. g., regarding access bandwidth and their limited cooperation.
DOSNs have gained popularity in the research community in the recent years, aimed at giving back users control over their data. Most DOSN projects concentrate on the question of access rights management and encryption. They rely on servers or other external services to guarantee data availability. Others use social links for trust but do not exploit it for DOSN data availability. Tribler [6] is a file sharing system built on top of a social overlay. It uses a complex replication system to ensure the best possible availability of data. Persona [2] relies on external storage services that can be anything from a server to an Amazon cloud account per user. Persona enables privacy by introducing a fine grained system that users can use to manage access to their data. Diaspora [3] recently obtained much attention from the press. From the users viewpoint, Diaspora appears to be a common server-based OSN. However, data can be encrypted and everyone can set up a server for Diaspora, so that availability is ensured by many distributed servers. SuperNova [27] is an architecture for a DOSN that solves the availability issue by relying on super-peers that provide highly available storage.
VII Conclusion
In this paper, we proposed to exploit on the structure of the social graphs in DOSNs, to replicate users’ content. As the friends of a given user are interested in his content anyway, they can be used to provide replicas of his content. Through theoretical analysis as well as simulations based on data from OSN users, we study this natural replication scheme. We find that with such a replication scheme, the availability of the users content increases drastically, when compared to the online time of the users, e. g., by a factor of more than 2 for 90 % of the users. Furthermore, adding a small fraction of always online users to our scheme leads to high overall availability of users’ content.
As future work, we want to study the speed at which user content updates propagate through the graph of DOSNs, as well as compare our replication scheme with others that are not purely based on the friendship graph.
We also need to leave studies to future work that look at the overhead in terms of traffic, time, messaging generated by a system similar to the presented one. Such a system would need to be implemented, deployed and observed while in use to find out about those details.
References
- [1] S. Buchegger and A. Datta, “A case for P2P infrastructure for social networks - opportunities & challenges,” in Proceedings of the Sixth international conference on Wireless On-Demand Network Systems and Services (WONS’09), 2009, pp. 149–156.
- [2] R. Baden, A. Bender, N. Spring, B. Bhattacharjee, and D. Starin, “Persona: an online social network with user-defined privacy,” in Proceedings of the ACM SIGCOMM 2009 conference on Data communication (SIGCOMM ’09), 2009, pp. 135–146.
- [3] D. Grippi, M. Salzberg, R. Sofaer, and I. Zhitomirskiy, “Diaspora,” https://joindiaspora.com/.
- [4] A. Adya, W. J. Bolosky, M. Castro, G. Cermak, R. Chaiken, J. R. Douceur, J. Howell, J. R. Lorch, M. Theimer, and R. P. Wattenhofer, “Farsite: federated, available, and reliable storage for an incompletely trusted environment,” in Proceedings of the 5th symposium on Operating systems design and implementation (OSDI ’02), 2002, pp. 1–14.
- [5] J. Kubiatowicz, D. Bindel, Y. Chen, S. Czerwinski, P. Eaton, D. Geels, R. Gummadi, S. Rhea, H. Weatherspoon, W. Weimer, C. Wells, and B. Zhao, “OceanStore: An architecture for global-scale persistent storage,” in Proceeedings of the Ninth International Conference on Architectural Support for Programming Languages and Operating Systems (ASPLOS’00), 2000, pp. 190–201.
- [6] J. Pouwelse, P. Garbacki, J. Wang, A. Bakker, J. Yang, A. Iosup, D. Epema, M. Reinders, M. van Steen, and H. Sips, “Tribler: A social-based peer-to-peer system,” Concurrency and Computation: Practice and Experience, vol. 20, pp. 127–138, 2008.
- [7] R. Bhagwan, S. Savage, and G. M. Voelker, “Understanding availability,” in Proceedings of the Second International Workshop on Peer-to-Peer Systems (IPTPS’03), 2003, pp. 256–267.
- [8] J. R. Douceur, “Is remote host availability governed by a universal law?” SIGMETRICS Performance Evaluation Review, vol. 31, pp. 25–29, 2003.
- [9] D. Schiöberg, “A peer-to-peer infrastructure for social networks,” Diplomarbeit, TU Berlin, Germany, 2008.
- [10] H. Weatherspoon and J. Kubiatowicz, “Erasure coding vs. replication: A quantitative comparison,” in In Proceedings of the First International Workshop on Peer-to-Peer Systems (IPTPS’01), 2002, pp. 328–338.
- [11] S. Ramabhadran and J. Pasquale, “Analysis of long-running replicated systems,” in Proceedings of the 25th IEEE International Conference on Computer Communications (INFOCOM’06), 2006, pp. 1 –9.
- [12] G. Tredan, http://www.net.t-labs.tu-berlin.de/~gilles/availability.tgz.
- [13] H. Fritsch, “Studivz - Inoffizielle Statistiken vom Dezember 2006,” http://studivz.irgendwo.org/.
- [14] M. Cha, H. Haddadi, F. Benevenuto, and K. P. Gummadi, “Measuring user influence in twitter: The million follower fallacy,” in Proceedings of the 4th International AAAI Conference on Weblogs and Social Media (ICWSM’10), 2010.
- [15] F. Viger and M. Latapy, “Efficient and simple generation of random simple connected graphs with prescribed degree sequence,” in Computing and Combinatorics, LNCS 3595, 2005, gengraph is available at http://www-rp.lip6.fr/~latapy/FV/generation.html.
- [16] F. Schneider, A. Feldmann, B. Krishnamurthy, and W. Willinger, “Understanding online social network usage from a network perspective,” in Proceedings of the 9th ACM SIGCOMM conference on Internet measurement (IMC’09), 2009, pp. 35–48.
- [17] G. Maier, A. Feldmann, V. Paxson, and M. Allman, “On dominant characteristics of residential broadband internet traffic,” in Proceedings of the 9th ACM SIGCOMM conference on Internet measurement (IMC’09), 2009, pp. 90–102.
- [18] P. Druschel and A. Rowstron, “Past: A large-scale, persistent peer-to-peer storage utility,” in Proceedings of the Eighth Workshop on Hot Topics in Operating Systems (HotOS VIII), 2001, pp. 75–.
- [19] R. Bhagwan, D. Moore, S. Savage, and G. M. Voelker, “Replication strategies for highly available peer-to-peer storage,” in Future directions in distributed computing, 2003, pp. 153–158.
- [20] A. Rowstron and P. Druschel, “Pastry: Scalable, decentralized object location and routing for large-scale peer-to-peer systems,” in Proceedings of the IFIP/ACM International Conference on Distributed Systems Platforms (Middleware), 2001, pp. 329–350.
- [21] A. G. Dimakis, B. Godfrey, Y. Wu, M. J. Wainwright, and K. Ramchandran, “Network coding for distributed storage systems,” CoRR, vol. abs/0803.0632, 2008.
- [22] F. E. Oggier and A. Datta, “Self-repairing homomorphic codes for distributed storage systems,” CoRR, vol. abs/1008.0064, 2010.
- [23] A. G. Dimakis, K. Ramchandran, Y. Wu, and C. Suh, “A survey on network codes for distributed storage,” CoRR, vol. abs/1004.4438, 2010.
- [24] Q. Xin, T. Schwarz, and E. L. Miller, “Availability in global peer-to-peer storage systems,” in Distributed Data and Structures 6, Proceedings in Informatics, 2004.
- [25] J. Chu, K. Labonte, and B. N. Levine, “Availability and locality measurements of peer-to-peer file systems,” in Proceedings of ITCom: Scalability and Traffic Control in IP Networks, 2002.
- [26] S. Saroiu, P. K. Gummadi, and S. D. Gribble, “A measurement study of peer-to-peer file sharing systems,” in Proceedings of the Multimedia Computing and Networking (MMCN), 2002.
- [27] R. Sharma and A. Datta, “Supernova: Super-peers based architecture for decentralized online social networks,” CoRR, vol. abs/1105.0074, 2011.