Amplitude Analyses of D Decay Dalitz Plots
Abstract
We describe Dalitz plots arising in studies of -meson decays, and what we have learned from them in recent years. After some mention of technique and history, we focus on decay of the and mesons to the final state, and on decay to . Some mention of other Dalitz plots involving -meson decays is also made.
1 Introduction: General observations on Dalitz plots
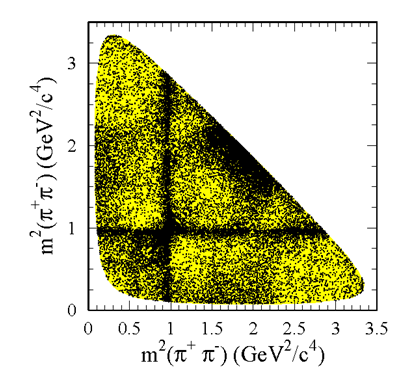
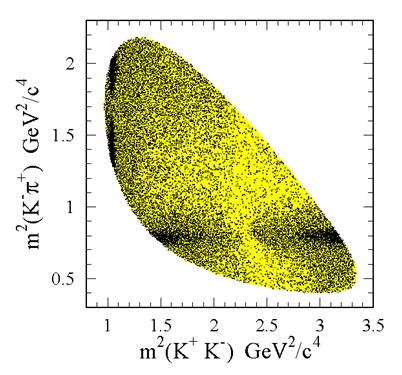
Typically, Dalitz plots are scatterplots of two kinematic variables describing the decay of a pseudo-scalar (P) meson to three pseudo-scalars, i.e., decays. Figures 1, 2, 4, and 5 show examples of such plots. Such kinematics should be described by 9 variables (for the three final state 3-momenta), but energy-momentum conservation cuts this down to five variables. Further, the lack of spin in the parent and daughters leads to a lack of preferred direction in space; thus two angles describing the direction of emission of any one daughter in the parent rest frame (RF) are inconsequential as is the angle described by the decay plane when rotated with this direction as the axis. Thus we reduce the five variables down to two non-trivial variables. The decay phase space can be shown to be uniform in either the energies of any two of the daughters in the parent RF, or in the mass-squareds of any two daughter pairs. Of course, in each case, the third corresponding variable is kinematically related to the two that are chosen for display in the plot. Finally, we should note that in case two or more daughters are identical the decay amplitude must be symmetric under interchange of those two, which leads to a symmetry in the Dalitz plot which can either be explicitly seen or the plot can be folded.
As we will see below the predicted uniform phase space of Dalitz plots can be exploited to bring out the dynamical features of the decays. For instance, resonances in the decay chain stand out as peaks in the two-dimensional plot (and are particularly easy to identify and study for the mass-squared version). Thus, Dalitz plot studies can be used to find resonances and to measure their parameters such as their masses and widths. Finally, since Dalitz plots reveal interference of decay amplitudes in such a spectacular way they may be used to search for CP-violating effects which also arise due to interference of decay amplitudes.
2 Fits to Dalitz plots
The decay amplitude squared leads to the distribution visible in a Dalitz plot. Parameters for such an amplitude can be fit using an using either a binned or, preferably, an unbinned fit.
A typical fit utilizes a model which describes the amplitude as a sum over complex amplitudes as follows:
| (1) |
where is the -wave amplitude and each is the amplitude describing the resonance of spin . Such a model is often called the “isobar” model for historical reasons, and the individual resonant amplitudes are in turn described by expressions such as
| (2) |
where and are form factors of the -meson and the resonance , and where and are the resonance Breit-Wigner (propagator) and spin factors, respectively. Of course, each of these factors is a function of kinematic quantities which are suppressed here in the interest of brevity.
The fits to data require that we integrate the differential decay rate over the phase space, and a simplyfying factor is that most of the integrals can be done just once since the complex coefficients factor out. Resonance parameters sometimes cause problems in the fitting procedure because integrals then have to be done every time these are changed.
Background contributions to the Dalitz plot have to be estimated either from data or Monte Carlo (MC). In principle, the -meson mass sidebands in data are a better source of knowledge for backgrounds, but do not fit kinematically into exactly the same Dalitz plot. If we apply a -mass constraint to these background regions to solve the kinematic problem with the plot boundaries, the two-body masses are slightly shifted, which causes problems in describing resonances. All these effects must be properly accounted for before a successful fit can be done. Variations in detector efficiency across the Dalitz plot must also be modeled in some way, typically as a smooth function of position in the plot. This is often done using a polynomial or an Artificial Neural Net fit to the data.
Finally, we should elaborate on the -wave term . While this is often taken to be just a complex constant, more recently experiments such as E791 [7] have experimented with a mass-dependent piece-wise linear “function”, or set of constants, instead. Surprisingly, this works reasonably well in the fits, i.e., the resulting constants vary smoothly with mass. This has come to be known as the “Model Independent Partial Wave Analysis” (MIPWA) technique.
3 Early Dalitz results
Since there are three flavors of -meson (, and ), and many possible daughter particles (neutral and charged , ) a large number of Dalitz plots can arise in -decays, but only a few of these have been studied. Such plots were first made in the 1980’s and 1990’s by the Mark II [1] experiment which observed a “non-uniform” density, by the Mark III [2] experiment which published a Dalitz plot analysis, and by the E691 [3] experiment which confirmed the main features of the previous fit to decays viz., the presence of a strong non-resonant amplitude, and the fact that the isobar model gives a poor overall fit.
The fit problems were generally traced to the -wave amplitudes and explored further by the E791 experiment. Early work in E791 resolved the fit issues by introducing a resonance for the system [4], and a resonance [5] for the system.
Later, following a suggestion by W.M. Dunwoodie of SLAC, E791 pursued a model-independent way to compare Dalitz decay data to LASS results on scattering [6]. This E791 study, pioneered by B. Meadows, proved to be a success for this MIPWA technique [7]. In the meanwhile, the FOCUS experiment found an acceptable fit to decays using a K-matrix description of the S-wave with no pole.
4 Recent Dalitz Plot results
More recently, higher statistics data became available from the CLEO, CLEO-c, BaBar and Belle experiments. Some of these fits are described below. Also, -decay data from these experiments have been used to study CP-violation in decays and also in decays.
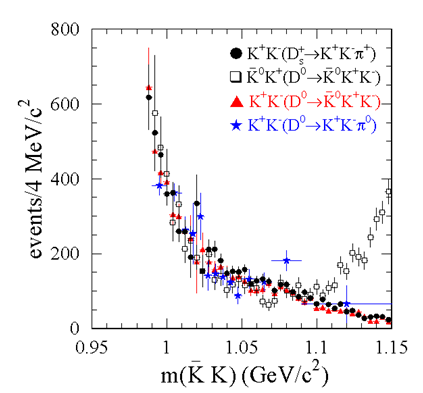
Shown in Fig. 2 is the Dalitz plot from BaBar [20]. Using moments of Legendre polynomials of helicity angles, BaBar extracted the , magnitudes and relative phase in the region (0.99 1.15) GeV/ and found that the -wave is essentially pure , and is therefore described as such to extract a binned S-wave amplitude. Comparing -wave intensities from different Dalitz plots (see Fig. 3) one finds good agreement except for the amplitude above 1.1 GeV/. Figure 1 shows the BaBar decays Dalitz plot [21].
5 Search for CPV in decays
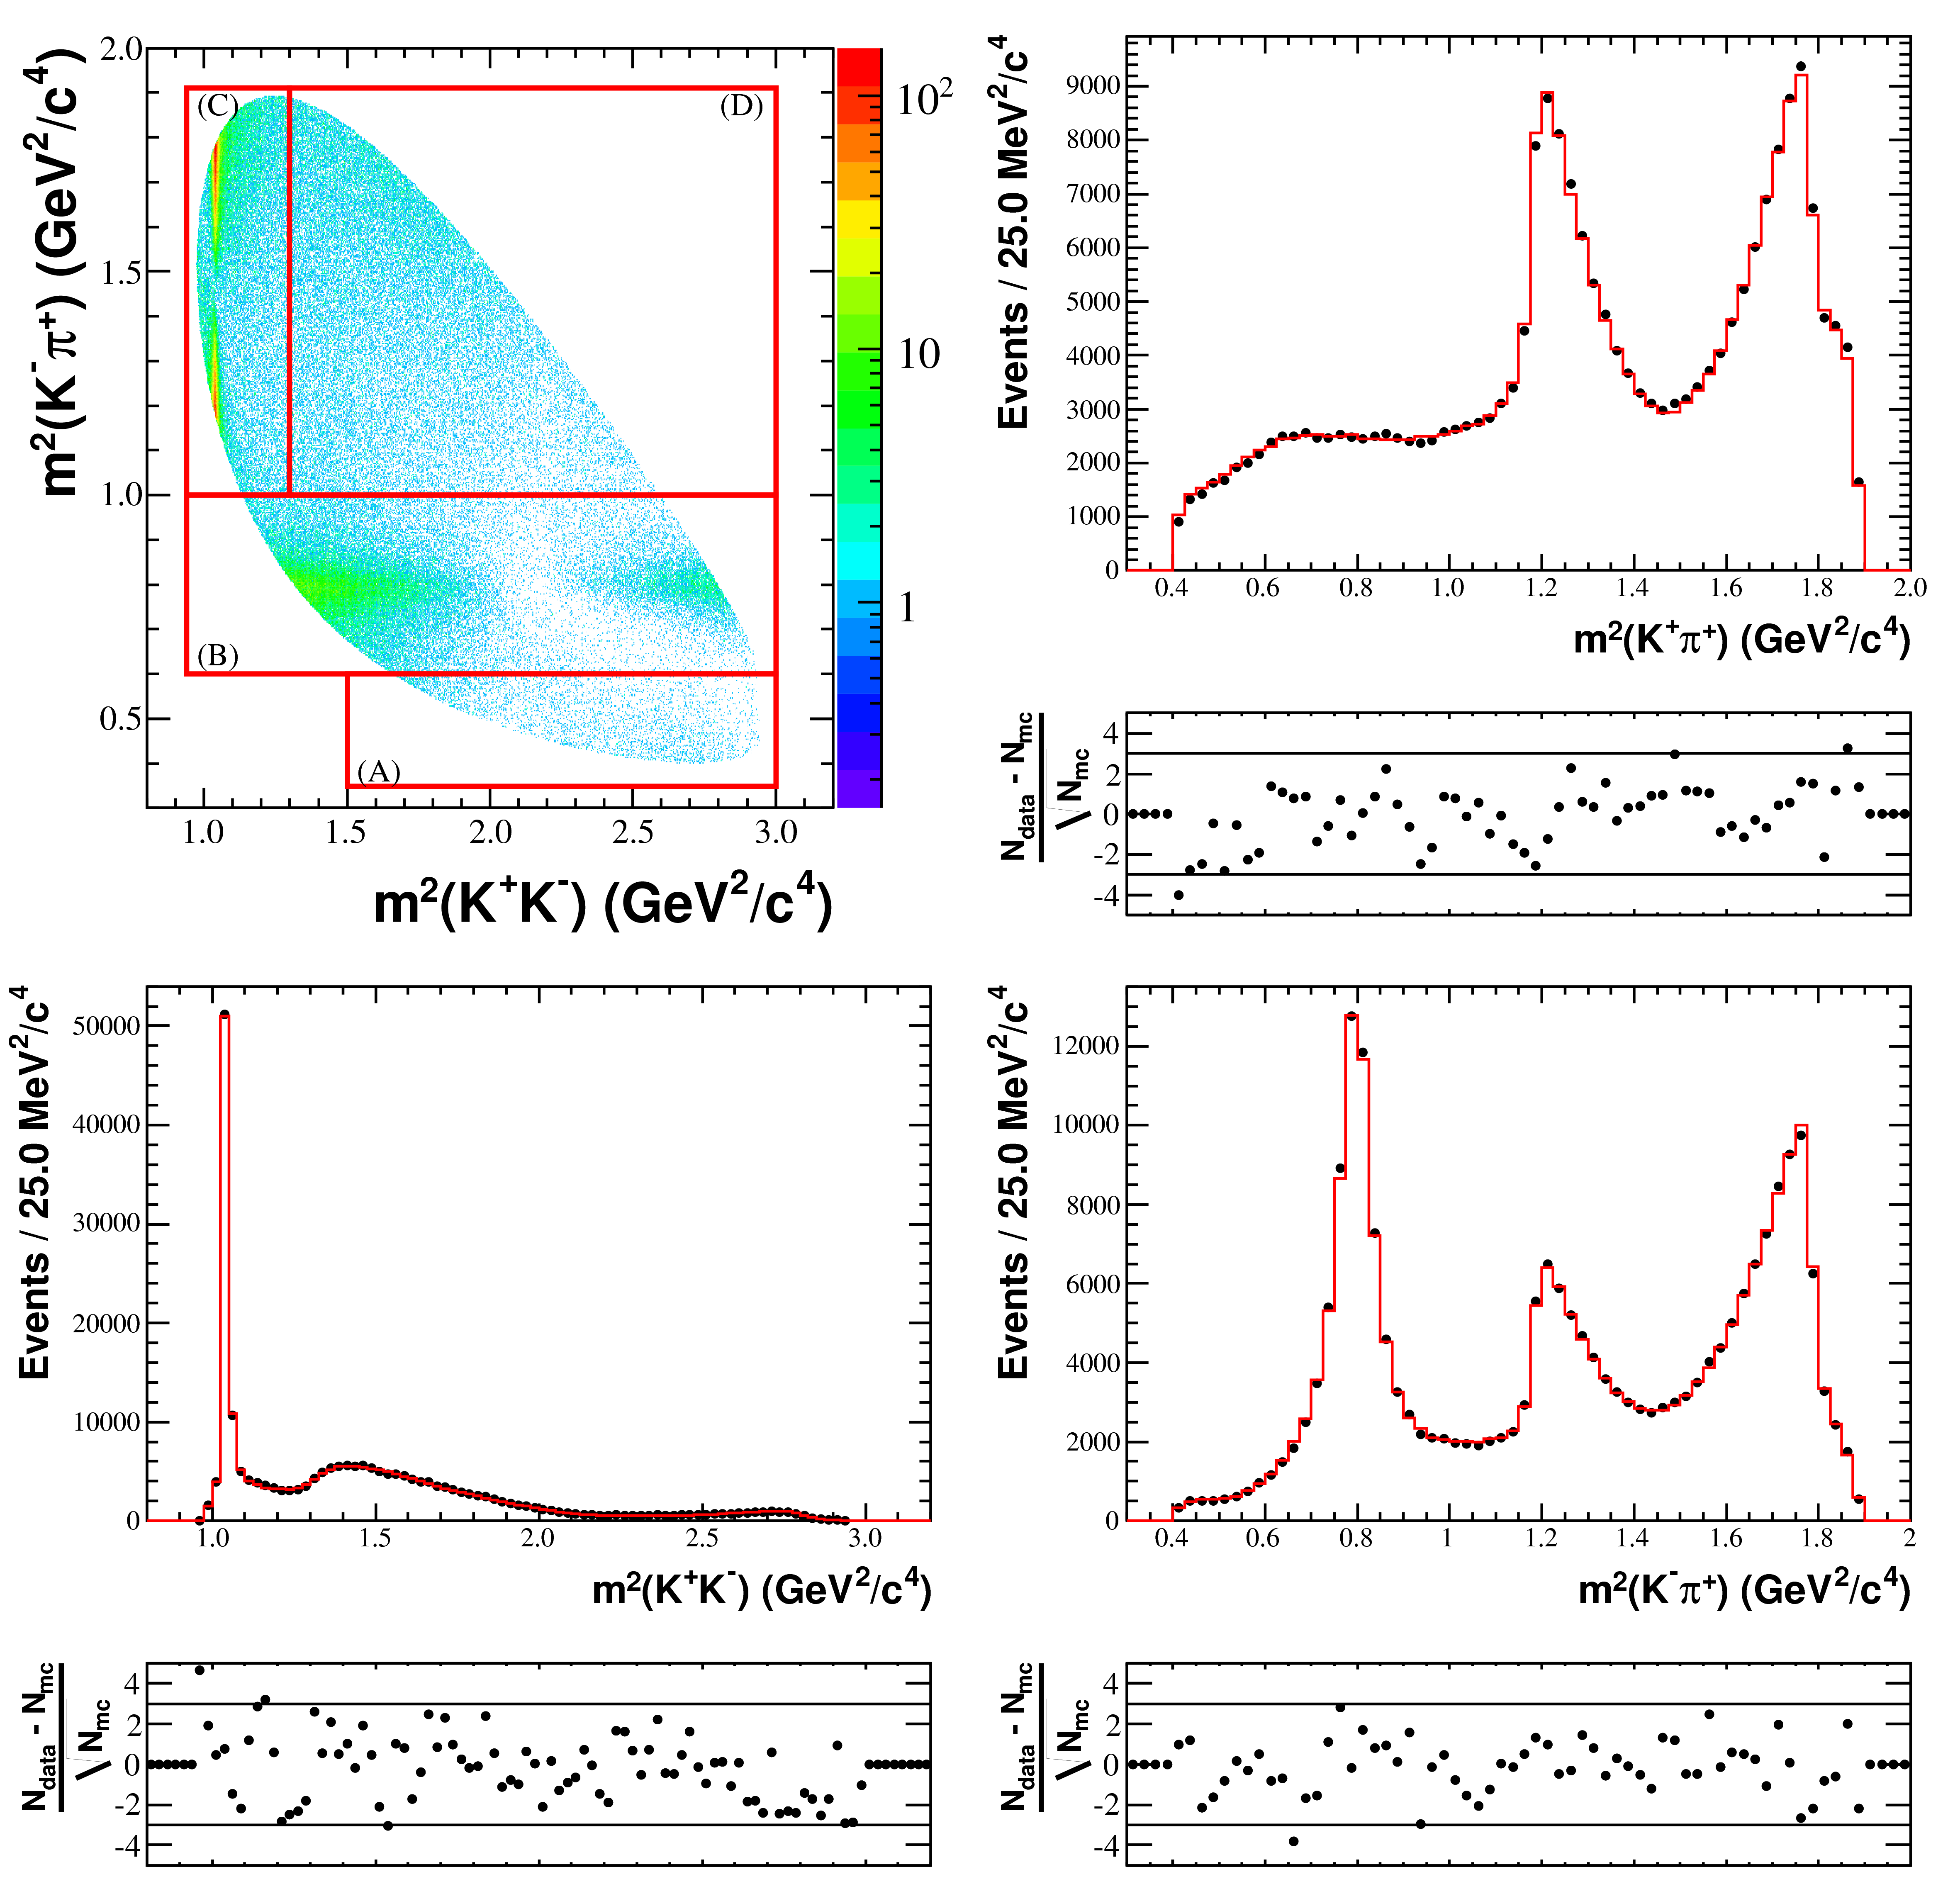
Most recently there has been an analysis from BaBar on the search for CP-violation in DCS decays. Figure 4 shows the combined Dalitz plot for these decays. Searches for violation (V) in charm meson decays provide a probe of physics beyond the Standard Model (SM). Singly Cabibbo-suppressed (SCS) decays can exhibit direct asymmetries due to interference between tree-level transitions and penguin-level transitions if there is both a strong and weak phase difference between the two amplitudes. In the SM, the resulting asymmetries are suppressed by . Measurement of a larger asymmetry could be caused by the enhancement of penguin amplitudes in decays due to final-state interactions [8, 9] or by New Physics [10, 11].
The LHCb and CDF collaborations recently reported evidence for the difference in asymmetry of the time-integrated and decay rates [12, 13]. In the decay mode the CLEO-c collaboration has reported [26] that the asymmetry defined by
| (3) |
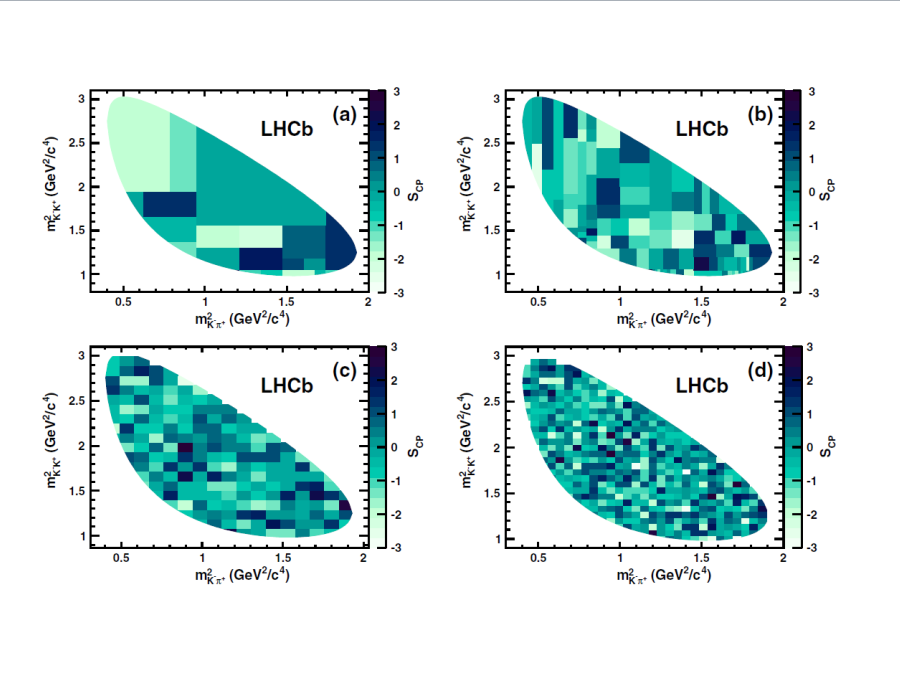
is found to be i.e., consistent with zero. The LHCb collaboration has also reported on a search in this decay mode; Fig. 5 shows the asymmetry in various-sized regions of the Dalitz plot from that experiment [27]. After taking account of the overall rate, they do not find any evidence for violation in the differential decay rate. Searches for violation in other SCS decays with identical transitions and are relevant for understanding the origin of V [14, 15, 16].
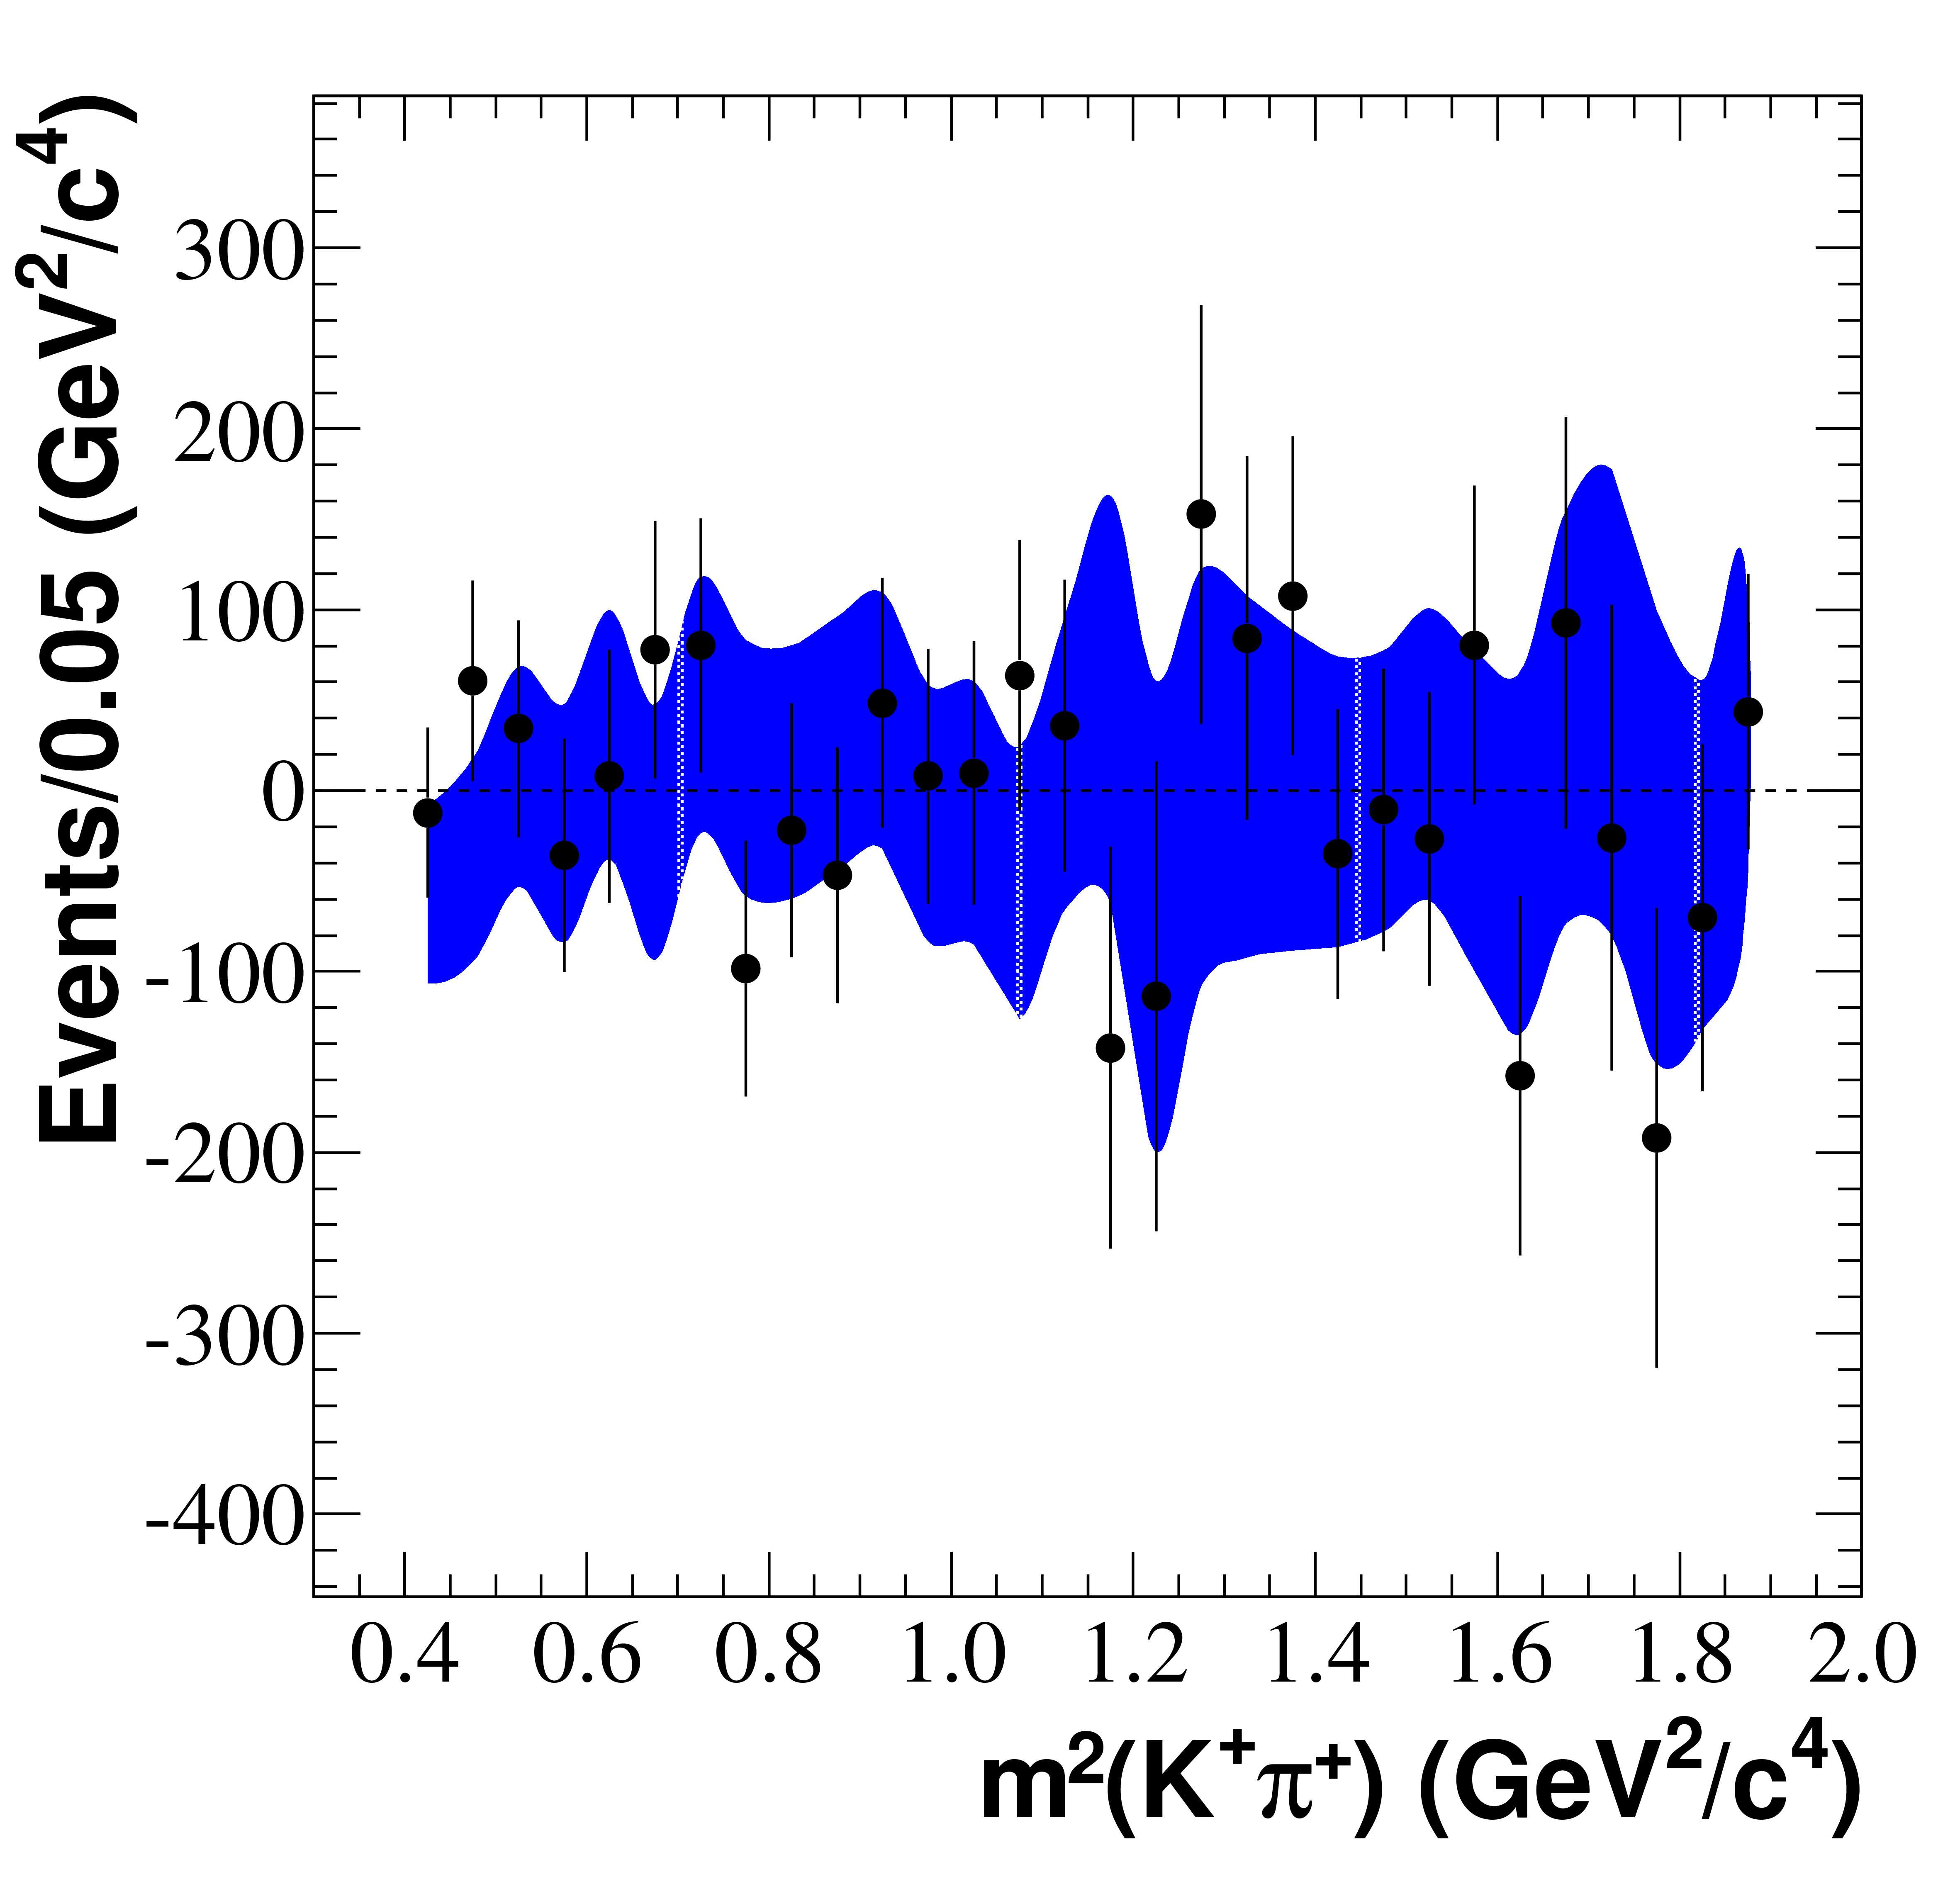
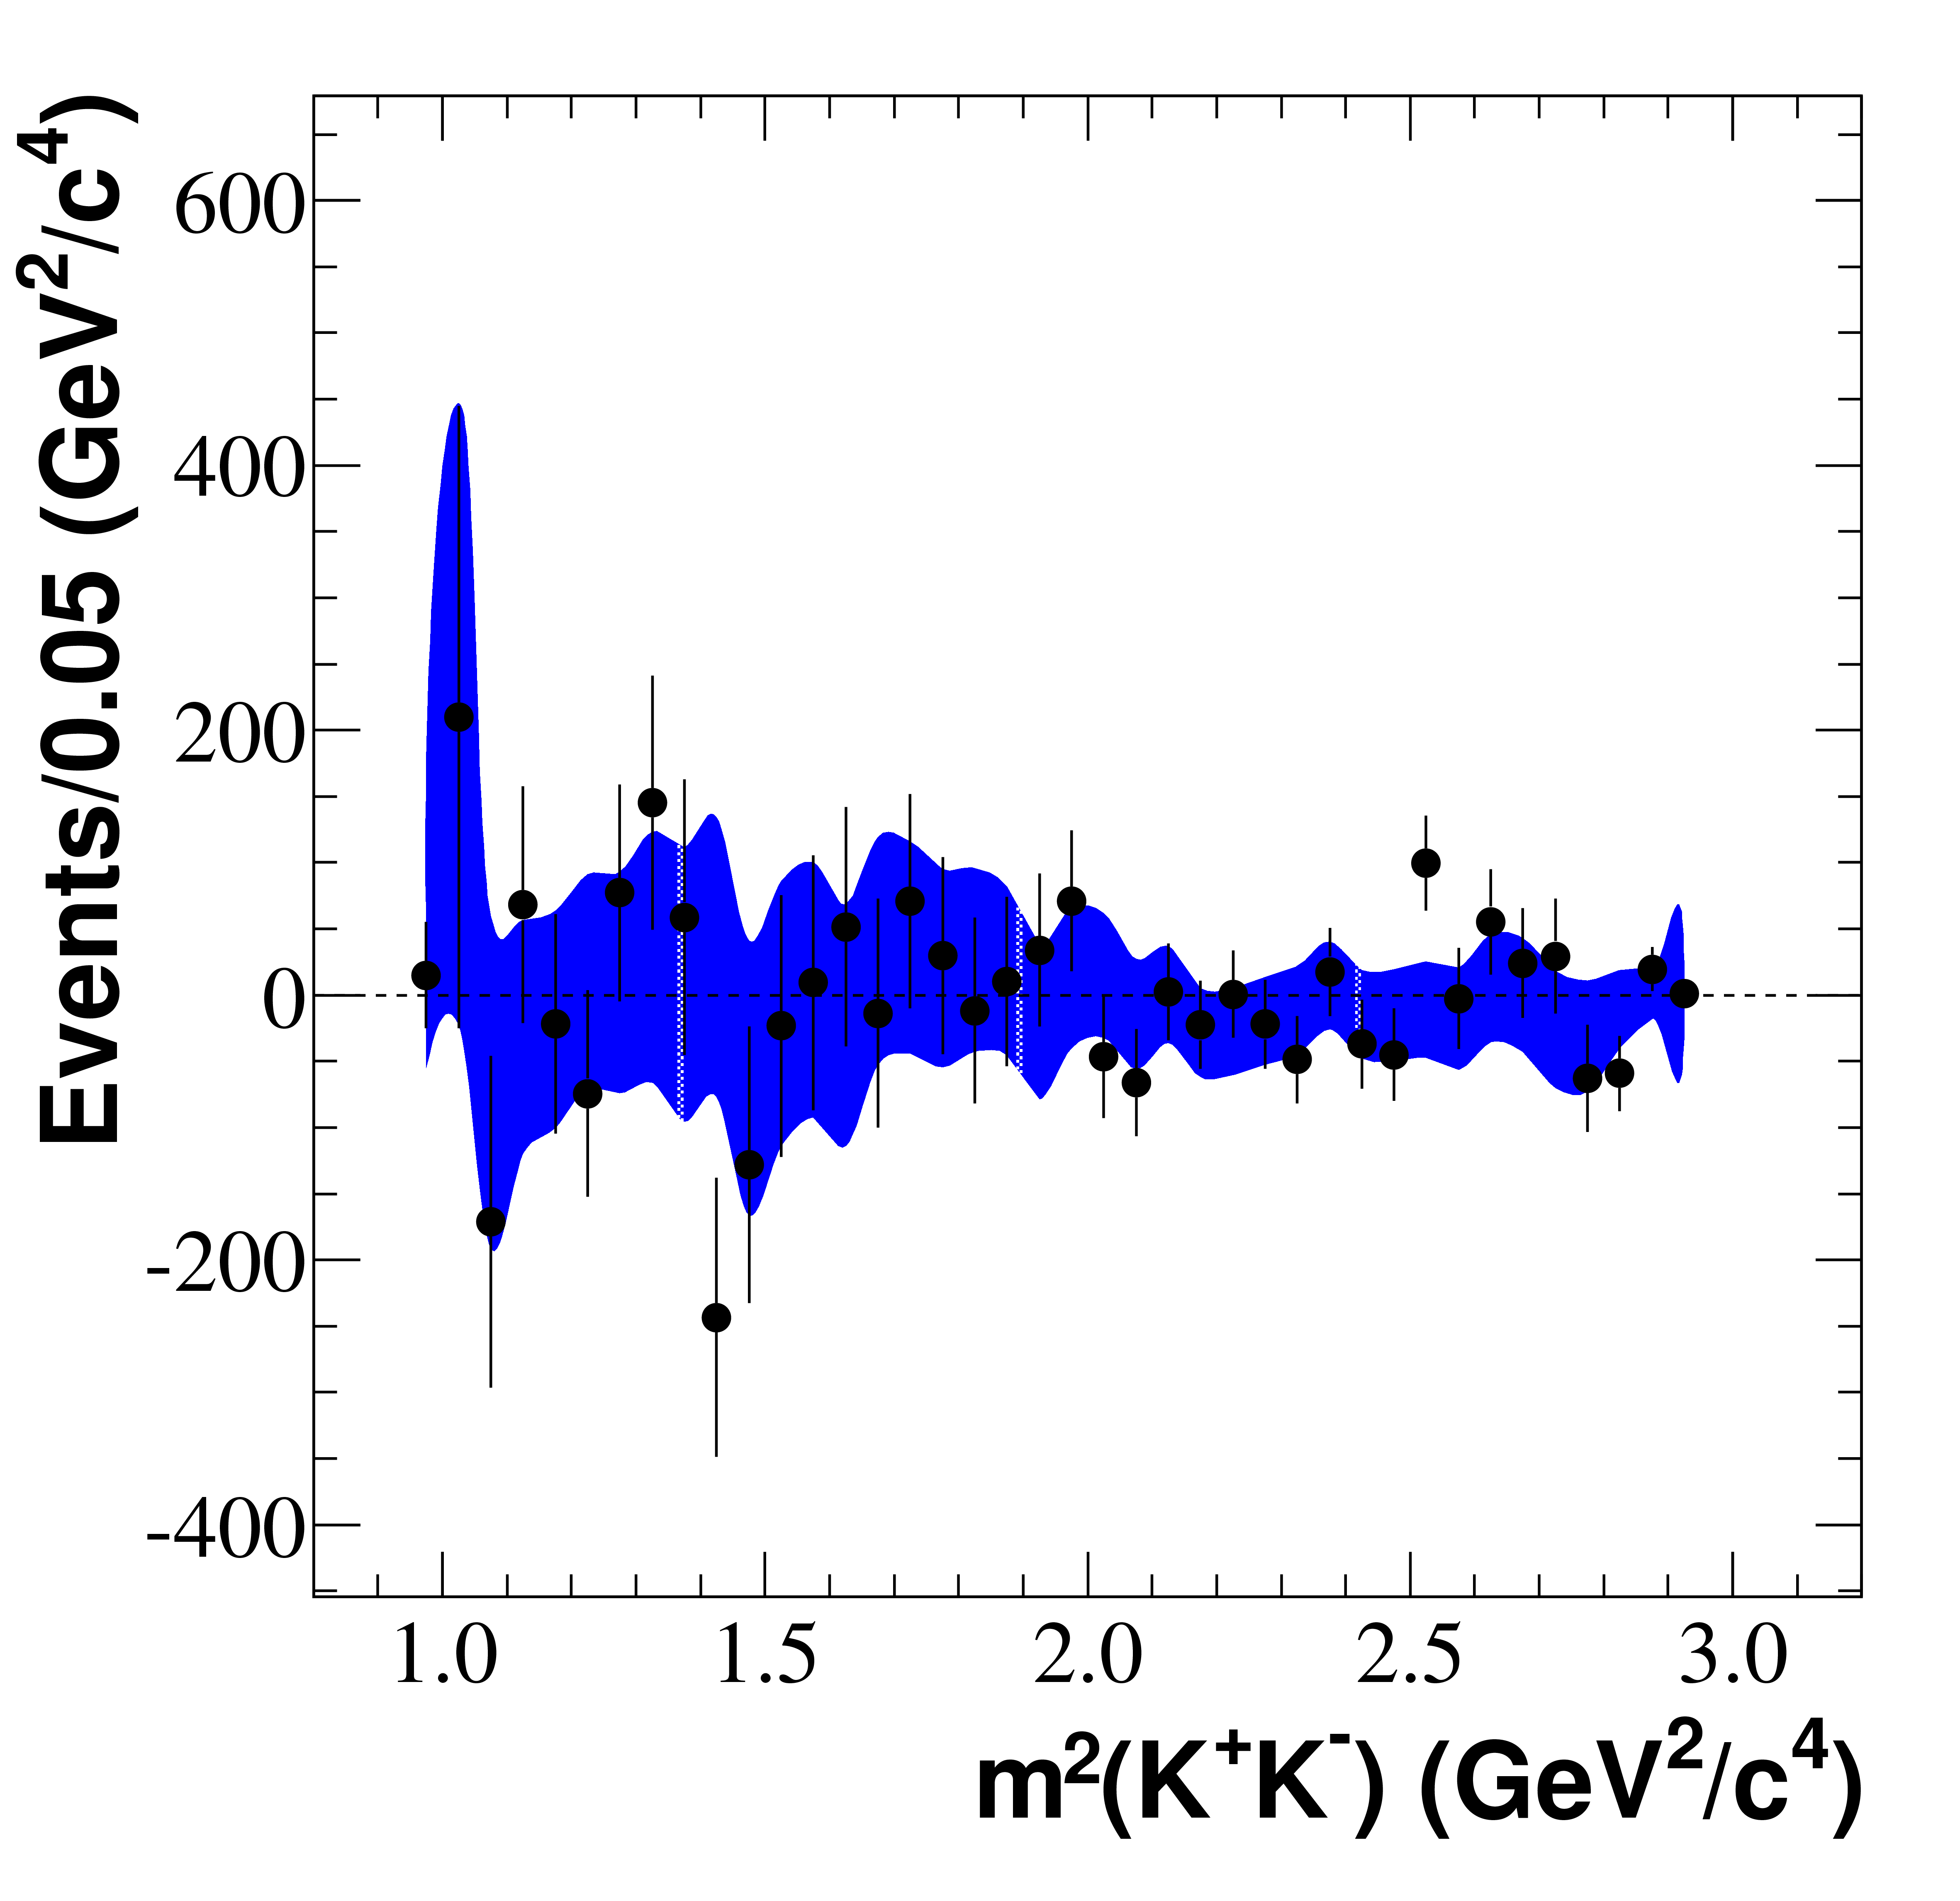
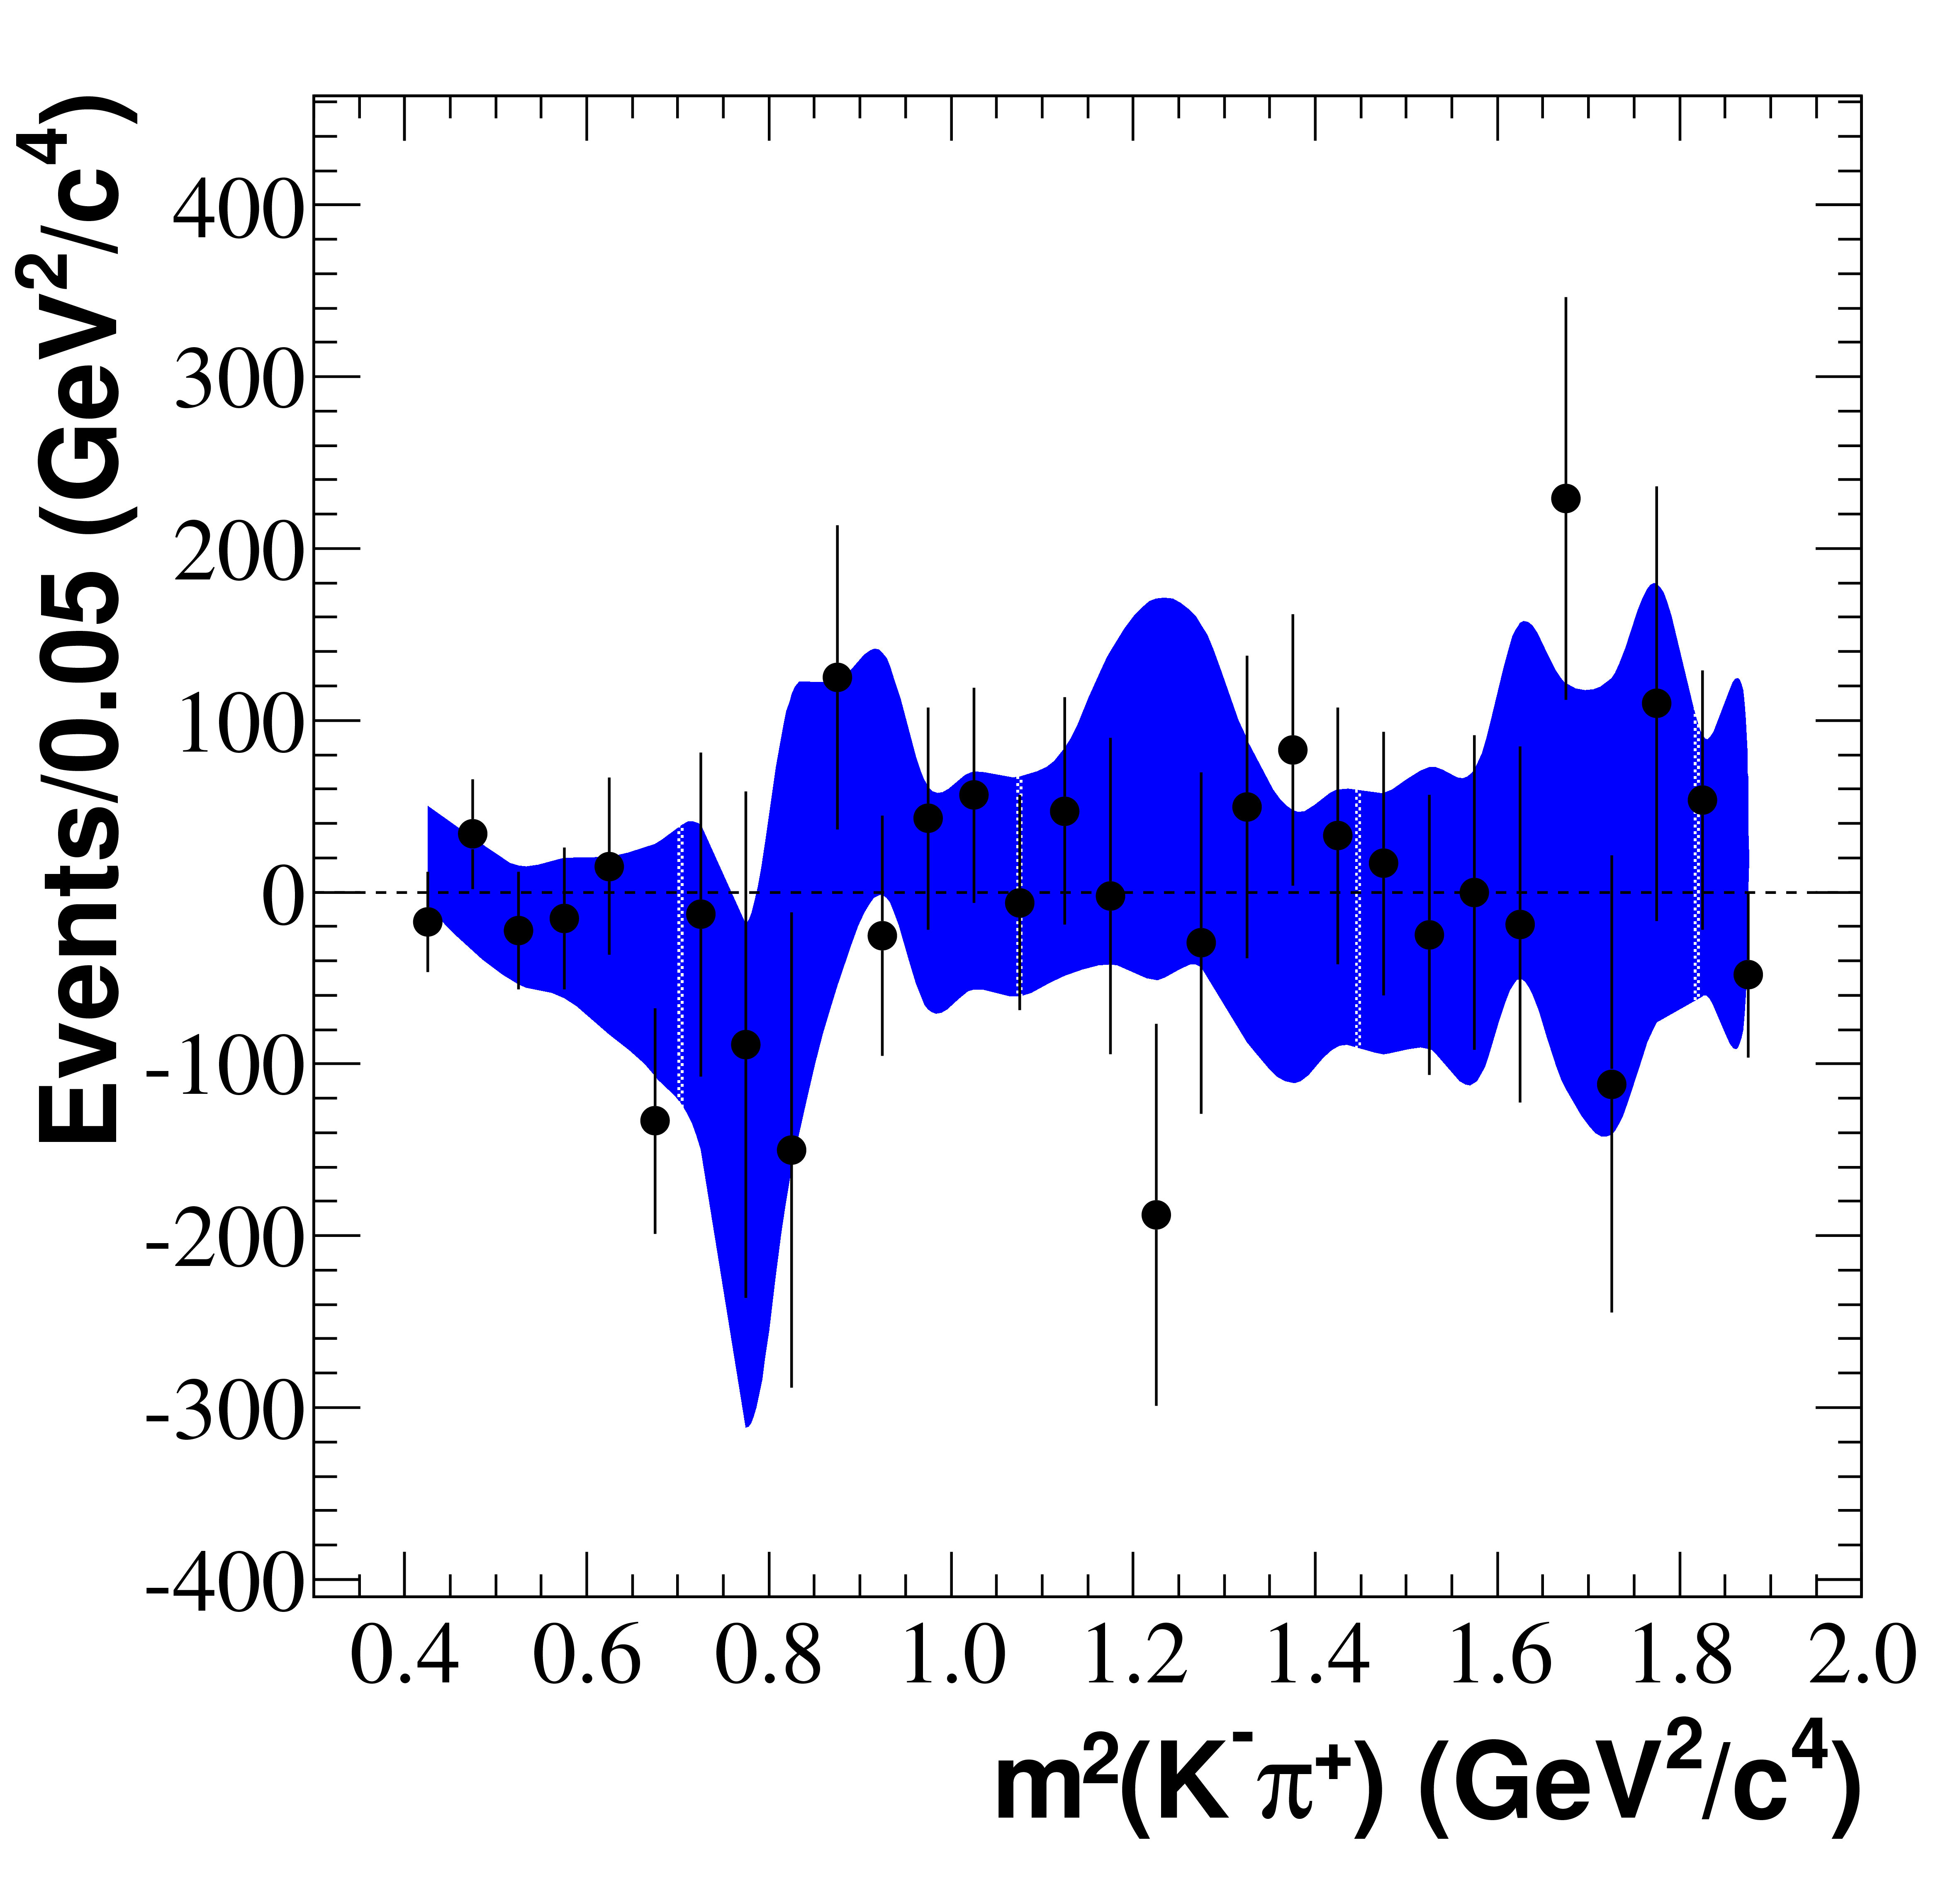
The BaBar analysis does not find any evidence for violation in the SCS decay . The integrated asymmetry is found to be . We find also that the asymmetries in four regions of the Dalitz plot are consistent with zero, and that the and Dalitz plots are consistent with no asymmetry with a probability of 72, according to the analysis of the normalized residuals of the and Dalitz plot divided into 100 equally populated bins. Finally, we find no evidence for asymmetry in decays through various intermediate states with a study of the two-body mass distributions as seen in Fig. 6, and with a parameterization of the Dalitz plot for which the measured asymmetries in amplitudes are listed in Table 1.
| Resonance | r () | |
|---|---|---|
| 0. (FIXED) | 0. (FIXED) | |
| NR | ||
6 Acknowledgements
I would like to thank my collaborators on BaBar and at SLAC for making this talk possible, and particularly Brian Meadows and Bill Dunwoodie for all their innovative work on Dalitz plots. Most of all though, I would like to thank Ryan White whose tireless work on the search for CP violation in decays has set a new bar for this kind of study. This work was made possible by a grant from the U.S. Department of Energy.
References
- [1] R. H. Schindler et al., Phys. Rev. D 24, 78 (1981).
- [2] J. Adler et al., Phys. Lett. B 196, 107 (1987).
- [3] J. C. Anjos et al., Phys. Rev. D 48, 56 (1993).
- [4] E. M. Aitala et al., Phys. Rev. Lett. 89, 121801 (2002).
- [5] E. M. Aitala et al., Phys. Rev. Lett. 86, 770 (2001).
- [6] D. Aston et al., Nucl. Phys. B 296, 493 (1988).
- [7] E. M. Aitala et al., Phys. Rev. D 73, 032004 (2006).
- [8] B. Bhattacharya, M. Gronau, and J. Rosner, Phys. Rev. D 85, 054014 (2012).
- [9] H. Cheng and C. Chiang, Phys. Rev. D 85, 034036 (2012).
- [10] Y. Grossman, A. L. Kagan, and Y. Nir, Phys. Rev. D 75, 036008 (2007).
- [11] M. Artuso, B. Meadows, and A. A. Petrov, Annu. Rev. Nucl. Part. Sci. 58, 249 (2008).
- [12] R. Aaij et al. (LHCb Collaboration), Phys. Rev. Lett. 108, 111602 (2012).
- [13] T. Aaltonen et al. (CDF Collaboration), Phys. Rev. D 85, 012009 (2012).
- [14] Y. Grossman, A. L. Kagan, J. Zupan, Phys. Rev. D 85, 114036 (2012).
- [15] G. F. Giudice, G. Isidori, P. Paradisi, JHEP 1204, 060 (2012).
- [16] E. Franco, S. Mishima, L. Silvestrini, JHEP 1205, 140 (2012).
- [17] J.M. Link et al., Phys. Lett. B 585, 200 (2004).
- [18] K.M. Watson, Phys. Rev. 88, 1163 (1952).
- [19] W. Hoogland et al., Nucl. Phys. B 126, 109 (1977).
- [20] B. Aubert et al., Phys. Rev. D 83, 052001 (2011).
- [21] B. Aubert et al., Phys. Rev. D 79, 032003 (2009).
- [22] B. Aubert et al., Phys. Rev. D 72, 052008 (2005), and B. Aubert et al., Phys. Rev. D 76, 011102 (R) (2007).
- [23] R. E. Mitchell et al., Phys. Rev. D 79, 072008 (2009).
- [24] B. Bhattacharya, M. Gronau, and J. Rosner, Phys. Rev. D 85, 054014 (2012).
- [25] H. Cheng and C. Chiang, Phys. Rev. D 85, 034036 (2012); Erratum-ibid. D 85 079903 (2012).
- [26] P. Rubin et al., Phys. Rev. D 78, 072003 (2008).
- [27] R. Aaij et al., Phys. Rev. D 84, 112008 (2011).
- [28] J.-P. Lees et al.., to be submitted to Phys. Rev. D.