Nuclear structure of 30S and its implications for nucleosynthesis in classical novae
Abstract
Background: The uncertainty in the 29P()30S reaction rate over the temperature range of 0.1 1.3 GK was previously determined to span 4 orders of magnitude due to the uncertain location of two previously unobserved 3+ and 2+ resonances in the Ex 4.7 – 4.8 MeV region in 30S. Therefore, the abundances of silicon isotopes synthesized in novae, which are relevant for the identification of presolar grains of putative nova origin, were uncertain by a factor of 3. Purpose: (a) To investigate the level structure of 30S above the proton threshold (4394.9(7) keV) via charged-particle spectroscopy using the 32S()30S reaction and in-beam -ray spectroscopy using the 28Si(3He, )30S reaction to calculate the 29P()30S reaction rate. (b) To explore the impact of this rate on the abundances of silicon isotopes synthesized in novae. Method: Differential cross sections of the 32S()30S reaction were measured at 34.5 MeV. Distorted Wave Born Approximation (DWBA) calculations were performed to constrain the spin-parity assignments of the observed levels, including the two astrophysically important levels. An energy level scheme was deduced from - coincidence measurements using the 28Si(3He, )30S reaction. Spin-parity assignments based on measurements of -ray angular distributions and - directional correlation from oriented nuclei were made for most of the observed levels of 30S. Results: The resonance energies corresponding to the states with 4.5 MeV 6 MeV, including the two astrophysically important states predicted previously, are measured with significantly better precision than before. The spin-parity assignments of both astrophysically important resonances, as well as the existence of a previously observed tentative state at 5.95 MeV are confirmed. The uncertainty in the rate of the 29P()30S reaction is substantially reduced over the temperature range of interest. Finally, the influence of this rate on the abundance ratios of silicon isotopes synthesized in novae are obtained via 1D hydrodynamic nova simulations. Conclusions: The uncertainty in the 29P()30S reaction rate is reduced to the point that it no longer affects the silicon isotopic abundance ratios significantly, and thus the results of our nova hydro simulation for the nucleosynthesis in the Si-Ca mass region are more reliable than before.
pacs:
26.30.Ca,25.40.Hs,23.20.En,23.20.LvI Astrophysical Motivation
Classical nova outbursts are caused by explosive hydrogen burning as a result of a thermonuclear runaway in the envelope accreted from a main sequence star onto a white dwarf in a close semi-detached binary system. Simulations Iliadis et al. (2002) show that peak temperatures reached in the thermonuclear runaway are typically in the 0.1 – 0.4 GK range, and the ejecta show significant nuclear processing. The dominant nuclear reaction flow proceeds close to the valley of stability on the proton-rich side and is dominated by a series of () and () reactions, as well as -decays. Classical nova outbursts are thought to be the major source of 15N, 17O and to some extent 13C in the Galaxy Jos
et al. (2006) and contribute to the abundances of other species with masses up to 40, including 26Al.
The ejecta of classical novae are studied by systematic infrared observations Gehrz et al. (1998); Starrfield et al. (2007) which reveal episodes of dust formation following a nova outburst. Several candidate presolar grains of nova origin have been found Amari et al. (2001); Amari (2002), most of which are of silicon carbide (SiC) type. These grains show abundance anomalies for some isotopes (compared with the average solar system isotopic abundances), e.g., close to or slightly lower than solar 29Si/28Si ratios and higher than solar 30Si/28Si ratios Jos
et al. (2004).
In order to reach a quantitative agreement between the isotopic abundances observed in the presolar grains Amari (2002) and those predicted by simulations Jos
et al. (2004), nova nucleosynthesis models require some dilution. Thus, the mixing between the material in nova ejecta and the solar-like material must be understood to tighten the links between nova nucleosynthesis and presolar grains. Also, a better knowledge of the rates of the reactions that affect nova nucleosynthesis is required to better understand the origin of the isotopic ratios observed in the nova presolar grain candidates. Improving the reaction rates can also constrain nova models and simulations, and amend our understanding of nova nucleosynthesis Starrfield et al. (2007).
According to hydrodynamic classical nova simulations Jos
et al. (2004), the dominant nova nucleosynthetic path is sensitive to the chemical composition of the white dwarf, the extent to which convective mixing occurs between the material of the white dwarf’s core and that of the envelope, and the thermal history of the envelope. Such questions can be partially answered via analysis of the Si isotopic abundance ratios (29Si/28Si and 30Si/28Si) in SiC presolar grains of potential nova origin Jos
et al. (2004), and thus such ratios are of specific significance to this work’s motivation.
To explore and improve the silicon isotopic abundances in nova ejecta predicted from nova simulations, the thermonuclear reactions that most strongly affect the synthesis of silicon in novae must be determined and their rates understood. One such reaction is 29P()30S. Over the temperature range characteristic of explosive nucleosynthesis in novae (0.1 – 0.4 GK), the rate of the 29P()30S reaction competes with that of 29P() decay. If in this temperature range the 29P()30S reaction rate is faster than the 29P() decay rate, and if the 30P() decay rate competes favorably with the rate of proton capture on 30P Jos
et al. (2001), the net effect is an increase in the production of 30Si via the 29P()30S()30P()30Si reaction sequence, as well as a simultaneous decrease in the abundance of 29Si, which is the product of the -decay of 29P. Therefore, an excess in 30Si together with the depletion in 29Si observed in some SiC presolar grains could indicate imprints of a nova origin. In a study on the sensitivity of nova nucleosynthesis to uncertainties in thermonuclear reaction rates Iliadis et al. (2002), a change in the 29P()30S rate by 104, which was consistent with the rate limits from Ref. Iliadis et al. (2001), resulted in changes in 29,30Si abundances by a factor of 3.
In the temperature range characteristic of explosive hydrogen burning (0.1 1.3 GK), the Gamow window of the 29P()30S reaction spans 700 – 1770 keV, where there is a low level density. Thus, the rate depends on the properties of isolated and narrow 29P + resonances corresponding to 30S (t1/2 1175.9(17) ms Souin et al. (2011)) proton unbound states with 4.5 6 MeV.
The 29P()30S rate was evaluated by Wiescher and Grres Wiescher and
Grres (1988), and more recently by Iliadis et al. Iliadis et al. (2001); Iliadis
et al. (2010a) and Bardayan et al. Bardayan et al. (2007). The rate calculated by Iliadis et al. Iliadis et al. (2001) was found to be dominated by the 3 and 2 proton unbound states in 30S. The excitation energies corresponding to these two unobserved resonances were predicted Iliadis et al. (2001) using the Isobaric Multiplet Mass Equation (IMME) to be 4733(40) keV and 4888(40) keV for the states with 3+ and 2+, respectively. Such large uncertainties in the resonance energies, , resulted in an uncertainty in the rate which spanned 4 orders of magnitude Iliadis et al. (2001). Prior to this prediction, several experiments had been performed to study the structure of 30S Paddock (1972); Caraça et al. (1972); Kuhlmann et al. (1973); Yokota et al. (1982); Fynbo et al. (2000). However, the two astrophysically important states predicted by Iliadis et al. Iliadis et al. (2001) were not observed in any of the previous experiments.
A direct measurement of the 29P()30S reaction is currently not feasible because no 29P radioactive ion beam with the required beam intensity ( 108 pps) is available. Thus, following the prediction by Iliadis et al. Iliadis et al. (2001), attempts were made to find these two states via indirect methods Galaviz et al. (Geneva, 2006); Bardayan et al. (2007); Fig ; O’Brien et al. (2009); Galaviz et al. (2010). Bardayan et al. Bardayan et al. (2007) remeasured the excitation energies and spin-parity assignments of the states of 30S up to 7.1 MeV by means of the 32S()30S two-nucleon transfer reaction. As a result, a state at 4704(5) keV was discovered and was proposed to be the predicted 3 state. However, no trace of the other important level was found.
Shortly thereafter, we performed two separate experiments, each with two phases, to determine the excitation energies and spin-parity assignments of several states of 30S, which were populated via the 32S()30S and 28Si(3He, )30S two nucleon transfer reactions.
In Ref. Setoodehnia et al. (2010), the resonance energies corresponding to six proton unbound states with 5.5 MeV in 30S were presented, including both astrophysically important states predicted by Iliadis et al. Iliadis et al. (2001) one of which was observed for the first time. Since then, we have performed a new 32S()30S measurement with a different target (phase II), and have improved upon the analysis of the existing data. Phase I of our 28Si(3He, )30S experiment was performed with the sole purpose of determining via -ray coincidence measurements the energies of the two important resonances predicted by Iliadis et al. Iliadis et al. (2001), and phase II was carried out to measure the -ray angular distributions and - angular correlations from oriented nuclei to infer the spins of the observed 30S states. The results of phase I of our 28Si(3He, )30S experiment are also published Setoodehnia et al. (2011).
The present work discusses in detail the experimental setups and data analyses for the second phases of our 32S()30S and 28Si(3He, )30S experiments, and presents our unpublished data for the first phase of our 32S()30S experiment. This work thus presents our combined final results on the energies and spin-parity assignments of the observed 30S states, the most updated 29P()30S reaction rate calculated via a newly developed Monte Carlo method, as well as the impact of this rate on the abundance ratios of silicon isotopes synthesized in novae. Therefore, the results in the present paper supersede those of our previous publications Setoodehnia et al. (2010, 2011).
II Experiments
II.1 The 32S()30S experiment
II.1.1 Experimental setup and data analysis: phase II
The experiment was performed at the Wright Nuclear Structure Laboratory (WNSL) at Yale University. A proton beam was accelerated, using the ESTU tandem Van de Graaff accelerator, to 34.5 MeV (/ 6 10-4) Setoodehnia et al. (2010); Setoodehnia (2011).
The beam impinged on a 55.9 5.6 g/cm2 isotopically pure (99.9% enriched) 12C foil implanted with 10.4 0.4 g/cm2 of 32S. This target was fabricated specifically to reduce the relatively flat background produced by the Cd, where refers to natural, component of the CdS target used in phase I of our 32S()30S experiment Setoodehnia et al. (2010). The production procedure for the implanted target is described elsewhere Setoodehnia (2011); Lennard et al. (2011). The thicknesses of the 32S and 12C layers in the implanted target were obtained through a Rutherford backscattering measurement Setoodehnia (2011); Lennard et al. (2011).
In addition to the aforementioned target, a free-standing 311-g/cm2 natural Si foil was used for calibration purposes. Also, a stand alone 40-g/cm2-thick 99.9% isotopically enriched 12C foil was used to measure the background from () reactions on the carbon substrate in the implanted target. The method of measuring the thicknesses of these targets is described in Ref. Setoodehnia (2011).
The reaction ejectiles were dispersed according to their momenta with an Enge split-pole magnetic spectrograph, with vertical and horizontal aperture settings of 40 mrad, and 30 mrad, respectively. The study was carried out at multiple angles with magnetic field strengths of 10 kG for 22∘; 9.5 kG for 27.5∘; and 9.2 kG for 45∘, where is the scattering angle in the laboratory system.
The tritons were focused at the spectrograph’s focal plane, where they were detected with an isobutane-filled position sensitive ionization drift chamber Setoodehnia (2011), together with a plastic scintillator. The ionization chamber measured the positions along the focal plane and energy losses () of the tritons. Those that passed through this detector deposited their residual energy () in the plastic scintillator.
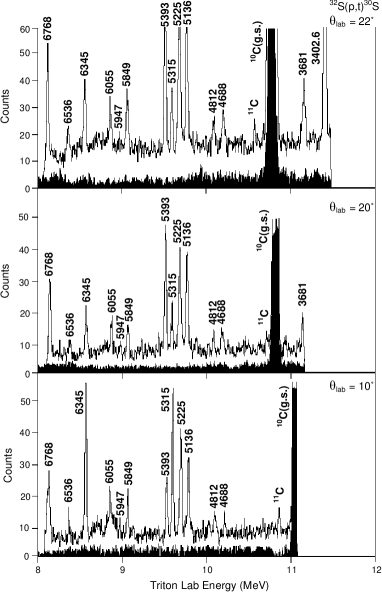
, and position (proportional to momentum) were measured to identify tritons and determine their momenta. The tritons were selected according to and , which were plotted vs. focal plane position gates. The spectra of the tritons’ momenta were then plotted for each spectrograph angle (see Fig. 1). Triton peaks corresponding to 30S states in these spectra were clearly identified through kinematic analysis.
The only contaminant peak observed was the ground state of 10C (see Fig. 1). The 32S implanted target produced a background that was decreased by about a factor of 2 compared with the relatively flat background produced by the Cd component of the CdS target used in phase I of the 32S()30S experiment.
The triton peaks observed in the presented spectra were fitted using a least-squares multi-Gaussian fit function to determine the peak centroids, widths and areas. The energy cali-
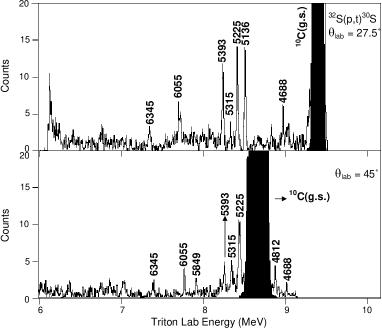
bration was determined from a combination of known levels of 26Si (measured with the 28Si() reaction using the Si-target) and of 30S, whose adopted energies are weighted averages of previous work on 26Si levels Bell et al. (1969); Paddock (1972); Bohne et al. (1982); Caggiano et al. (2002); Bardayan et al. (2002); Parpottas et al. (2004); Seweryniak et al. (2007); Matic et al. (2010) and on 30S Paddock (1972); Caraça et al. (1972); Kuhlmann et al. (1973); Yokota et al. (1982). Since the earlier publication Setoodehnia et al. (2010), the previous calibration fits were improved through reanalysis of the previous data (corresponding to phase I) by accounting for the angle of the target with respect to the beam (details are provided in Ref. Setoodehnia (2011)). Fig. 2 presents the 5.5 MeV excited states in 30S observed in phase I of the 32S()30S experiment that were not published in Ref. Setoodehnia et al. (2010).
The final excitation energy uncertainties for the data of both phases of this experiment arise from: (1) statistical uncertainties ( 2 keV), (2) uncertainties in the thicknesses of the implanted target (1 keV) and the CdS target (2 keV) taking into account the uncertainty in the thickness of the Si target used for calibration, and (3) uncertainty in the -values of the 28Si()26Si and 32S()30S reactions (0.3 keV Kwiatkowski et al. (2010) and 0.4 keV Souin et al. (2011), respectively). Therefore, the 30S excitation energy uncertainties, when added in quadrature, were 3 keV and 2 keV for the CdS and implanted targets, respectively. Lastly, to obtain the final 30S excitation energies, a weighted average was calculated for each state over all the angles, and thus over both targets.
With respect to the previous publication Setoodehnia et al. (2010), all the measured excitation energies from the present work have smaller uncertainties by at least 40% as a result of a reduction in the uncertainty of the -value of the 32S()30S reaction due to a recent improved measurement Souin et al. (2011) on the 30S mass, and our
improved calibration fits for the previous data obtained by the CdS target.
The energy resolution was approximately 28 keV and 22 keV (FWHM) for the spectra obtained with the CdS and implanted targets, respectively. Therefore, our achieved energy resolution is a factor of 3 – 5 smaller than those of previous 32S()30S measurements Paddock (1972); Bardayan et al. (2007).
II.1.2 Results: both phases combined
Over both phases of the 32S()30S experiment, 12 proton unbound states of 30S with 6.8 MeV were observed, and
| (keV) | (keV) | ||
|---|---|---|---|
| 2208(3) | 5393(2) | 3+ | |
| 3402.6∗ | 5849(2) | (1-, 2+, 4+) | |
| 3681(3) | (1+, 0+) | 5947(2) | |
| 4688(2) | 3+ | 6055(3) | (1-) |
| 4812(2) | 2+ | 6345(3) | (0+) |
| 5136∗ | (4+) | 6536(3) | (2, 3) |
| 5225(2) | (0+) | 6768(3) | 2(-) |
| 5315(2) | (3-, 2+) |
their weighted average energies (over all angles) are listed in Table 1.
Most of the measured energies in the present work are in agreement within 1 – 2 with those measured in the previous 32S()30S measurements Paddock (1972); Bardayan et al. (2007). The 5947-keV state observed in the present work (see Fig. 2) is in good agreement with the 5945-keV tentative level observed in Ref. Fynbo et al. (2000). For the state with an expected excitation energy of 4.7 MeV Iliadis et al. (2001), our measured energy of 4688(2) keV does not agree with the 4704(5) keV measured in Ref. Bardayan et al. (2007). Most of the levels observed in our 32S()30S experiments whose 5 MeV have been measured previously but have spin-parity assignments that are either unknown or tentative.
To obtain the spin-parity assignments of 30S states observed in both phases of the 32S()30S experiment, the equivalent thickness of the sulfur content of the CdS target was required. This thickness was determined to be 53 5 g/cm2 through the reanalysis of the data of a previous scattering experiment Wrede et al. (2010), where an 8-MeV 4He+ beam along with the Enge spectrograph at WNSL and a silicon surface barrier detector were used to determine the composition and thickness of the CdS target. The theoretical angular distributions of the cross sections were then computed, following the work of Ref. Bardayan et al. (2007), using (i) the one-step finite range transfer formalism via DWUCK5 P. D. Kunz for the natural-parity states, and (ii) the coupled reaction channels formalism via FRESCO Thompson (1988) (under the assumption of finite-range interaction potential) for the unnatural-parity states. DWUCK5 is unable to handle unnatural-parity states. FRESCO, on the other hand, can be used for all states. The former code was used for the cases of natural-parity states due to its simplicity. Its output for a few natural-parity states was examined against that of FRESCO, and the results were identical in terms of the shapes of the theoretical DWBA curves.
To determine the orbital angular momenta that were transferred in the 32S()30S reaction to populate the observed 30S excited states, the same shell-model assumptions made in Ref. Bardayan et al. (2007) are made here. The angular distributions for the sequence 32S()31Sg.s.()30S were obtained for each of the unnatural-parity final states in 30S.
The distorted waves in the entrance and exit channels were calculated for optical interaction potentials, the parameters of which were taken from Ref. Bardayan et al. (2007) (and references therein), and
| Reaction | 000This parameter, as well as and , is taken from Ref. Paddock (1972). | PNLOC | |||||||||||
|---|---|---|---|---|---|---|---|---|---|---|---|---|---|
| Channel | (MeV) | (MeV) | (MeV) | (MeV) | (fm) | (fm) | (fm) | (fm) | (fm) | (fm) | (fm) | (fm) | |
| 32S | 37.1 | 0 | 6.875 | 7.5 | 1.18 | 0.66 | 1.18 | 0.66 | 1.18 | 0.7 | 1.25 | ||
| 30S | 144 | 30 | 0 | 0 | 1.24 | 0.68 | 1.45 | 0.84 | 0 | 0 | 1.25 | ||
| 31S | 90 | 0 | 25 | 1.30 | 0.62 | 1.18 | 0.58 | 1.25 | |||||
| 31S000The input parameters corresponding to this channel are taken from Ref. Tribble and Kubo (1977). | 0 | 0 | 1.20 | 0.65 | 1.30 | 25 | 0.85 | ||||||
| 30S | 0 | 0 | 1.25 | 0.65 | 25 |
are given in Table 2.
Furthermore, the widely used Reid soft core potential R. V. Reid (1968) was used to derive the deuteron and triton wave functions, as well as the p-n and d-n interactions for FRESCO calculations.
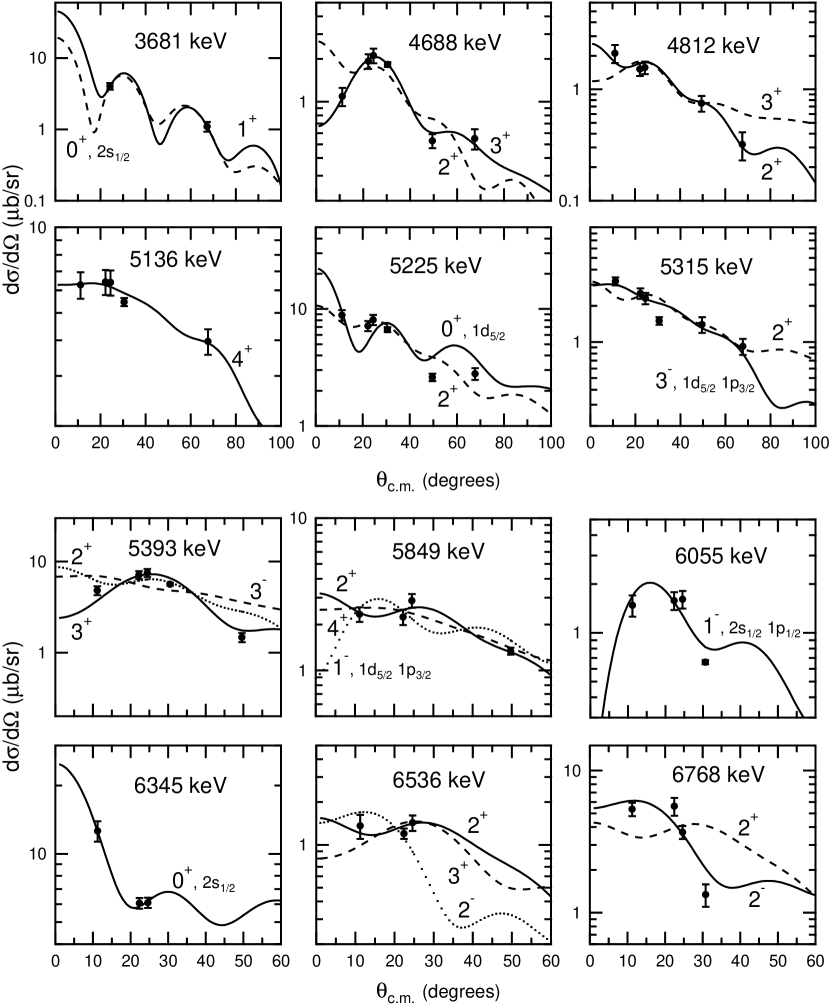
Triton angular distribution plots are shown in Fig. 3. Angular distributions of the states with 5.136 MeV are discussed in § II.2.2.4, since those states were also observed in our -ray measurements. In the following, we will only discuss the angular distributions for 30S levels with 5.225 MeV.
The 5225-keV level: This state is a prominent peak that was observed at every angle measured in the 32S()30S experiments. There is no conclusive information regarding the assignment of this state in the literature. Our only guide comes from a shell-model calculation Wiescher and
Grres (1988), which suggested that there should be a 0+ level around 5.2 MeV. Although reasonable fits are obtained with 0+ and 2+, our fit using 0+ is more consistent with the data. So we suggest that this state is the mirror to the 0 state in 30Si at 5372.2 keV Basunia (2010).
The 5315-keV level: This state is also a prominent peak observed at all angles. It is known to be a 3- state Yokota et al. (1982). Our angular distribution is better fitted by an l 3 angular momentum transfer, but l 2 would also be reasonably consistent (see Fig. 3). We suggest that this state is most likely the mirror to the 5487.5-keV state in 30Si with 3- Basunia (2010).
The 5393-keV level: This state was observed at all angles measured in the 32S()30S experiments. Its spin was tentatively assigned to be 1 or 2 in previous work Yokota et al. (1982). In Ref. Bardayan et al. (2007), tentative 3- and 2+ assignments were given to this state. Our triton angular distribution is more consistent with 3+ assignment, and thus we assign this state to be 3+, making it the mirror to the 3 state in 30Si at 5231.38 keV Basunia (2010).
The 5849-keV level: This state was tentatively assigned to be a 1- state in Ref. Bardayan et al. (2007). However, l 2, 3 and 4 transfers could not be excluded. In our data, this level was observed at 10∘, 20∘, 22∘ and 45∘. We can rule out 4- and 2- assignments but 1-, 2+ and 4+ are all in reasonable agreement with our data (see Fig. 3).
The 5947-keV level: This level was too weakly populated to extract a significant angular distribution.
The 6 MeV states: With the exception of the 6055-keV and 6768-keV states, which are observed at four angles (see Fig. 3), all other states of 30S observed in the present experiment whose excitation energies are above 6 MeV are only observed at most at three angles, 10∘, 20∘ and 22∘ (see Fig. 2). Nonetheless, we propose a tentative assignment of 1- to the 6055-keV state, which is consistent with the results of Ref. Yokota et al. (1982), but the energy of this state from our data differs by 62 keV. We also make a tentative assignment of 0+ to the 6345-keV state consistent with a definite 0+ assignment made in Ref. Yokota et al. (1982). Furthermore, we tentatively assign 2 or 3 to the 6536-keV state, which is consistent with what was suggested in Ref. Yokota et al. (1982). Lastly, for the 6768-keV state, we confirm 2 suggested in Ref. Bardayan et al. (2007), and likely rule out l 3 and 4 transfers. Though, our angular distribution data are best fitted with a negative parity assignment. Therefore, we propose a 2(-) assignment to this state.
II.2 The 28Si(3He, )30S experiment
II.2.1 Experimental setup and data analysis: phase II
An in-beam -ray spectroscopy experiment using the 28Si(3He, )30S reaction was carried out to assign spins to the populated 30S levels based on measurements of -ray angular distributions and - angular correlations from oriented nuclei. This experiment was performed at the University of Tsukuba Tandem Accelerator Complex (UTTAC) in Japan. A 3He2+ beam was accelerated to 9 MeV via the UD Pelletron tandem accelerator at UTTAC. The details of this beam are described in Ref. Setoodehnia et al. (2011). The beam impinged on a self-standing 25 m-thick foil of Si, of which the 28Si abundance is 92.23%.
High-purity germanium detectors with 50% and 70% relative efficiency were placed at 90∘ and 135∘ with respect to the beam axis, respectively. We hereafter refer to these detectors as 1 and 2, respectively. These detectors were located on opposite sides with respect to the beam line. The energy resolution of detectors 1 and 2 was determined to be 4.4 keV and 3.2 keV (FWHM) at 1333 keV, respectively. - coincidence data were accumulated during a total of 4 days, and was corrected hourly for detector gain shifts. A sample -ray spectra can be seen in Fig. 4.
To extract the centroid and area of each peak, the peaks
were fitted using a single-Gaussian function whenever they were reasonably isolated from each other, and with a multi-Gaussian function for the partially resolved or unresolved doublets. Those peaks that were affected by Doppler shift at higher angles were fitted using Gaussian-plus-exponential functions to account for the exponential tail. Background subtraction was performed by assuming a linear function under each peak.
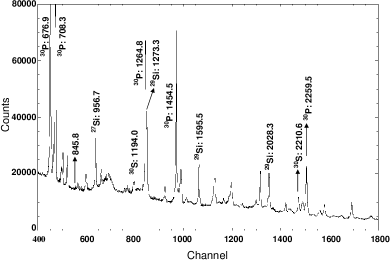
The Ge-detectors’ initial energy calibration and energy-dependent efficiencies were determined with a standard 152Eu calibration source. The initial energy calibration fit was improved via internal calibration by using strong 30P -rays emitted from the 28Si(3He, )30P reaction, whose cross section is higher than that of the 28Si(3He, )30S reaction at this beam energy Groenevbld et al. (1970); Bass et al. (1972). The resulting uncertainties in the detection efficiencies were estimated to be 5%.
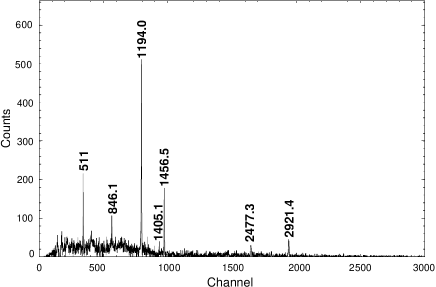
The coincidence analysis was performed via construction of a - coincidence matrix. Fig. 5 presents the coincidence spectra. The -ray angular distribution and - angular correlation measurements and their results will be discussed in § II.2.2.2 and § II.2.2.3, respectively.
II.2.2 Results: both phases combined
II.2.2.1 Decay scheme of 30S
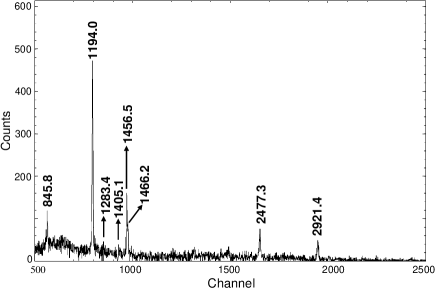
In the singles -ray spectra of both Ge-detectors during each phase of the experiment, two -rays were clearly observed at 2210.6(3) keV and 1194.0(1) keV, which correspond to the 2 0 and 2 2 transitions in 30S, respectively (see Fig. 4).
A few -rays with energies in the range of 3 MeV were expected to be observed in the singles spectra according to the measured branching ratios Caraça et al. (1972); Kuhlmann et al. (1973) of the -rays from decays of the bound states and the lowest-lying resonances of 30S. However, these -rays did not appear as separate observable peaks in the singles -ray spectra obtained during either phase of the experiment. This was most likely because they were obscured by the Compton scattered -rays from 30P transitions.
After placing software gates on the 2210.6- and 1194.0-keV peaks, -decay cascades from higher-lying states were observed in the - coincidence spectra (see Fig. 5). In particular, we observed transitions with energies of 2477.3(3) keV, 2599.0(4) keV (see Fig. 2 in Ref. Setoodehnia et al. (2011)) and 2921.4(4) keV from 30S proton-unbound states at 4688.1(4) keV, 4809.8(5) keV and 5132.3(5) keV, respectively.
Recoil energies were taken into account when constructing the final excitation energies of 30S from its -ray decay scheme. The results are given in Table 3. The final uncertainties in the energies are due to the statistical uncertainties
| Present Work | Ref. Kuhlmann et al. (1973) | |||||||||
|---|---|---|---|---|---|---|---|---|---|---|
| Gate000The transition on which the coincidence gate is placed. | ||||||||||
| (keV) | (keV) | (keV) | (keV) | (%) | (%) | (keV) | (keV) | (keV) | ||
| 2210.6(3) | 846.0(4) | 0.01 | unplaced | unplaced | 3.9(6) | 2.8(5) | ||||
| 1194.0(1) | 0.03 | 3404.7(3) | 2210.7(3) | 33.5(5) | 43.3(10) | 1192.0(5) | 3402.6(13) | 2210.7(5) | ||
| 1194.0(1) | 1283.4(3)000This transition is not observed at 135∘. | 0.03 | 4688.1(4) | 3404.7(3) | 1.2(2) | |||||
| 1194.0(1) | 1405.1(4) | 0.04 | 4809.8(5) | 3404.7(3) | 3.1(4) | 1.9(4) | ||||
| 2210.6(3) | 1456.5(3) | 0.04 | 3667.2(4) | 2210.7(3) | 11(3) | 13.9(9) | 1456.8(9) | 3667.5(10) | 2210.7(5) | |
| 2210.6(3) | 1466.2(3) | 0.04 | 3676.9(4) | 2210.7(3) | 3.1(1) | 3.6(6) | 1465(3) | 3676(3) | 2210.7(5) | |
| 2210.6(3) | 0.10 | 2210.7(3) | g.s. | 100(1) | 100(1) | 2210.7(5) | 2210.7(5) | g.s. | ||
| 3402.6(13) | 3402.6(13) | g.s. | ||||||||
| 3676(3) | 3676(3) | g.s. | ||||||||
| 2210.6(3) | 2477.3(3) | 0.10 | 4688.1(4) | 2210.7(3) | 6.0(4) | 9.3(9) | ||||
| 2210.6(3) | 2599.0(4)000This transition is too weak at 135∘ to obtain a reasonable yield. | 0.10 | 4809.8(5) | 2210.7(3) | 1.6(3) | |||||
| 2210.6(3) | 2921.4(4) | 0.20 | 5132.3(5) | 2210.7(3) | 9.7(4) | 18.3(10) | 2925(2) | 5136(2) | 2210.7(5) | |
 |
 |
in the corresponding centroids only, because all the calibration energies have negligible uncertainties.
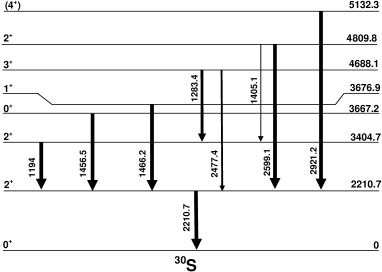
From the recoil energies and the -ray energies, the excitation energies of the first few states were reconstructed to obtain the level scheme of 30S (see Table 3 and Fig. 6). The measured energies of most of the levels are in agreement with the results of the 32S()30S measurements discussed earlier, as well as those of previous measurements on the -rays of 30S Caraça et al. (1972); Kuhlmann et al. (1973). In particular, the measured energies of the two astrophysically important excited states at 4688.1(4) keV and 4809.8(5) keV from our -ray measurements are in excellent agreement with the 4688(2) keV and 4812(2) keV energies from the 32S()30S experiments presented in Table 1.
However, there are discrepancies in the energies of two 30S levels: the energies of the 3404.7- and 5132.3-keV states deduced from our -ray energies are 2 keV higher and 4 keV lower, respectively, than those measured in the -ray study of Ref. Kuhlmann et al. (1973). The reason for the discrepancy in the energy of the 5-MeV state is unclear; however, we suggest that the inconsistency between the measured energies of the 3-MeV state originates from the presence of a double escape peak at 1188.6 keV (see Fig. 7) just beside the peak at 1194 keV, correspond-
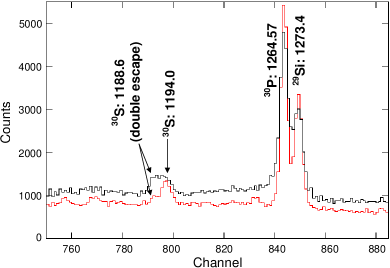
ing to the 2 2 transition in 30S, observed in our singles spectra.
The energy of the 1194-keV -ray results in the level energy of the 2 state of 30S to be 2 keV higher than that measured by Kuhlmann et al. Kuhlmann et al. (1973). The latter measurement was performed in the early 1970’s when the Ge-detectors were smaller. Thus, it may be possible that the 1188.6-keV double escape peak was also present in their spectra but because of the lower detector efficiency the two peaks were assumed to be one.
We expected to observe the -rays emitted from de-excitations of the 3407.7- and 3676.9-keV states directly to the ground state in the singles spectra. In addition, if the 4809.8-keV state is the 2 state in 30S, then according to the decay scheme of its mirror level we expect that the 2 0 transition in 30S is a strong branch (with respect to the strength of the other decay branches of the same level). Therefore, we also expected to observe the 4809.8-keV -rays of 30S in the singles spectra. However, the detection efficiency for detecting such high energy -rays is relatively low, and the high energy regions of the spectra obtained in the 28Si(3He, )30S experiments are obscured mostly by wide peaks originating from transitions in 30P. Therefore, the 3407.7-, 3676.9-, and 4809.8-keV transitions are not resolved. Hence, the fact that the 2 0 transition in 30S is not observed in these experiments does not imply that this transition is weak. Based on Ref. Alburger and Goosman (1974) where the intensities of the -rays of the mirror nucleus 30Si were measured at 90∘, we estimate that the branching ratio of the 2 0 transition in 30Si is 36 3 % which should be similar to that of the transition from the 4809.8-keV state to the ground state in 30S.
We have observed a weak line at 846 keV in the singles -ray spectrum measured at 90∘ (see Fig. 4), which also appears in the coincidence spectra at 90∘ and 135∘ as a more noticeable peak (see Fig. 5). The energy of this peak does not seem to be Doppler shifted at 135∘, which suggests that this -ray may originate from a state whose half-life is more than 2 ps Sin . This -ray transition is also in coincidence with the 1194-keV transition in 30S. A weighted average between independent measured energies at 90∘ and 135∘ for this -ray results in 846.0(4) keV (see Table 3). The energy of this transition does not add up to any of the known levels of 30S; however, the fact that it is a fairly prominent peak and is in coincidence with two transitions of 30S suggests that this -ray may also belong to the decay scheme of this nucleus. The higher lying resonances ( 6 MeV) of 30S may emit -rays in this energy range, e.g., the decay transition from the state with 7123(10) keV to that with 6280.1(12) keV Basunia (2010). In particular, if one of these resonances has a high spin, its proton decay might be suppressed by the centrifugal barrier, and thus it can decay via -ray emission. The 846-keV -ray transition has so far remained unplaced in the level scheme obtained from the present experiment.
The relative intensities from full-energy-peaks of all the observed transitions were calculated at 90∘ and 135∘. For the coincidence spectra, first the yield of the 1194-keV transition observed in the singles spectrum was normalized to that of the 2210.6-keV -ray transition also obtained from the same spectrum. Then the relative intensity of the 1194-keV -ray transition was used to convert the yields of all the other -ray transitions in the coincidence spectra into relative intensities. These results are tabulated in Table 3.
II.2.2.2 Singles measurements: -ray angular distributions
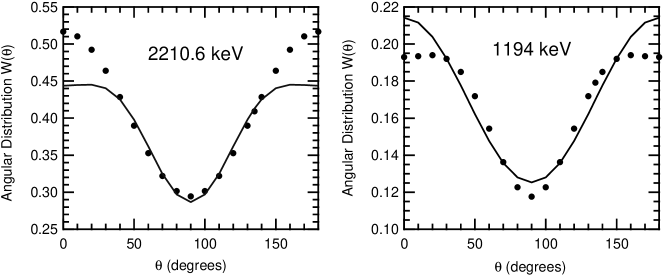
For a transition , where represents the spin of the state, the theoretical -ray angular distribution function is defined as Litherland and Ferguson (1961):
| (1) |
where the coefficients are the Legendre Polynomials, and the coefficients are defined as Morinaga and Yamazaki (1976) (p. 55):
| (2) | |||||
where and are the spins of the initial and final states involved in the transition, respectively; and are transition multipolarities; are the alignment factors (see Eq. (4)); and coefficients are tabulated Yamazaki (1967) for different transitions; and is the mixing ratio of a -ray transition defined as Iliadis (2007) (p. 54):
| (3) |
 |
 |
where and are the magnetic and electric transitions of multipolarity , and , respectively; and is the partial -ray width corresponding to a state with spin .
The alignment factors are defined as Morinaga and Yamazaki (1976) (p. 55):
| (4) |
where is even and 6 are ignored due to a rapid decrease of transition probabilities of higher order multipoles. An individual aligned state with spin can be represented as a Gaussian probability distribution of magnetic substates , where , , , with the FWHM of along the beam axis. is the population parameter and is defined as Morinaga and Yamazaki (1976) (p. 56):
| (5) |
where can be defined experimentally.
An incomplete alignment of a state relative to the beam axis results in an attenuation of the population parameter. The alignment factors, , describe the degree of the attenuation of the population parameter. While is considered to be unity, and coefficients are determined experimentally.
For the -ray angular distribution measurement during phase II of the experiment, the total charge deposited by the beam could not be determined due to a faulty beam current integrator. Therefore, to take into account the fluctuations in the beam intensity and possible target degradations or changes in the target profile that could affect the areas under the peaks of interest, detector 1 was used as a monitor detector. It was kept fixed at 90∘ with respect to the beam axis 10 cm away from the target. Detector 2, on the other hand, was positioned 7 cm away from the target and on the opposite side of detector 1. Detector 2 was moved between 90∘ to 120∘ in intervals of 10∘ and was lastly positioned at 135∘ with respect to the beam axis. It could not be place at angles higher than 135∘ due to the presence of the beam line.
The singles -ray spectra were then obtained for 1 hour from both detectors at five different angular pairs and were calibrated as explained before.
For every (, ) angular pair corresponding to detectors 1 and 2, the intensities of the 2210.6-keV and 1194-keV -ray transitions from 30S were normalized to the intense 1+ 1+ transition at 708.7 keV in 30P.
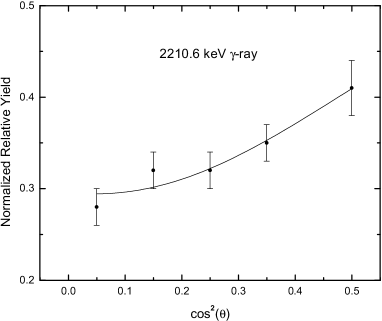
The normalized relative yields for each peak of interest were plotted against , where is the detection angle, and these data were fitted (see Fig. 8) using the function:
| (6) |
where the coefficients are extracted from the fit, and and are Legendre polynomials. represents the experimental -ray angular distribution function, which can be used to normalize . From the latter, one can infer the alignment probability of an excited state involved in a -ray transition.
The angular distributions of the two observed 30S peaks in the singles spectra are discussed below.
-
•
The 2210.6-keV transition of 30S:
The 2210.6-keV -ray corresponds to the 2 0 transition in 30S. This transition is a pure ( 0) and is a so-called stretched quadrupole transition Rasmussen and Sugihara (1966).
The experimental intensities of the 2 0 transition (see Fig. 8) was used to normalize the of this transition
| /000This value is normalized such that Eq. (6) becomes , which resembles Eq. (1), where 1. | / a | /j000The attenuation factors are der Mateosian and Sunyar (1974a) (,) (0.41482,0.048393) for /j 0.6, and (,) (0.53784,0.095181) for /j 0.5. | Mult.000Transition multipolarity | |||
|---|---|---|---|---|---|---|
| 2210.6(3)000 : 2210.7(3) keV g.s. | 2 0 | 0.4(2) | -0.0091(1800) | 0.6 | 0 | |
| 1194.0(1)000 : 3404.7(3) keV 2210.7(3) keV | 2 2 | 0.38(25) | -0.14(22) | 0.5 | , | 0.16 |
obtained via Eqs. (1) and (2) using 0.
To normalize to , the coefficients and for the 2+ 0+ transition were taken to be 0.7143 and -1.7143, respectively, from Ref. Morinaga and Yamazaki (1976) (p. 82). Therefore, the only parameters that were free to vary were the alignment factors and . These coefficients are given in the literature der Mateosian and
Sunyar (1974a) for 0.1 / 2.
Thus, for each (, ) pair corresponding to a specific / value, the theoretical angular distribution was calculated at the same angles at which a relative yield was measured in phase II of the 28Si(3He, )30S experiment. An average normalization factor was thus obtained and was used to normalize to the intensity at each angle. Then /, where and are respectively the intensity and its uncertainty obtained from the data at the angle , was plotted against . Hence, the specific (, ) pair, which yielded the minimum difference between and , was found. Finding the (, ) pair uniquely determines the parameter /, where is the FWHM of the population parameter. The results for the 2 0 transition in 30S are presented in Table 4 and Fig. 9.
-
•
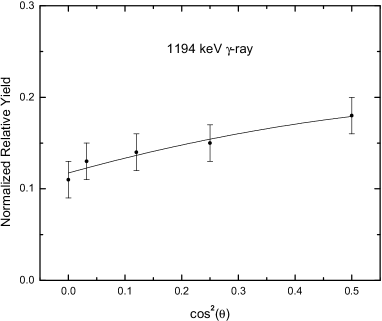
The 1194-keV transition of 30S:
From a comparison of the 1194-keV -ray, corresponding to the 2 2 transition in 30S, with the mirror transition in 30Si, it was assumed that this transition is a mixed /. For this transition, the mixing ratio is an additional free parameter that is required for normalization of to .
For the 1194-keV -ray, the coefficients and were first extracted from the experimental fit (see Eq. (6)). was calculated for all (, ) pairs corresponding to 0.1 2 for a 2+ 2+ transition der Mateosian and
Sunyar (1974a). The mixing ratio was set to a constant free parameter from a prechosen set of values. The parameters and are constants given in the literature Morinaga and Yamazaki (1976) (p. 82). With these, was calculated for each value of . Then, a statistical test was
performed with defined by:
| (7) |
where the parameters are the yields of 30S -rays observed in the singles spectra and normalized to that of a 30P -ray peak as discussed earlier; are the experimental uncertainties in normalized to extracted from the fit given by Eq. (6); and is calculated using Eq. (2).
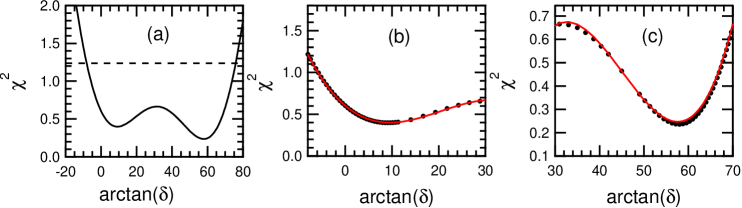
The was plotted against (see panel (a) in Fig. 10) and had local minima at 10 and 60. was again separately plotted for two regions around these minima, and each region was fitted (see panels (b) and (c) in Fig. 10) with a polynomial of the third degree to obtain the functional forms of with respect to for these regions. Then a minimization procedure was used to find the best possible local solutions, which were 0.16 and 1.5.
Those ’s that are within 1.0 of the best (see the dashed line in panel (a) in Fig. 10) are located at approximately 1. Therefore, all ’s within -0.13 3.73 are valid, which means our uncertainty in delta is very large. However, our choice of from the aforementioned range is determined by the consistency with the mixing ratio of the mirror transition ( 0.18(5) Basunia (2010)) and the agreement between the theoretical and experimental angular distributions for the 1194-keV -ray. The latter is best for / 0.4; however, in that case is calculated to be 0.04, which is not consistent (within 2) with the mixing ratio of the mirror transition. Therefore, the next best value is / 0.5, for which 0.16 consistent with that of the 2 2 mirror transition in 30Si. 0.16, as mentioned before, also represents a local minimum in the vs. plot. We thus adopted 0.16 and held it fixed. For the sign of , we have followed the convention adopted by Krane and Steffen Krane and Steffen (1970) as opposed to that of Rose and Brink Rose and Brink (1967).
To confirm that we can reject 1.5, the single particle transition strength ) in Weisskopf units was determined as follows:
| (8) |
where is the half-life of the state under consideration; is the mass number; is in keV; is the internal conversion coefficient, which is ignored for our case as this coefficient decreases with increasing ; and is the branching ratio of the transition of interest.
We obtained 0.41 for the 1194-keV -ray transition. As a rule of thumb Sin , if the of a transition is larger than one, the corresponding state which emits the -ray of interest is most likely a collective state, for which the mixing ratio should be large. On the other hand, when a transition has 1, the state which initiates the transition is to a good approximation estimated as a single particle state with a small mixing ratio. Since our estimated value for the 1194-keV transition falls into the latter category, we concluded that the 3404.7-keV state is a single particle state with a small mixing ratio. Therefore, we adopted 0.16.
Finally, the procedure which was described for the 2210.6-keV -ray transition was repeated for the 1194-keV -ray transition to determine the FWHM of its population parameter. The results are given in Table 4 and Fig. 9.
The previously described method was also performed as a check for the 2210.6-keV transition, and a sharp minimum at 0 confirmed the stretched profile for this -ray.
The large uncertainties in the experimentally determined and (see Table 4) are mostly due to the low statistics in each peak in the singles -ray spectra. However, they are still consistent with the typical values Sin ; der Mateosian and
Sunyar (1974b); Nuc (2010) expected for a stretched quadrupole with 2 (for the transition from the 2210.7-keV state to the ground state) and a mixed dipole-plus-quadrupole with 0 (for the transition from the 3404.7-keV state to the 2210.7-keV state).
II.2.2.3 Coincidence measurements: - angular correlations
Measurements of the Directional Correlations of -rays de-exciting Oriented states (DCO ratios) allow to deduce the angular correlation information from the - coincidence data. The method of measuring DCO ratios is applied to determine the multipolarities of the -rays involved in a cascade, and thus
| The 28Si(3He, )30S Experiment – Phase II | Theory | ||||||||||
| (keV) | Mult.000Transition multipolarity, and refer to dipole and quadrupole, respectively. | Mult.a | Mult.a | ||||||||
| () | () | () | () | ||||||||
| 1194.0(1) | 2 | 0.5000Determined experimentally from angular distribution measurements. | 0.16b | 0.92(4) | 2 | 0 | 1.0 | ||||
| 1456.5(3) | 0 | 0.3000The alignment factor of 0.3 is usually adopted when no experimental information is available for this parameter. Since -ray angular distribution measurements were only obtained for the 2210.6-keV and 1194-keV -rays, we have assigned 0.3 for all other -rays of 30S. | 0000From selection rules. | 0.94(9) | 2 | 2 | 1.0 | ||||
| 1466.2(3) | 1 | 0.3c | , | -0.09(3)000This mixing ratio was adopted from the mirror transition (see Ref. Basunia (2010)). | 0.40(8) | 2 | 1 | 0.5 | |||
| 2477.3(3) | 3 | 0.3c | , | 0.73(9)e | 0.37(4) | 2 | 1 | 0.5 | |||
| 2921.4(4) | 4 | 0.3c | 0d | 0.99(11) | 2 | 2 | 1.0 | ||||
it can be used as a guide for determination of the spins of the associated states involved in the transitions.
For a cascade, where , and are the spins of the final, intermediate and initial states, respectively, the DCO ratio is generally defined as Krmer-Flecken
et al. (1989):
| (9) |
where and are the angles with respect to the beam axis at which detectors 1 and 2 are placed, respectively; is the intensity; and and are transitions observed in coincidence, which originate from the and decays, respectively. transition is the one on which the coincidence gate is placed.
The theoretical DCO ratios are given in Table 5 for the cases where the transition from the decay is a pure transition. If on the other hand, is a mixed transition, the theoretical DCO ratio is expected Nuc (2010) to differ from what is listed in Table 5. The significance of such a difference depends upon the severity of the dipole-plus-quadrupole admixture of the transition Sin .
For our - angular correlation measurement, detectors 1 and 2 were positioned, with respect to the beam axis, at 90∘ and 135∘, respectively, and on opposite sides with respect to the beam line. The 2 0 transition in 30S was measured with detector 1 and after gating on this transition, the higher lying transitions were observed in the coincidence spectrum measured by detector 2. Both detectors were placed as close to the target as possible, i.e., 3 cm and 7 cm away from the target, respectively.
The - angular correlations of 30S -rays were determined by measuring the DCO ratios for each 30S -ray that was observed at both angles. Since the statistics under the 1283.4-keV, 1405.1-keV, and 2599-keV -ray transitions corresponding to the 3 2, 2 2 and 2 2 decays in 30S, respectively, are too poor, the DCO ratio could not be determined for these transitions.
The experimental DCO ratios of all other transitions of 30S were determined after a gate was set around the stretched quadrupole transition with 2210.6-keV energy (2 0), observed in the singles -ray spectra at both angles, to obtain the corresponding coincidence spectra. The peaks of interest in the coincidence spectra were then fitted, and their yields, corrected for detector efficiencies, were obtained and used to calculate the DCO ratios via Eq. (9). The results are given in Table 5.
The - directional correlations of -ray transitions in 30S, and the spin-parity assignments of 30S states with 5.136 MeV from our () measurements are discussed below.
II.2.2.4 Spin-parity assignments
Prior to discussing the spin-parity assignments, it should be noted that in the following discussion, the energies of the adopted -ray transitions are corrected for 30S recoil energies (see Table 3 and Fig. 6).
The 2210.7-keV -ray Transition: corresponds to the 2210.7-keV ground state decay transition. The 2210.7-keV state was observed only at 62∘ during phase I of the 32S()30S experiment, thus no assignment is available from that experiment. However, our present -ray angular distribution parameters for this transition (see Table 4) confirm 2+.
The 1194-keV -ray Transition: corresponds to the 3404.7-keV 2210.7-keV decay transition. Due to the lack of triton angular distribution data from our 32S()30S experiments for the 3404.7-keV state, no conclusive spin-parity assignment was obtained for this state from those experiments. Nevertheless, the assignment for the 3404.7-keV state is already established as 2+ from various previous measurements, e.g., Ref. Bardayan et al. (2007), and the results of our -ray angular distribution measurements for the 1194-keV -ray transition agree with a 0 transition from a 2+ state (see Table 4). Moreover, our experimental ratio for the 2 cascade agrees with the theoretical ratio within 2, and is consistent with an transition with a small admixture for the 1194-keV -ray transition for the 2 2 decay.
The 1456.5-keV -ray Transition: corresponds to the 3667.2-keV 2210.7-keV decay transition. The 3667.2-keV state could not be resolved in our 32S()30S experiments, and thus no information on its energy or spin-parity is available from those experiments. The present experimental and theoretical ratios for the 0 2 0 cascade are consistent with unity, suggesting that the transition from the 3667.2-keV state to the 2210.7-keV state has the same multipolarity as that of the decay of the 2210.7-keV state to the ground state (see Ref. Krmer-Flecken
et al. (1989) and Table 5). This implies that the 1456.5-keV -ray is a pure quadrupole transition. Therefore, we confirm the assignment of 0+ for the 3667.2-keV state, because from the mirror nucleus no other possibilities are expected in this energy range for a 2 transition corresponding to the 3667.2-keV 2210.7-keV decay transition.
The 1466.2-keV -ray Transition: corresponds to the 3676.9-keV 2210.7-keV decay transition. From our 32S()30S experiment, we obtained an energy of 3681(3) keV, consistent with the 3676.9(4) keV obtained from our in-beam -ray spectroscopy experiment within 2. The present triton angular distribution data for the 3681-keV state agree with both 0+ and 1+ (see Fig. 3). Previous measurements Kuhlmann et al. (1973); Bardayan et al. (2007) have assigned a 1+ to this state. According to Table 5, the theoretical is expected to be 0.5 if the 1466.2-keV -ray transition is a stretched dipole ( or transition with 0) 1 transition from a state with 1+ or 3+. If, on the other hand, the aforementioned transition is a mixed dipole-plus-quadrupole instead of a stretched dipole, the theoretical should differ from 0.5 Nuc (2010). Considering the 2+ 0+ cascade as the 3676.9-keV 2210.7-keV ground state decay transitions, our previous discussion implies that the 3676.9-keV state could either be the 1 or 3 state in 30S. A 0+,1+ doublet is thought Caraça et al. (1972); Kuhlmann et al. (1973) to exist in 3.6 – 3.8 MeV region in 30S. Being very close in energy to the 3667.2-keV state, the 3676.9-keV state must be the 1+ member of the aforementioned doublet, now that we have confirmed the former as the 0+ member. Our experimental ratio for the 3676.9 keV 2210.7 keV ground state cascade is slightly lower than 0.5 (see Table 5), which implies that the 3676.9-keV state is most likely the 1 state of 30S and the 3676.9 keV 2210.7 keV decay transition is a likely an transition with a small admixture. We could not determine the mixing ratios of any of the transitions observed via the present - directional correlation measurements. Therefore, we have adopted the mixing ratio of -0.09(3) Basunia (2010) (from the mirror transition) for the 1466.2-keV -ray transition of 30S. In conclusion, we suggest a 1+ for the 3676.9-keV state of 30S.
The 2477.3-keV -ray Transition: corresponds to the 4688.1-keV 2210.7-keV decay transition. The present triton angular distribution for the 4688.1-keV state is consistent with a 3+ assignment (see Fig. 3). Moreover, the decay branches of the 4688-keV state, observed in our in-beam -ray spectroscopy experiments, also agree with those of the mirror state Setoodehnia et al. (2011) assuming that the 4688-keV state is the 3 state of 30S. Our experimental DCO ratio for the 3 cascade is significantly different from the theoretical 0.5 (see Table 5). Therefore, based on the previous discussion, we expect the 2477.3-keV -ray to be a 1 mixed / transition from a 3+ or a 1+ state. According to the mirror states in 30Si Basunia (2010), only one 1+ state is expected in this energy range, and that is most likely the 3676.9-keV state. These arguments suggest that the 4688.1-keV state is the 3 state of 30S. Therefore, our experimental ratio also supplements the other present results with regards to the value of the 4688-keV state. We have adopted the mixing ratio of the mirror transition ( 0.73(9) Basunia (2010)) for the 2477.3-keV -ray due to the lack of knowledge of its own mixing ratio. We conclude that the 4688-keV state is the mirror to the 3 state in 30Si at 4831 keV Basunia (2010). Thus, the 4688-keV level in 30S is the 3 astrophysically important state predicted by Iliadis et al. Iliadis et al. (2001).
The 2599.1-keV -ray Transition: corresponds to the 4809.8-keV 2210.7-keV decay transition, which is a very weak transition observed at 135∘ in the present 28Si(3He,)30S experiment. Therefore, no experimental ratio could be obtained for this transition. The present triton angular distribution data agree with both 2+ and 3+ (see Fig. 3) but the former is a better fit. The -ray branching ratios for the -decay of the 4809.8-keV state to the 2 and 2 states in 30S were measured at 90∘ Setoodehnia et al. (2011), and were in good agreement within their uncertainties with those of the decay of the 4810-keV state in 30Si to its 2 and 2 lower-lying states (also see § II.2.2). Also, in a recent shell model calculation for the sd-shell in 30 nuclei using the USD Hamiltonian with inclusion of a charged-dependent term Bro ; Ric , the energy of the 2 state in 30S was derived to be near 4800 keV, while that of the 3 state was calculated to be near 4700 keV. These results altogether strongly support a 2+ assignment for the 4809.8-keV state (mirror to the 2 state at 4810-keV in 30Si Basunia (2010)), making it the next astrophysically important state predicted by Iliadis et al. Iliadis et al. (2001).
The 2921.4-keV -ray Transition: corresponds to the 5132.3-keV 2210.7-keV decay transition. In the shell-model analysis by Wiescher and Grres Wiescher and
Grres (1988), they concluded that there are most likely at least two levels with energy near 5 MeV: a 4+ near 5.1 MeV and a 0+ near 5.2 MeV. Kuhlmann et al. Kuhlmann et al. (1973) observed a state at 5136(2) keV, and concluded that this level is most likely a 4+ state. In Ref. Bardayan et al. (2007), a state was observed at 5168(6) keV. The triton angular distribution data in that work could not be fitted with a single angular momentum transfer, which suggested that the latter state was an unresolved doublet consisting of a 4+ and a 0+ state. Our triton angular distribution data are best fitted with l 4 transfer. Our experimental ratio for the 4 cascade is consistent with the theoretical ratio given in Table 5 under the assumption that the 5132.3-keV 2210.7-keV transition is a stretched quadrupole with 2. This indicates that the 5132.3-keV state, observed in our in-beam -ray spectroscopy experiments, is either the 4 or the 0 state of 30S. The former is much more probable because a comparison with the mirror transitions in 30Si reveals that the 4 level at 5279.37 keV in 30Si decays with a 100% branch to the first excited 2 state Basunia (2010). This is consistent with what we observe for the
| Present Work | Present Work | Adopted Energy | 000 , where is the resonance energy, is the weighted average excitation energy and is the proton threshold of the 29P()30S reaction (4394.9 keV). Those excitation energies for which no resonance energy is reported correspond to the bound states of 30S. | ||||||
|---|---|---|---|---|---|---|---|---|---|
| 32S()30S | 28Si(3He, )30S | (keV) | (keV) | ||||||
| (keV) | (keV) | (keV) | |||||||
| g.s. | g.s. | 0+ | |||||||
| 2208(3) | 2210.7(3) | 2+ | 2210.6(3) | 2+ | |||||
| 3404.7(3) | 2+ | 3403.6(6) | 2+ | ||||||
| 3667.2(4) | 0+ | 3667.0(5) | 0+ | ||||||
| 3681(3) | (1+, 0+) | 3676.9(4) | 1+ | 3677.0(4) | 1+ | ||||
| 4688(2) | 3+ | 4688.1(4) | 3+ | 4688.1(4) | 3+ | 293.2(8) | |||
| 4812(2) | 2+ | 4809.8(5) | 4809.8(6) | 2+ | 414.9(9) | ||||
| (4+)000The corresponding energy (5136(2) keV) was used as internal calibration energy, and is thus not reported here. | 5132.3(5) | (4+) | 5132.6(8) | (4+) | 737.7(11) | ||||
| 5225(2) | (0+) | 5221(2) | (0+) | 826(2) | |||||
| 5315(2) | (3-, 2+) | 5314(4)000This state is most likely the 5288-keV state observed by Yokota et al. Yokota et al. (1982), which was assigned to be the 3 state in 30S. | (3-) | 919(4) | |||||
| 5393(2) | 3+ | 5391(2) | 3+ | 996(2) | |||||
| 5849(2) | (1-, 2+, 4+) | 5847(2) | (2+) | 1452(2) | |||||
| 5947(2) | 5946(3) | (4+) | 1551(3) | ||||||
5132.3-keV state in 30S, as well as what was observed for the same state in Ref. Kuhlmann et al. (1973). If the 5132.3-keV state were the 0 state, based on its decay scheme in the mirror nucleus, we would have expected to observe other decay branches from this state with comparable strengths, in addition to the 2921.4-keV -ray transition Basunia (2010). From these arguments, we tentatively assign = 4+ to the 5132.7-keV level of 30S.
In the following subsection, the spin-parity assignments for a few other 30S states with 6 MeV are discussed.
II.2.2.5 Adopted energy levels in 30S
Table 6 presents the combined results of both phases of both our experiments on 30S excitation energies below 6 MeV, and the corresponding recommended spin-parity assignments. The adopted energies in Table 6 are the 30S weighted average excitation energies over all independent measurements in the literature, including the present work. States used as internal calibration energies were excluded in the calculations of the adopted energies. In a few cases where the uncertainty in the weighted average was smaller than the smallest uncertainty in the measured excitation energies, the latter was adopted as the final uncertainty only if the energy was measured in fewer than 4 independent measurements Sin .
From our () measurements, a unique spin-parity assignment could not be determined for the 1452-keV and 1551-keV resonances. To calculate the 29P()30S reaction rate, a value had to be assumed for each of these resonances.
A tentative value of 1- was assigned Bardayan et al. (2007) to the 1452-keV resonance (see Table 6), but due to poor statistics for this particular resonance, l 2 or 3 transfers were not excluded. In our () measurements, the value for the 996-keV resonance fits best with a 3+ assignment, and we have assigned the 919-keV resonance to be the 3 state (see § II.1.2). Hence, we have tentatively assigned the 1452-keV resonance to be the 2 state in 30S.
The 1551-keV resonance has only been observed in the measurement of Ref. Fynbo et al. (2000) and in our 32S()30S measurements. However, the data obtained in these measurements were not enough to assign a conclusive value to this resonance. From the results of a recent shell model calculation Bro ; Ric , the energies of the 4 states in 30S and its mirror nucleus – 30Si – are almost identical to each other. The excitation energy of the 4 state in 30Si is 5950.73(15) keV Basunia (2010). On the other hand, the weighted average energy between the results of Ref. Fynbo et al. (2000) and our 32S()30S measurements for the corresponding state in 30S is 5946(3) keV. Therefore, we concluded that this latter state is most likely the mirror to the 4 state in 30Si at 5950.73(15) keV.
The states presented in Table 6 are the only ones that could play a crucial role in determination of the 29P()30S reaction rate in the temperature range characteristic of explosive hydrogen burning (0.1 GK 1.3 GK). The excited states whose energies are below 4.5 MeV become important in determining the non-resonant contributions to the 29P()30S reaction rate.
III The 29P()30S reaction rate
To obtain the non-resonant contribution to the 29P()30S reaction rate, one has to determine the astrophysical S-factor, , from:
| (10) |
where the primes indicate derivatives with respect to . can be integrated to give the non-resonant reaction rate:
| (11) |
where is the reaction rate, is Avogadro’s number, is the reduced mass, is Boltzmann’s constant, is the temperature, is the center-of-mass energy in keV, and is the Gamow energy (in MeV).
The 29P()30S direct capture (DC) reaction rate to all bound states, including the ground state, was calculated assuming proton transfer into 2s and 1d final orbitals. For each final state, the S-factor was calculated by taking into account the and nature of the transitions, which were then weighted by the corresponding spectroscopic factors determined from those of the mirror states Mackh et al. (1973). The weighted S-factor contributions from each state of 30S were then summed to derive the total S-factor as a function of proton bombarding energy for each transition multipolarity.
The S-factor was then fitted with a polynomial of the form given in Eq. (10) to determine the fit parameters, i.e., , and . An uncertainty of 40% for the direct capture S-factor is adopted following the approach of Ref. Iliadis
et al. (2010b).
With increasing center-of-mass energy, resonances become important, and therefore the non-resonant S-factor in Eq. (10) is truncated at the so-called cutoff energy, after which the direct capture S-factor deviates from the total astrophysical S-factor. The cutoff energy was chosen Iliadis
et al. (2010b) at 1000 keV for the 29P()30S reaction rate.
To calculate the resonant contributions to the rate, the proton widths were determined using the expression:
| (12) |
where is the reduced mass, is the barrier penetrability (calculated using 1.25 fm) for orbital angular momentum , is the interaction radius in terms of target and projectile mass numbers ( and , respectively), and are the isospin Clebsch-Gordan coefficient and spectroscopic factor, respectively, and is the observed dimensionless single-particle reduced width.
The factors were estimated using Eq. (11) together with Table 1 of Ref. Iliadis (1997). The only exceptions were the 4+ states corresponding to the resonances at 737.7 keV and 1551 keV. The reduced widths of these resonances could not be determined from the approach of Ref. Iliadis (1997), which is limited to single-particle states in the – shells. Consequently, 1 is assumed for these states.
Spectroscopic factors were determined from neutron spectroscopic factors of the mirror states measured with 29Si()30Si Mackh et al. (1973). The mirror levels in 30Si corresponding to the resonances of 30S at 737.7 keV, 826 keV and 1551 keV were populated very weakly in the measurement of Ref. Mackh et al. (1973), and thus no values could be determined experimentally for these levels. Hence, an upper limit of 0.01 is adopted for these states, based on the sensitivity for the extraction of small spectroscopic factors. Following the procedure of Ref. Iliadis
et al. (2010b), the uncertainties in the proton widths were estimated to be 40%.
To determine the -ray partial widths (), the corresponding widths of the mirror states in 30Si were calculated from measured half-lives, branching ratios, multipolarities, and mixing ratios Basunia (2010). For the cases where mixing ratios of the transitions of interest in 30Si have not been determined experimentally or theoretically, we have assumed that such transitions are pure, with multipolarities assumed to be the dominant multipolarity of the actual mixed transition. These widths were then scaled to account for the energy difference between each mirror pair, assuming similar decay branches and reduced transition probabilities.
Only an upper limit is known for the half-life of the 2 state in 30Si. Hence, the aforementioned method of calculation of the -ray partial width is not possible for the corresponding mirror state in 30S. Therefore, we considered the 0.012 eV value from Ref. Iliadis
et al. (2010b) for the total -ray width of the 2 resonance in 30S, and scaled it to account for the differences in the measured energies. Following the procedure discussed in Ref. Iliadis
et al. (2010b), the uncertainties in -ray widths are assumed to be 50%.
The 29P()30S reaction rate was calculated using the Monte Carlo method presented in Refs. Longland et al. (2010); Iliadis
et al. (2010b, a) using 104 random samples. The input file required for calculation of the 29P()30S Monte Carlo reaction rate, including the resonance parameters, is given in Ref. Setoodehnia (2011). The numerical values of the 29P()30S rate are given in Table 7.
Since the experimental input is truncated at 6 MeV (see Table 6), there exists a temperature denoted by Iliadis
et al. (2010a), above which the nuclear physics input is insufficient to calculate a reliable reaction rate. For our case, was found to be 3 GK. The reaction rate above this temperature was therefore obtained as follows: the theoretical 29P()30S rate as a function of temperature was calculated based on the Hauser-Feshbach statistical model Newton et al. (2008) using the NON-SMOKER code Rauscher and Thielemann (2000). Then, these rates were scaled and normalized to the experimental Monte Carlo rate at 3 GK.
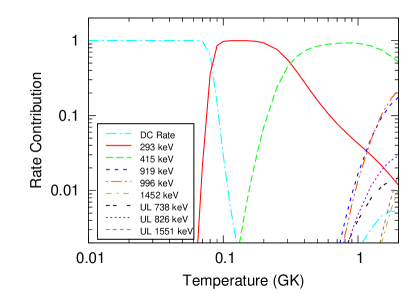
Fig. 11 compares the contributions of the direct capture rate (DC Rate) and those of the resonances listed in Table 6 to the total 29P()30S thermonuclear reaction rate. The direct capture rate dominates the total rate for T 0.08 GK, whereas at higher temperatures characteristic of explosive nucleosynthesis in novae, the total reaction rate is dominated by a single 3 resonance at 293.2 keV in the range of 0.09 – 0.3 GK. The 414.9-keV resonance with 2 is the main contributor to the total rate from 0.35 GK to 2 GK. The 996-keV resonance becomes important at temperatures higher than 2 GK, which are beyond the temperature range of interest to this work. The other resonances, including those for which only an upper limit proton partial width is known, do not contribute significantly to the 29P()30S total rate in the temperature range of interest.
Fig. 12 compares our Monte Carlo rate for the 29P()30S reaction with that of Ref. Iliadis
et al. (2010a), where the energies of the 3 and 2 states of 30S were assumed to be 4704(5) keV Bardayan et al. (2007) and
| T (GK) | Low Rate | Median Rate | High Rate | T (GK) | Low Rate | Median Rate | High Rate |
|---|---|---|---|---|---|---|---|
| 0.010 | 5.0610-42 | 7.3810-42 | 1.0810-41 | 0.130 | 2.7710-10 | 4.0110-10 | 5.8710-10 |
| 0.011 | 1.9310-40 | 2.8610-40 | 4.1910-40 | 0.140 | 1.6110-09 | 2.3310-09 | 3.4110-09 |
| 0.012 | 4.8810-39 | 7.1910-39 | 1.0610-38 | 0.150 | 7.3710-09 | 1.0710-08 | 1.5610-08 |
| 0.013 | 8.9510-38 | 1.3110-37 | 1.9110-37 | 0.160 | 2.7910-08 | 4.0210-08 | 5.8710-08 |
| 0.014 | 1.2010-36 | 1.7710-36 | 2.5910-36 | 0.180 | 2.5610-07 | 3.6610-07 | 5.2910-07 |
| 0.015 | 1.2910-35 | 1.8810-35 | 2.7410-35 | 0.200 | 1.5310-06 | 2.1610-06 | 3.0710-06 |
| 0.016 | 1.1210-34 | 1.6410-34 | 2.4210-34 | 0.250 | 4.2310-05 | 5.6510-05 | 7.6710-05 |
| 0.018 | 5.1710-33 | 7.5810-33 | 1.1110-32 | 0.300 | 4.4210-04 | 5.7010-04 | 7.3910-04 |
| 0.020 | 1.4110-31 | 2.0610-31 | 3.0110-31 | 0.350 | 2.5310-03 | 3.2310-03 | 4.1410-03 |
| 0.025 | 1.0410-28 | 1.5410-28 | 2.2710-28 | 0.400 | 9.6510-03 | 1.2410-02 | 1.5910-02 |
| 0.030 | 1.6210-26 | 2.3610-26 | 3.4910-26 | 0.450 | 2.7610-02 | 3.5610-02 | 4.6110-02 |
| 0.040 | 2.4910-23 | 3.6910-23 | 5.3810-23 | 0.500 | 6.4010-02 | 8.3010-02 | 1.0910-01 |
| 0.050 | 4.6410-21 | 6.8010-21 | 9.9010-21 | 0.600 | 2.2310-01 | 2.9310-01 | 3.8810-01 |
| 0.060 | 2.4710-19 | 3.5810-19 | 5.3310-19 | 0.700 | 5.3510-01 | 7.0910-01 | 9.4310-01 |
| 0.070 | 6.0510-18 | 8.8110-18 | 1.2810-17 | 0.800 | 1.0210+00 | 1.3510+00 | 1.8010+00 |
| 0.080 | 1.4110-16 | 1.8810-16 | 2.4910-16 | 0.900 | 1.6710+00 | 2.2110+00 | 2.9510+00 |
| 0.090 | 5.3310-15 | 7.3410-15 | 1.0310-14 | 1.000 | 2.4710+00 | 3.2610+00 | 4.3410+00 |
| 0.100 | 1.6610-13 | 2.3910-13 | 3.4710-13 | 1.250 | 5.1410+00 | 6.6710+00 | 8.7110+00 |
| 0.110 | 3.0710-12 | 4.4510-12 | 6.5210-12 | 1.500 | 8.8510+00 | 1.1210+01 | 1.4310+01 |
| 0.120 | 3.5310-11 | 5.1110-11 | 7.4910-11 |
4888(40) keV Iliadis et al. (2001), respectively.
Both rates shown in Fig. 12 are calculated using the Monte Carlo technique. Our lower resonance energies, relative to those adopted in Ref. Iliadis
et al. (2010a), for the two astrophysically important resonances, cause our median rate to be up to 2.3 times larger (at 0.1) (see top panel in Fig. 12) and up to 11.5 times larger (at 0.1) than the recommended rate of Ref. Iliadis et al. (2001). For this last rate, the energies of both astrophysically important resonances (corresponding to the 3 and 2 states in 30S) were determined theoretically based on the IMME, since none of these resonances were observed at the time.
For our present rate, the energy of the resonance corresponding to the 2 state of 30S is determined experimentally. Thus, its uncertainty of 0.9 keV is reduced by a factor of 44 with respect to the theoretical estimate of 40 keV adopted in Ref. Iliadis
et al. (2010a). Furthermore, the 2-keV uncertainty in the energy of the resonance corresponding to the 3 state in 30S, measured in this work, is also reduced by 40% with respect to the 5 keV measured in Ref. Bardayan et al. (2007) that is used to derive the rate in Ref. Iliadis
et al. (2010a).
Therefore, since these two resonances together dominate the total rate over 0.08 2 GK, the reductions in their associated uncertainties also reduce the uncertainty in the total reaction rate (see the bottom panel in Fig. 12). For example, at 0.1 GK, where the uncertainty in both our rate and that of Ref. Iliadis
et al. (2010a) is maximum, the / ratio from our Monte Carlo rate is 72% smaller than that of the Monte Carlo rate reported in Ref. Iliadis
et al. (2010a).
IV Nova isotopic abundances
In § I, it was emphasized that 29P()30S is one of the two reactions that are thought to affect the silicon isotopic ratios in nova ejecta.
To investigate the impact of the updated 29P()30S rate on the isotopic abundances of silicon synthesized in classical novae, we have computed three different models of nova outbursts, with identical input physics except for the adopted


29P()30S rate. Results from our nova nucleosynthesis simulations are presented next.
IV.1 Nova simulations
Three nova nucleosynthesis models were computed with the Lagrangian one-dimensional (spherically symmetric) full hydrodynamic and implicit code called SHIVA. Detailed information about this code is provided in Refs. Jos and Hernanz (1998); Jos
et al. (1999).
SHIVA simulates the evolution of nova outbursts from the onset of accretion to the explosion and ejection of the nova ejecta. The hydrodynamic code is coupled directly to the nuclear reaction network. Thus, in the present work, the explosion simulations at each stage are complemented with detailed nova nucleosynthesis calculations using the most updated reaction rate libraries.
As pointed out in Ref. Jos and Hernanz (1998), the material is dredged up on short timescales from the outermost shells of the CO- or ONe-rich core to the surface of the white dwarf by convective mixing processes. Nuclear reactions in stellar environments are sensitive to the temperature, and thus the ejected abundances of fragile nuclei that would have been destroyed if they had not been carried to higher and cooler layers, are increased by considering the convection process during the evolution of the nova outburst. This, in turn, makes the present simulations more realistic and suitable for defining absolute isotopic abundances resulting from nova nucleosynthesis than the previous post-processing nucleosynthesis simulations used in Refs. Iliadis et al. (2002); Bardayan et al. (2007), where the nucleosynthesis is decoupled from the hydrodynamics of the outburst.
The absolute abundances observed in nova ejecta or in presolar grains of potential nova origin provide strong constraints for improvement of nova simulations. Thus, a more precise set of constraints can be obtained if predictions on specific isotopic abundances are available.
For the present full hydrodynamic simulations, the thermodynamic profiles are identical to those of hydrodynamical simulations, given in Ref. Jos and Hernanz (1998), for a massive ONe nova with a 1.35 underlying white dwarf. Such an extreme white dwarf is adopted because a CO white dwarf shows limited activity in the Si-Ca mass region. This, in turn, is due to very little, if any, Ne, Mg and Si seed nuclei available in the outer core of a CO white dwarf, and the lower temperature achieved in a CO nova outburst Jos
et al. (2004). Thus the nucleosynthesis of silicon isotopes in CO novae, with even the most massive underlying white dwarf, is negligible.
An accretion at a rate of of solar-like matter onto a 1.35 ONe white dwarf is assumed in all three present models. 50% enrichment by the white dwarf’s core material is adopted for the accreted matter to mimic the unknown mechanism responsible for the enhancement in metals, which ultimately powers the explosion through hydrogen burning Jos
et al. (2004). The initial abundances of the seed isotopes used in the present simulations are given in Ref. Jos
et al. (2004). The impact of the new solar metallicity Grevesse et al. (2007) (decreased by about a factor of 2) on the overall results presented here has been tested and is insignificant.
In addition to hydrodynamics, a reaction rate network including 370 nuclear reactions involving 117 isotopes ranging from 1H to 48Ti is used. Monte Carlo reaction rates are adopted from the most updated compilation of Ref. Iliadis
et al. (2010a) with additional reactions selected from the reaction rate library of Iliadis (2005). The only exception is the 29P()30S reaction, whose rate is chosen (one at a time for each of the three models) from the present work, as well as from Refs. Iliadis et al. (2001); Iliadis
et al. (2010a) for comparison.
These rates are corrected for the stellar enhancement factors to allow for the increase in reaction rates associated with participation of excited states of nuclei in the reactions. Lastly, the impact of the 29P()30S stellar reaction rate on nova nucleosynthesis was compared for the three different reported rates: the recommended classical rate from Ref. Iliadis et al. (2001), hereafter model A; the median Monte Carlo rate from Ref. Iliadis
et al. (2010a), hereafter model B; and the high Monte Carlo rate from this work, henceforth model C. The main distinctions in the three 29P()30S rates used in the present nova simulations arise from different input energies and uncertainties for two resonances corresponding to the 3 and 2 states of 30S (see § III for discussion).
The selection of the high Monte Carlo rate from this work instead of the median rate is to account for the highest possible effect of the new rate on the abundances of elements synthesized in novae. While our median rate is 2.3 times larger (at 0.1 GK) than that of Ref. Iliadis
et al. (2010a) (see top panel in Fig. 12), the present high rate is a factor of 3.5 and 17 larger (at 0.1 GK) than the median rate of Ref. Iliadis
et al. (2010a) and the recommended rate of Ref. Iliadis et al. (2001), respectively.
IV.2 Results
To assign different weights to individual shells of the underlying white dwarf, the isotopic abundances obtained from the three aforementioned hydrodynamic nova simulations were averaged over mass within each shell. The total ejected envelope mass for each of the three models is 4.55 10-6 . The resulting mean abundances (in mass fractions) in the ejected envelope shells for models A to C are given in Table 8 for a selection of the stable isotopes in the Si-Ca mass region, whose abundances (in mass fractions) are greater than or equal to 10-5. Those stable isotopes not included in Tables 8 did not change significantly between models.
For the stable isotopes with 14 20 which are products of the decays of the short-lived radioactive species, a comparison was made between the mean abundances obtained from model C and those obtained from models A and B. With respect to models A and B, the largest abundance change observed from the results of model C is a 6% decrease in the abundance of 29Si. This percentage difference is defined to be: [(, where the “new” value is an isotopic abundance or ratio resulting from model C, and the “old” values are those resulting from models A or B, whichever gives a higher percentage difference. A negative (positive) percentage difference indicates that the isotopic abundance or ratio resulting from model C is decreased (increased) with respect to that obtained from model A or B.
Therefore, changing the 29P()30S rate seems to have only a small effect on the abundances of isotopes with 30 produced in a nova outburst. However, because of the reduced uncertainty in the updated 29P()30S rate, we are now more confident in the reliability of the isotopic abundances obtained using model C.
The abundance of each stable isotope alone does not provide much useful information. Instead, to compare the isotopic abundances obtained from nova simulations with those observed in presolar grains, one has to investigate an isotopic abundance ratio. For example, the silicon isotopic ratios measured in presolar grains are usually expressed as Jos
et al. (2004):
| (13) |
| Isotope | Hydrodynamic Model | ||
|---|---|---|---|
| A | B | C | |
| Ref. Iliadis et al. (2001) | Ref. Iliadis et al. (2010a) | present work | |
| (recommended) | (median) | (high) | |
| 28Si | 3.0810-02 | 3.0810-02 | 3.0810-02 |
| 29Si | 2.3810-03 | 2.3910-03 | 2.2410-03 |
| 30Si | 1.5410-02 | 1.5410-02 | 1.5110-02 |
| 31P | 8.7110-03 | 8.7310-03 | 8.6110-03 |
| 32S | 5.2710-02 | 5.2710-02 | 5.3010-02 |
| 33S | 8.0210-04 | 8.0110-04 | 8.1710-04 |
| 34S | 3.6310-04 | 3.6310-04 | 3.7110-04 |
| 35Cl | 3.8510-04 | 3.8510-04 | 3.9510-04 |
| 36Ar | 5.1410-05 | 5.1410-05 | 5.2910-05 |
| 38Ar | 2.1910-05 | 2.1910-05 | 2.2110-05 |
| Grain | Si/28Si) | Si/28Si) | Hydrodynamic |
|---|---|---|---|
| (‰) | (‰) | Model | |
| AF15bB-429-3 | 28 30 | 1118 44 | |
| AF15bC-126-3 | -105 17 | 237 20 | |
| KJGM4C-100-3 | 55 5 | 119 6 | |
| KJGM4C-311-6 | -4 5 | 149 6 | |
| 527.1 | 13970 | A | |
| 533.5 | 13970 | B | |
| 437.3 | 13678 | C |
where represents deviations from solar abundances in permil, and the adopted numerical values for the solar silicon isotopic ratios are Eva (p. 130): and . The deviations from solar abundances are computed for silicon isotopic abundance ratios obtained from models A, B and C, and the results are shown in Table 9, along with 29,30Si/28Si ratios measured Amari (2002) from some SiC presolar grains with proposed classical nova paternity.
As seen in Table 9, the theoretically predicted -values are much larger than the measured counterparts. Overall, however, regardless of the 29P()30S reaction rate used, the 29Si/28Si ratio in the ejecta resulting from the simulations is only slightly higher (1.5 times larger, see Table 8) than the solar value. Using the measured Si/28Si) values, given in Table 9, as inputs to Eq. (13), we extract a measured 29Si/28Si ratio that varies between a factor of 0.9 – 1.1 times the solar ratio, and thus is again only slightly lower or higher than the solar value. Therefore, even though the new 29P()30S rate does not significantly improve the theoretical -values, the simulated signatures are qualitatively consistent with the 29Si/28Si ratios measured in presolar grains identified to have a nova origin. In other words, the simulated and measured -values both show enhancements in the same direction.
On the other hand, the 30Si/28Si ratio in the ejecta resulting from the simulations is much higher (15 times larger) than the solar value (see Table 8), such that the classical nova ejecta resulting from the hydrodynamic models is significantly enriched in 30Si. The simulated and measured values again are in qualitative agreement with each other, i.e., enhanced in the same direction, but the magnitudes of the enhancements are not in agreement.
Our results support the indication that in order for the models to predict the 30Si/28Si ejecta ratio that quantitatively matches the grain data, one has to assume a mixing process between material newly synthesized in the nova outburst and more than 10 times as much unprocessed, isotopically close to solar, material before the process of grain formation Jos
et al. (2004); Amari et al. (2001). The details of the ejecta dilution and the grain formation processes are still unknown.
In addition to invoking the mixing with solar composition material, an increase in the 30P()31S reaction rate also helps reduce the 30Si/28Si ratio by moving the nucleosynthesis flow away from 30P toward the heavier isotopes. A decrease in the abundance of 30P consequently reduces that of 30Si produced from 30P()30Si. The rate of the 30P()31S reaction has been evaluated in Refs. Jos
et al. (2001); Wrede et al. (2009); Parikh et al. (2011) and more recently in Ref. Doherty et al. (2012). This last rate is found to be 10 times greater, at 0.25 GK, than the lower limit set in Ref. Parikh et al. (2011). A factor of 10 increase in the 30P()31S reaction rate results in a typical factor of 10 reduction in the expected abundance of 30Si Doherty et al. (2012). This new information may now help to better constrain the dilution process in new nova model predictions.
In comparison with the high Monte Carlo rate from the present work, the present median and low Monte Carlo rates show smaller deviations with respect to the median rates of Refs. Iliadis et al. (2001); Iliadis
et al. (2010a). Therefore, we did not extend our investigation to study the effects of these rates on the nova yields.
V Conclusions
The 29P()30S reaction rate at the temperature range of 0.1 1.3 GK is dominated by two low energy resonances just above the proton threshold (4394.9(7) keV) corresponding to two excited states in 30S in the 4.7 – 4.8 MeV range, whose values were previously estimated Iliadis et al. (2001) to be 3+ and 2+, respectively. We have observed these excited states in 30S at 4688.1(4) keV and 4809.8(6) keV, respectively, via two separate experiments: the 32S()30S two-nucleon transfer reaction and an in-beam -ray spectroscopy experiment via the 28Si(3He, )30S reaction.
Both of our experiments result in measured resonance energies, corresponding to the aforementioned excited states, which are in excellent agreement with each other. Moreover, we have been able to reduce the uncertainty in the energies of these resonances with respect to what was previously observed Bardayan et al. (2007) for the 3+ resonance and predicted Iliadis et al. (2001) for the 2+ resonance. Furthermore, we have confirmed the spin-parity assignments of both of these resonances. As a result, our new 29P()30S reaction rate is increased by a factor of 2 over the temperature range of 0.1 1.3 GK. Also, the uncertainty in our new rate in this temperature range has been reduced by 72% relative to that previously determined Iliadis
et al. (2010a).
This updated rate have been used to compute a full hydrodynamic nova simulation which is more realistic than the post-processing nucleosynthesis simulation performed in Ref. Iliadis et al. (2002).
Our new 29P()30S rate has only marginally improved the agreement between the abundances observed in presolar grains of potential nova origin and those obtained from simulations. Although, our updated rate does not affect the silicon isotopic abundance ratios significantly, due to a reduction in its uncertainty, the present nova hydro simulations can be compared with more reliability to the isotopic ratios measured in presolar grains of potential nova paternity.
As for the nuclear structure of 30S, improvements in spin-parity assignments may be made by theoretical estimates via the IMME for those 30S states whose spin-parity assignments are still tentative. However, this method is currently unreliable for 30 because many of the relevant analog states in 30P also have unknown or tentative spin-parity assignments Basunia (2010). Thus, if such properties of the levels of 30P are constrained better in the future, this in turn will help with the determination of those of 30S.
ACKNOWLEDGEMENTS
K.S. wishes to thank C. Iliadis, D. W. Bardayan, B. Singh and A. M. Moro for their assistance with the data analysis, as well as for providing some crucial software programs without which the data analysis could not be completed. Also, we would like to thank the staff of WNSL and the UTTAC for their contributions. This work was supported by the Natural Sciences and Engineering Research Council of Canada; the U.S. Department of Energy under Grant Nos. DE-FG02-91ER40609, DE-AC02-06CH11357 and DE-FG02-97ER41020; the Grant-in-Aid for Science Research KAKENHI 21540295 of Japan; the JSPS KAKENHI and JSPS Bilateral Joint Project of Japan; Japan Society for the Promotion of Science Core-to-Core Program on International Research Network for Exotic Femto Systems under Grant No. 18002; the DFG cluster of excellence “Origin and Structure of the Universe”; ESF EUROCORES Program EuroGENESIS through the MICINN Grant No. EUI2009-04167; and the Spanish Grant AYA2010-15685.
References
- Iliadis et al. (2002) C. Iliadis, A. E. Champagne, J. Jos, S. Starrfield, and P. Tupper, Astrophys. J. Suppl. Ser. 142, 105 (2002).
- Jos et al. (2006) J. Jos, M. Hernanz, and C. Iliadis, Nucl. Phys. A 777, 550 (2006).
- Gehrz et al. (1998) R. D. Gehrz, J. W. Truran, R. E. Williams, and S. Starrfield, Publ. Astron. Soc. Pac. 110, 3 (1998).
- Starrfield et al. (2007) S. Starrfield, C. Iliadis, W. R. Hix, F. X. Timmes, and W. M. Sparks, AIP Conf. Proc. 891, 364 (2007).
- Amari et al. (2001) S. Amari, X. Gao, L. R. Nittler, E. Zinner, J. Jos, M. Hernanz, and R. S. Lewis, Astrophys. J. 551, 1065 (2001).
- Amari (2002) S. Amari, New Astron. Rev. 46, 519 (2002).
- Jos et al. (2004) J. Jos, M. Hernanz, S. Amari, K. Lodders, and E. Zinner, Astrophys. J. 612, 414 (2004).
- Jos et al. (2001) J. Jos, A. Coc, and M. Hernanz, Astrophys. J. 560, 897 (2001).
- Iliadis et al. (2001) C. Iliadis, J. M. D’Auria, S. Starrfield, W. J. Thompson, and M. Wiescher, Astrophys. J. Suppl. Ser. 134, 151 (2001).
- Souin et al. (2011) J. Souin, P. Ascher, L. Audirac, J. Äystö, B. Blank, V.-V. Elomaa, T. Eronen, J. Giovinazzo, J. Hakala, A. Jokinen, et al., Eur. J. Phys. A 47, 40 (2011).
- Wiescher and Grres (1988) M. Wiescher and J. Grres, Z. Phys. A 329, 121 (1988).
- Iliadis et al. (2010a) C. Iliadis, R. Longland, A. E. Champagne, A. Coc, and R. Fitzgerald, Nucl. Phys. A 841, 31 (2010a).
- Bardayan et al. (2007) D. W. Bardayan, J. C. Blackmon, R. P. Fitzgerald, W. R. Hix, K. L. Jones, R. L. Kozub, J. F. Liang, R. J. Livesay, Z. Ma, L. F. Roberts, et al., Phys. Rev. C 76, 045803 (2007).
- Paddock (1972) R. A. Paddock, Phys. Rev. C 5, 485 (1972).
- Caraça et al. (1972) J. M. G. Caraça, R. D. Gill, A. J. Cox, and H. J. Rose, Nucl. Phys. A 193, 1 (1972).
- Kuhlmann et al. (1973) E. Kuhlmann, W. Albrecht, and A. Hoffmann, Nucl. Phys. A 213, 82 (1973).
- Yokota et al. (1982) H. Yokota, K. Fujioka, K. Ichimaru, Y. Mihara, and R. Chiba, Nucl. Phys. A 383, 298 (1982).
- Fynbo et al. (2000) H. O. U. Fynbo, M. J. G. Borge, L. Axelsson, J. Äystö, U. C. Bergmann, L. M. Fraile, A. Honkanen, P. Hornshj, Y. Jading, A. Jokinen, et al., Nucl. Phys. A 677, 38 (2000).
- Galaviz et al. (Geneva, 2006) D. Galaviz, A. M. Amthor, D. Bazin, B. A. Brown, A. Cole, T. Elliot, A. Estrade, Z. Fülöp, A. Gade, T. Glasmacher, et al., in Proceedings of Science: International Symposium on Nuclear Astrophysics – Nuclei in the Cosmos – IX (Geneva, 2006), PoS(NIC-IX)099.
- (20) J. M. Figueira et al., Argonne National Laboratory ATLAS Proposal No. 1242 (2008), (unpublished).
- O’Brien et al. (2009) S. O’Brien, T. Adachi, G. P. A. Berg, M. Couder, M. Dozono, H. Fujita, Y. Fujita, J. Grres, K. Hatanaka, D. Ishikawa, et al., AIP Conf. Proc. 1090, 288 (2009).
- Galaviz et al. (2010) D. Galaviz, A. M. Amthor, D. Bazin, A. D. Becerril, B. A. Brown, A. A. Chen, A. Cole, J. M. Cook, T. Elliot, A. Estrade, et al., J. Phys.: Conf. Ser. 202, 012009 (2010).
- Setoodehnia et al. (2010) K. Setoodehnia, A. A. Chen, J. Chen, J. A. Clark, C. M. Deibel, S. D. Geraedts, D. Kahl, P. D. Parker, D. Seiler, and C. Wrede, Phys. Rev. C 82, 022801(R) (2010).
- Setoodehnia et al. (2011) K. Setoodehnia, A. A. Chen, T. Komatsubara, S. Kubono, D. N. Binh, J. F. Carpino, J. Chen, T. Hashimoto, T. Hayakawa, Y. Ishibashi, et al., Phys. Rev. C 83, 018803 (2011).
- Setoodehnia (2011) K. Setoodehnia, Ph.D. thesis, McMaster University (2011), http://digitalcommons.mcmaster.ca/opendissertations/6313/.
- Lennard et al. (2011) W. N. Lennard, K. Setoodehnia, A. A. Chen, and J. Hendriks, Nucl. Instr. Meth. Phys. Res. B 269, 2726 (2011).
- Bell et al. (1969) R. A. I. Bell, J. L’Ecuyer, R. D. Gill, B. C. Robertson, I. S. Towner, and H. J. Rose, Nucl. Phys. A 133, 337 (1969).
- Bohne et al. (1982) W. Bohne, K. D. Bchs, H. Fuchs, K. Grabisch, D. Hilscher, U. Jahnke, H. Kluge, T. G. Masterson, and H. Morgenstern, Nucl. Phys. A 378, 525 (1982).
- Caggiano et al. (2002) J. A. Caggiano, W. Bradfield-Smith, R. Lewis, P. D. Parker, D. W. Visser, J. P. Greene, K. E. Rehm, D. W. Bardayan, and A. E. Champagne, Phys. Rev. C 65, 055801 (2002).
- Bardayan et al. (2002) D. W. Bardayan, J. C. Blackmon, A. E. Champagne, A. K. Dummer, T. Davinson, U. Greife, D. Hill, C. Iliadis, B. A. Johnson, R. L. Kozub, et al., Phys. Rev. C 65, 032801(R) (2002).
- Parpottas et al. (2004) Y. Parpottas, S. M. Grimes, S. A. Quraishi, C. R. Brune, T. N. Massey, J. E. Oldendick, A. Salas, and R. T. Wheeler, Phys. Rev. C 70, 065805 (2004).
- Seweryniak et al. (2007) D. Seweryniak, P. J. Woods, M. P. Carpenter, T. Davinson, R. V. F. Janssens, D. G. Jenkins, T. Lauritsen, C. J. Lister, J. Shergur, S. Sinha, et al., Phys. Rev. C 75, 062801 (2007).
- Matic et al. (2010) A. Matic, A. M. V. D. Berg, M. N. Harakeh, H. J. Wrtche, G. P. A. Berg, M. Couder, J. Grres, P. LeBlanc, S. O’Brien, M. Wiescher, et al., Phys. Rev. C 82, 025807 (2010).
- Kwiatkowski et al. (2010) A. A. Kwiatkowski, B. R. Barquest, G. Bollen, C. M. Campbell, R. Ferrer, A. E. Gehring, D. L. Lincoln, D. J. Morrissey, G. K. Pang, J. Savory, et al., Phys. Rev. C 81, 058501 (2010).
- Wrede et al. (2010) C. Wrede, J. A. Clark, C. M. Deibel, T. Faestermann, R. Hertenberger, A. Parikh, H.-F. Wirth, S. Bishop, A. A. Chen, K. Eppinger, et al., Phys. Rev. C 81, 055503 (2010).
- (36) P. D. Kunz, DWUCK5, website: http://spot.colorado.edu/~kunz/DWBA.html.
- Thompson (1988) I. J. Thompson, Comput. Phys. Rep. 7, 167 (1988).
- Tribble and Kubo (1977) R. E. Tribble and K.-I. Kubo, Nucl. Phys. A 282, 269 (1977).
- R. V. Reid (1968) J. R. V. Reid, Ann. Phys. (N. Y.) 50, 411 (1968).
- Basunia (2010) M. S. Basunia, Nucl. Data Sheets 111, 2331 (2010).
- Groenevbld et al. (1970) K. O. Groenevbld, B. Hubert, R. Bass, and H. Nann, Nucl. Phys. A 151, 198 (1970).
- Bass et al. (1972) R. Bass, U. Friedland, B. Hubert, H. Nann, and A. Reiter, Nucl. Phys. A 198, 449 (1972).
- Alburger and Goosman (1974) D. E. Alburger and D. R. Goosman, Phys. Rev. C 9, 2236 (1974).
- (44) B. Singh (private communication).
- Litherland and Ferguson (1961) A. E. Litherland and A. J. Ferguson, Can. J. Phys. 39, 788 (1961).
- Morinaga and Yamazaki (1976) H. Morinaga and T. Yamazaki, In-Beam Gamma-Ray Spectroscopy (North Holland Publishing Co., 1976).
- Yamazaki (1967) T. Yamazaki, Nucl. Data A 3, 1 (1967).
- Iliadis (2007) C. Iliadis, Nuclear Physics of Stars (Wiley-VCH, Weinheim, 2007).
- Rasmussen and Sugihara (1966) J. O. Rasmussen and T. T. Sugihara, Phys. Rev. 151, 992 (1966).
- der Mateosian and Sunyar (1974a) E. der Mateosian and A. W. Sunyar, At. Data Nucl. Data Tables 13, 391 (1974a).
- Krane and Steffen (1970) K. S. Krane and R. M. Steffen, Phys. Rev. C 2, 724 (1970).
- Rose and Brink (1967) H. J. Rose and D. M. Brink, Rev. Mod. Phys. 39, 306 (1967).
- der Mateosian and Sunyar (1974b) E. der Mateosian and A. W. Sunyar, At. Data Nucl. Data Tables 13, 407 (1974b).
- Nuc (2010) Summary of Bases for Spin and Parity Assignments, Nucl. Data Sheets, 111, iv (2010).
- Krmer-Flecken et al. (1989) A. Krmer-Flecken, T. Morek, R. M. Lieder, W. Gast, G. Hebbinghaus, H. M. Jger, and W. Urban, Nucl. Instr. Meth. Phys. Res. A 275, 333 (1989).
- (56) B. A. Brown (private communication).
- (57) W. A. Richter (private communication).
- Mackh et al. (1973) H. Mackh, H. Oeschler, G. J. Wagner, D. Dehnhard, and H. Ohnuma, Nucl. Phys. A 202, 497 (1973).
- Iliadis et al. (2010b) C. Iliadis, R. Longland, A. E. Champagne, and A. Coc, Nucl. Phys. A 841, 251 (2010b).
- Iliadis (1997) C. Iliadis, Nucl. Phys. A 618, 166 (1997).
- Longland et al. (2010) R. Longland, C. Iliadis, A. E. Champagne, J. R. Newton, C. Ugalde, A. Coc, and R. Fitzgerald, Nucl. Phys. A 841, 1 (2010).
- Newton et al. (2008) J. R. Newton, R. Longland, and C. Iliadis, Phys. Rev. C 78, 025805 (2008).
- Rauscher and Thielemann (2000) T. Rauscher and F.-K. Thielemann, At. Data Nucl. Data Tables 75, 1 (2000).
- Jos and Hernanz (1998) J. Jos and M. Hernanz, Astrophys. J. 494, 680 (1998).
- Jos et al. (1999) J. Jos, A. Coc, and M. Hernanz, Astrophys. J. 520, 347 (1999).
- Grevesse et al. (2007) N. Grevesse, M. Asplund, and A. J. Sauval, Space Sci. Rev. 130, 105 (2007).
- (67) S. Starrfield, C. Iliadis and W. R. Hix, in Classical Novae, edited by M. F. Bode and A. Evans (Cambridge University Press, 2008 – 2nd edn.).
- Wrede et al. (2009) C. Wrede, J. A. Caggiano, J. A. Clark, C. M. Deibel, A. Parikh, and P. D. Parker, Phys. Rev. C 79, 045803 (2009).
- Parikh et al. (2011) A. Parikh, K. Wimmer, T. Faestermann, R. Hertenberger, J. Jos, R. Longland, H.-F. Wirth, V. Bildstein, S. Bishop, A. A. Chen, et al., Phys. Rev. C 83, 045806 (2011).
- Doherty et al. (2012) D. T. Doherty, G. Lotay, P. J. Woods, D. Seweryniak, M. P. Carpenter, C. J. Chiara, H. M. David, R. V. F. Janssens, L. Trache, and S. Zhu, Phys. Rev. Lett. 108, 262502 (2012).