]mpi-inf.mpg.de/lawyer see also: ]www.scipirate.com
Measuring node spreading power by expected cluster degree
Abstract
Traditional metrics of node influence such as degree or betweenness identify highly influential nodes, but are rarely usefully accurate in quantifying the spreading power of nodes which are not. Such nodes are the vast majority of the network, and the most likely entry points for novel influences, be they pandemic disease or new ideas. Several recent works have suggested metrics based on path counting. The current work proposes instead using the expected number of infected-susceptible edges, and shows that this measure predicts spreading power in discrete time, continuous time, and competitive spreading processes simulated on large random networks and on real world networks. Applied to the Ugandan road network, it predicts that Ebola is unlikely to pose a pandemic threat.
pacs:
87.10.Mn, 87.19.X-Networks have become the premier approach to describing spreading processes such as epidemics because they express the heterogeneity of interactions Danon2011 . Early metrics of node influence focused on identifying highly influential nodes from the macroscopic structure of the network such as degree Albert2002 , k-shell Kitsak2010 , or centrality Freeman1979 ; Friedkin1991 . These measures, however, only rank the nodes without quantifying the outcome Bauer2012 , and do not account for the dynamics of the spreading process Klemm2012 .
Highly influential nodes are unlikely to be disease entry points. They are, by definition, rare. Nor are they biological targets. More than half of all new or emerging infectious disease agents in humans are zoonotic in origin Taylor2001 ; Reperant2010 and thus closer to the periphery of society. Highly contagious diseases such as pandemic influenza circulate at low levels for months or years before epidemic breakout Xu2012 . Worryingly, structural measures of node centrality may considerably underestimate the spreading power of non-hub nodes Sikic2011 .
Only recently have measures been proposed which take into account the spreading process. To date, and to the best of our knowledge, these are limited to path counting approaches. Path counting was first proposed as the Accessibility metric, the exponential of the entropy of the number of paths Travencolo2008 ; Viana2012 . Path counting is also the basis of the impact Bauer2012 and the dynamic influence Klemm2012 , both of which include transition/transmission probabilities when calculating path length. A recent comparison of a number of measures, including accessibility, betweenness centrality, clustering, degree, and k-shell, found that the accessibility and the (weighted) degree were most predictive of an individual node’s spreading potential across a range of different network models daSilva2012 . Spreading processes, however, are not constrained to follow paths; they form clusters.
We here show that measuring node spreading power by taking the expectation of the degree of a disease cluster seeded from a single node accurately quantifies the spreading power of that node. Spreading power is assessed in three contexts. The simplest epidemic model is a susceptible-infected (SI) epidemic. Since infected nodes do not recover, such a process will in time infect every node connected to a seed node. When transmission is modelled in continuous time, node spreading power can be measured in terms of the expected time until half the network is covered. A model allowing for recovery, the susceptible-infected-susceptible (SIS), raises the possibility that the outbreak dies out if nodes do not transmit before recovery. Node spreading power can here be measured by estimating a node’s probability of seeding an epidemic. Node spreading power can thirdly be assessed via a competitive spreading process in which two mutually hostile infections invade a network. This problem has been attracting considerable attention in the alogirthmics and social networks communities, where it is now known that determining the optimal starting point(s) is NP-hard Kostka2008 . In scale-free networks, where growth in prevalence is near instantaneous Lloyd2001 ; Barthelemy2005 , with asymptotic time to full coverage fountoulakis2012 , victory goes to the team which is nearer to instantaneous. The relative spreading power of the seed nodes determines the outcome. We conclude by assessing the spreading power of nodes formed by junctions in the Uganda road network, in the context of the recent Ebola outbreaks.
Define the degree of a cluster of nodes as the number of edges connecting nodes within to nodes outside the cluster. Then the Expected Reach of node , , is the expectation of the degree of the infected cluster formed after infections seeded from . As the rate of disease spread is inversely proportional to the number of edges from infected to susceptible individuals, it is often preferable to work with the inverse of the , the Expected Wait . In a continuous time processes seeded from node , the expected wait until infection given that infections have occurred is , where is the transmission probability along a single edge. The distribution of values shown in the histogram in Figure 1.
The can be found by enumerating all possible clusters of infected nodes which could occur after infection events originating from and taking the mean cluster degree of this set. For , the cluster is node , and is the degree of . For , the clusters are the set of all pairs where is a neighbour of , the degree of each cluster is , and is the mean of taken over all which are neighbours of .
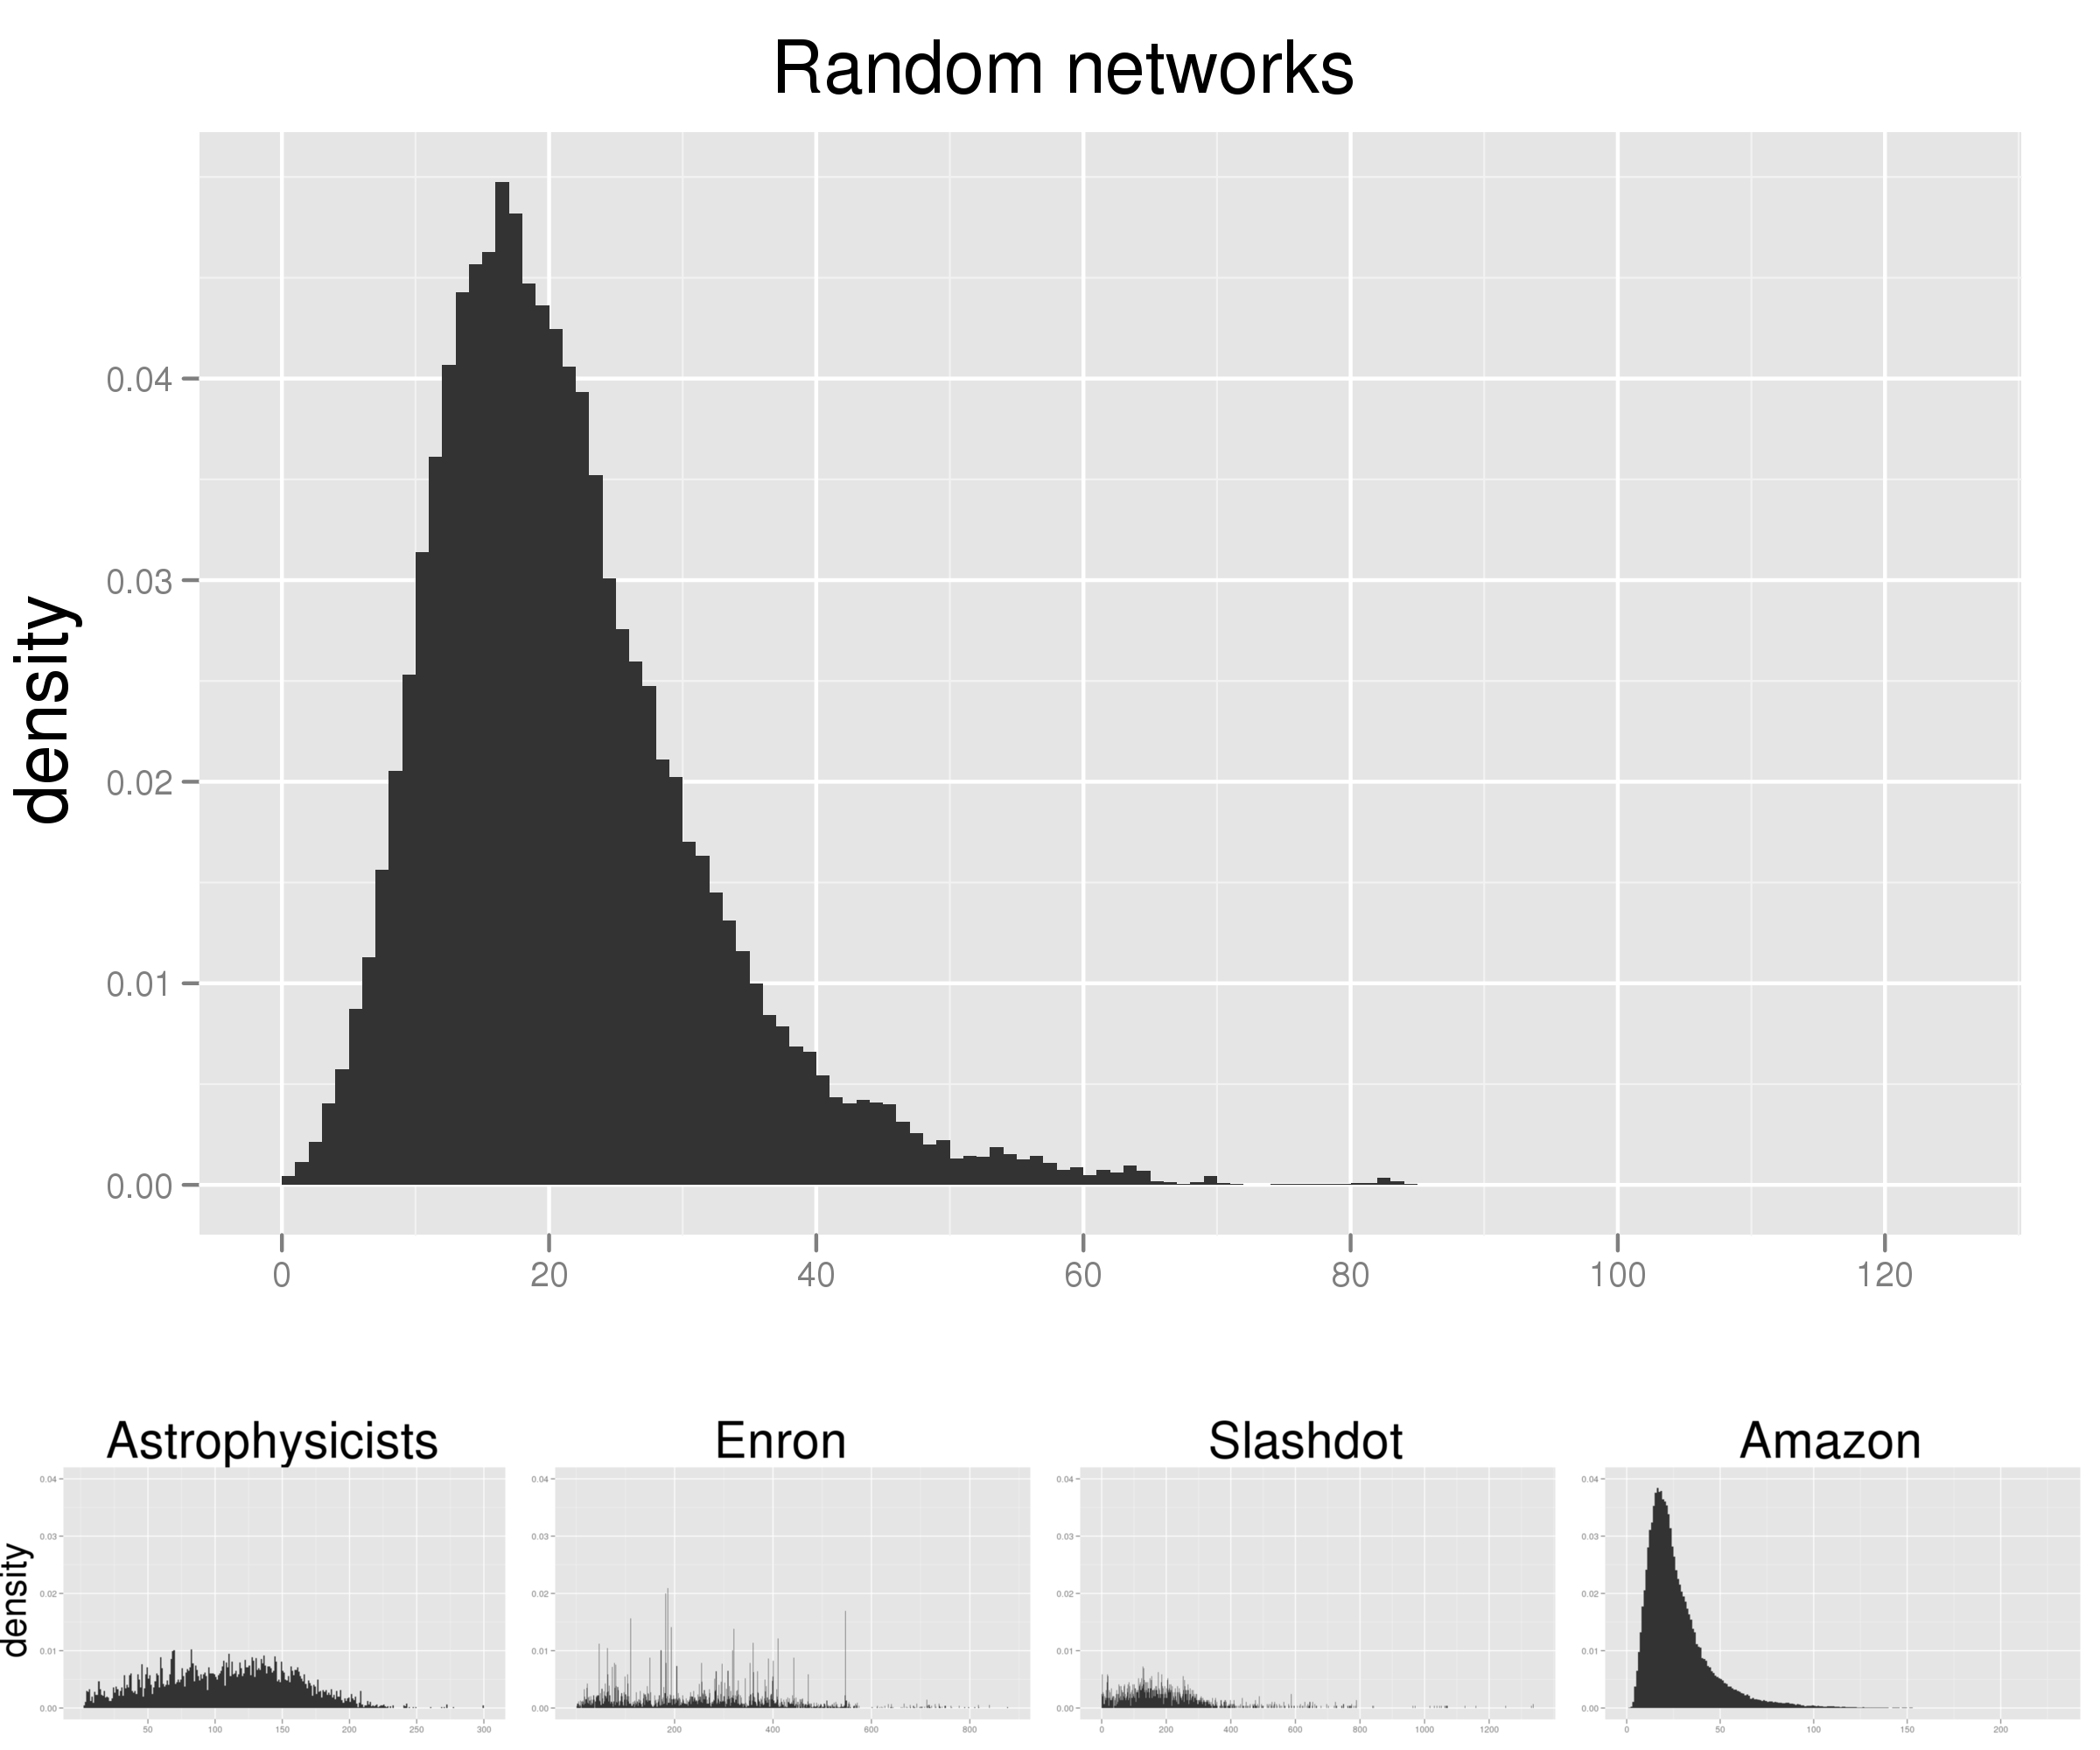
Results are based on extensive simulations conducted both on random scale-free networks with nodes and real-world networks with to nodes. The random networks are generated to have a Pareto (1, 2.3) degree distribution under the Chung Lu protocol Chung2002 . Real world networks include: the collaboration network from ArXiv Astrophysics Leskovec2007 , Enron emails Leskovec2009 , the Slashdot Zoo signed social network from Feb 21 2009 Leskovec2009 , and Amazon co-purchases Leskovec2007a ; see Table 1.
| nodes | density | ||
|---|---|---|---|
| Random | 8,192 | 12.2 | 4.32 e-04 |
| Astrophysics Leskovec2007 | 18,772 | 94.4 | 0.22 e-04 |
| Enron Leskovec2009 | 36,692 | 118.4 | 2.73 e-04 |
| Slashdot Leskovec2009 | 82,168 | 124.7 | 1.61 e-04 |
| Amazon Leskovec2007a | 262,111 | 5.3 | 0.26 e-04 |
The of all peripheral nodes is measured, with peripheral nodes defined as those three or more hops distant from the closest hub, and hubs defined as nodes with degree greater than 60% of the maximum degree node of the network. Approximately 75% of the nodes in the random networks meet this criteria. The Slashdot and Amazon networks have over nodes; in these cases only nodes greater than three hops from a hub are considered. In the random networks, is quantinized to by truncating the inverse to the next lower hundredth, i.e. . This gives approximately equal number of nodes for each value of . In the real-world networks, the quantization is independently scaled give approximately uniform representation of the lower values of the resulting .
Expected reach is predictive of the mean time for an infection originating at a peripheral node to cover half the network in a disease without recovery simulated in continuous time (SI model). Expected time to half coverage (tthc) is measured by simulating epidemics for each seed node, measuring the time until half the nodes are infected, and fitting the measurements to an exponential distribution. Seed nodes are five randomly selected nodes at each observed value of on random networks. For higher (and thus rarer) values, it is not always possible to select five nodes; in such cases all observed values are used. The accessibility metric Travencolo2008 is also measured for each node. Logistic regression over the resulting 4563 observations shows that both and accessibility are highly predictive of tthc, with longer expected wait associated with longer tthc. The , however, explains more of the deviance (71% vs 48%) and has a lower AIC (-12376 vs -9831). A similar procedure was performed on the real-world networks, again achieving significance in all cases as detailed in Table 2.
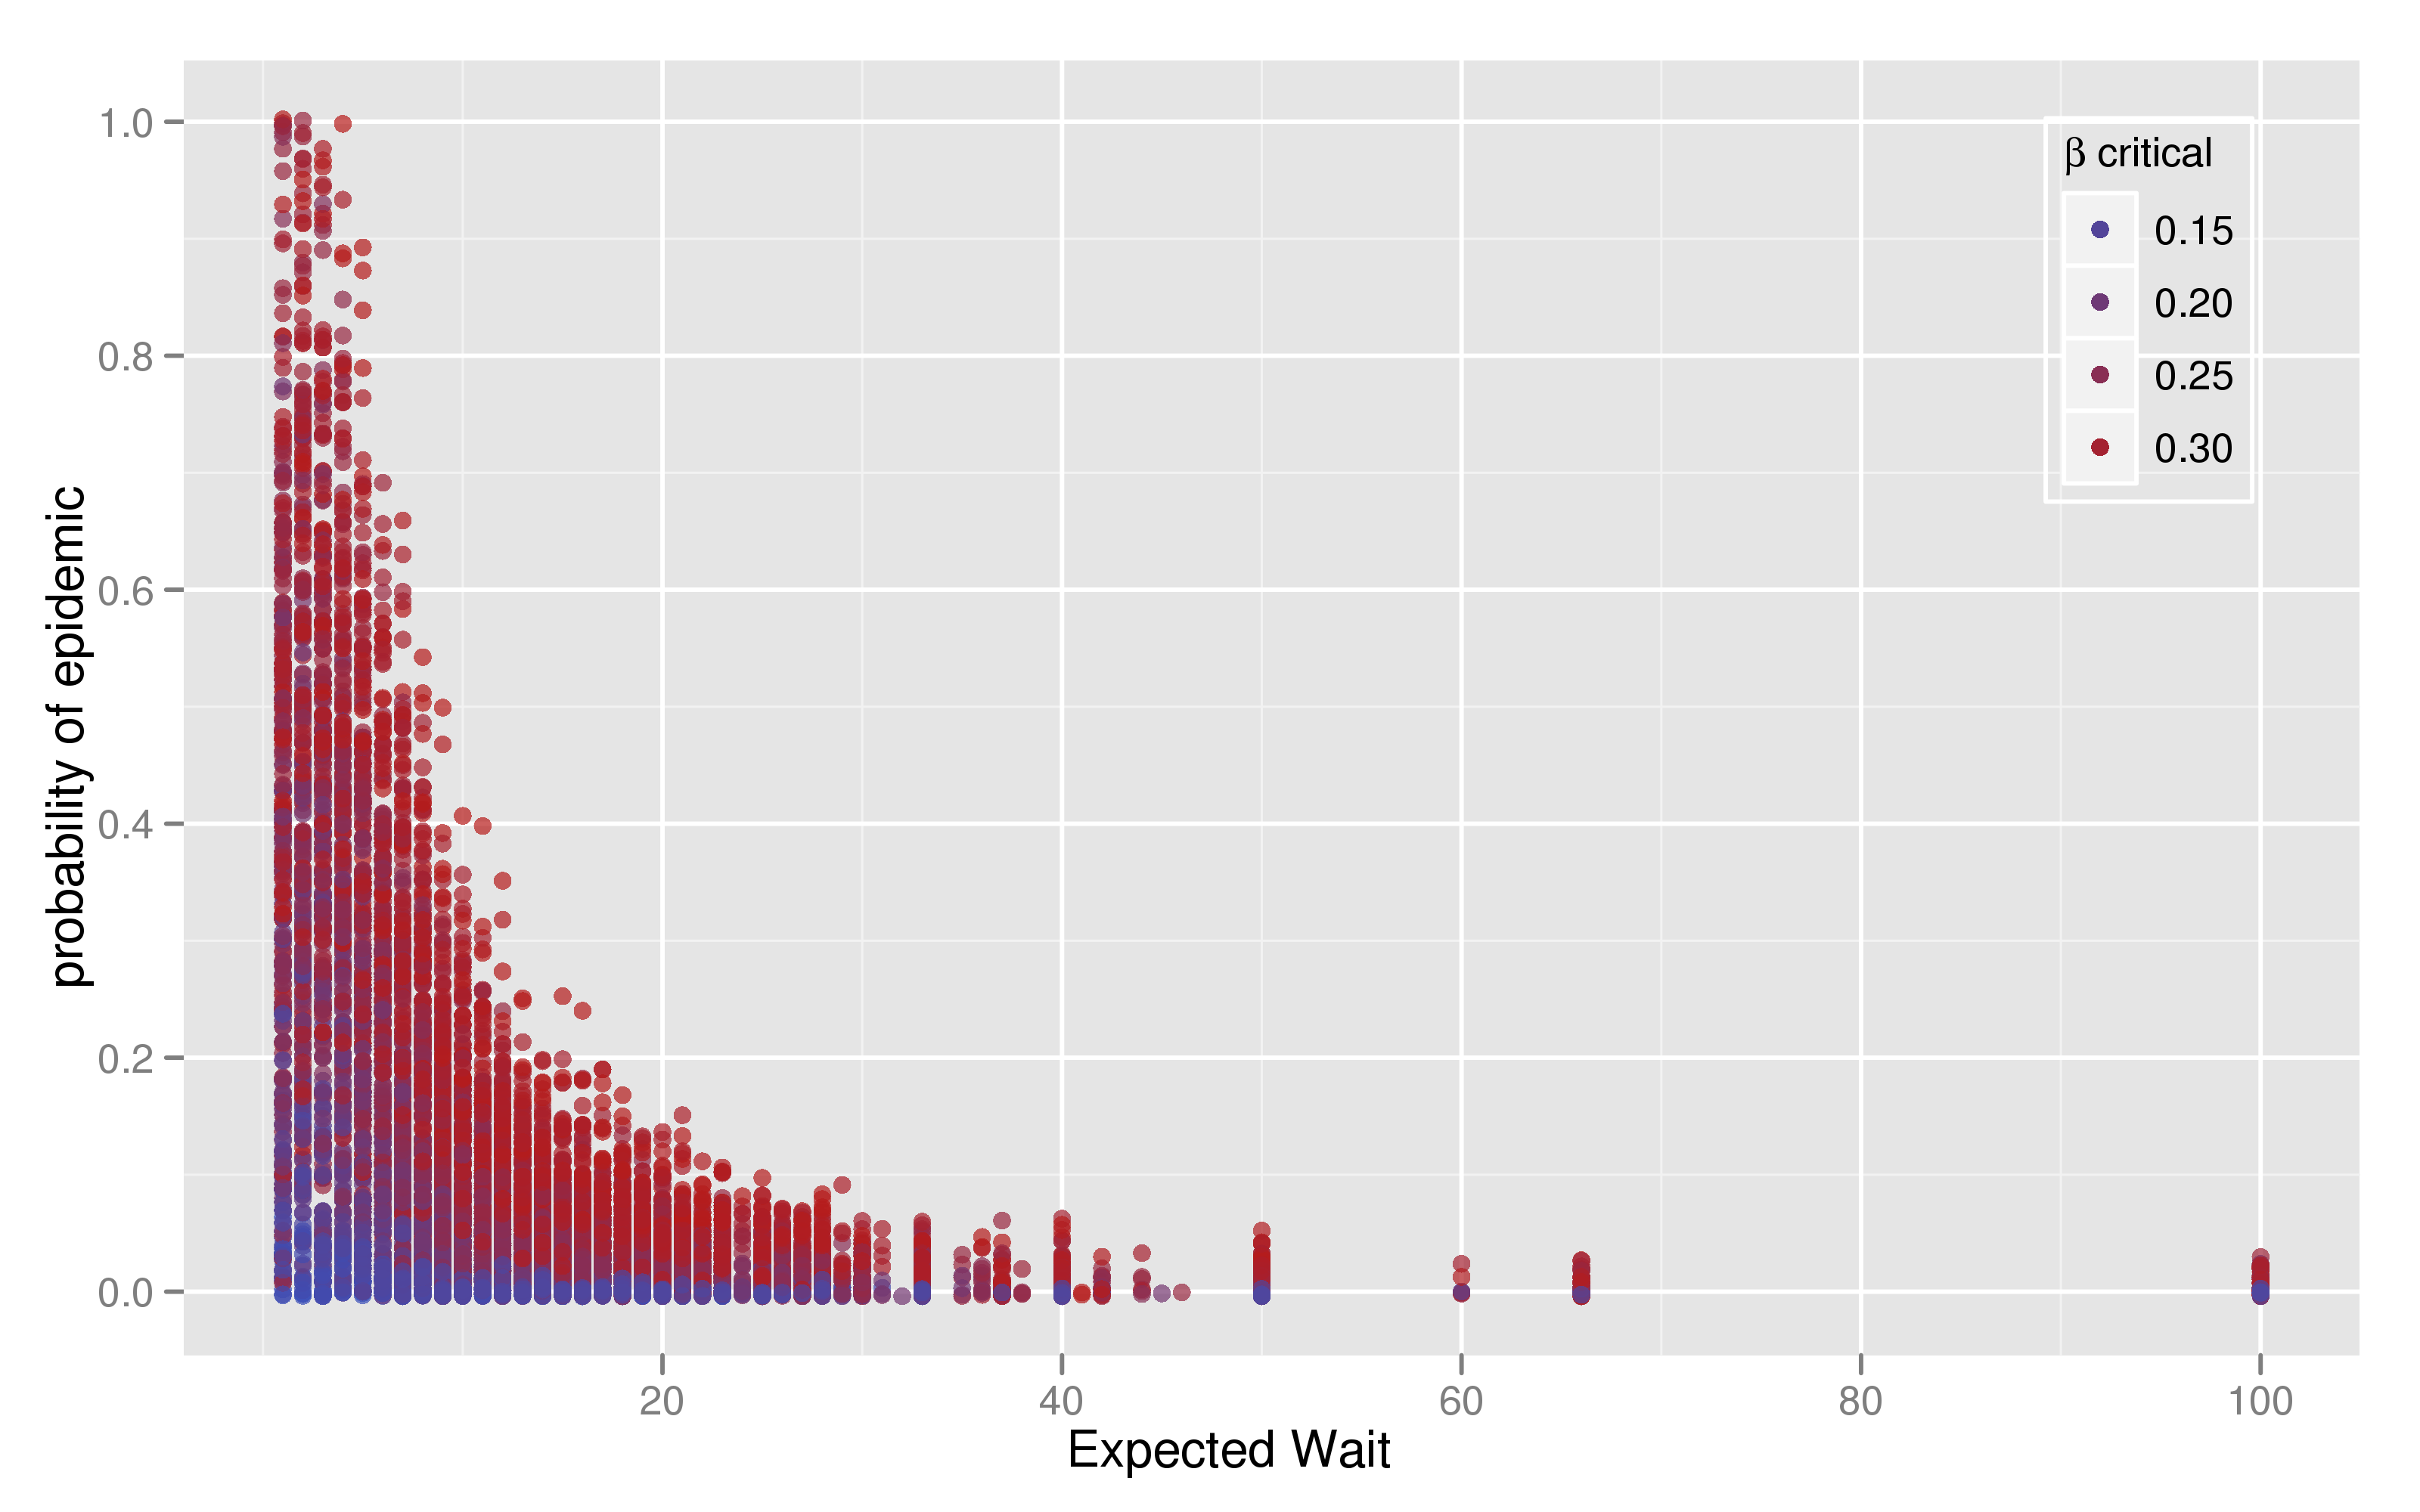
The expected reach is indicative of a node’s ability to seed a sustained epidemic in disease with unit time recovery simulated in discrete time (SIS model). Epidemic potential is measured by simulating 100 epidemics and counting how many persist for 50 iterations 111In 20620 runs, infections which go extinct usually (93%) do so in less than five iterations, and universally in less than 20.. Klemm et al. propose that for a discrete time process with unit recovery, the critical transmission probability value separating the extinciton from endemic regime is the inverse of the largest eigenvalue of the adjacency matrix Klemm2012 . This suggests that is also a measure of a network’s susceptibility to infection. Transmision probability is here set to , placing the simulated epidemic well within the epidemic regime, with determined independently for each random network. Five seed nodes are sampled for each observed value on random networks A generalize additive model of the resulting 8678 observations shows that the combination of and (thus controlling for the network’s susceptibility to epidemic) explain 68% of the deviance in the probability that a node can start an epidemic. Due to the large number of observations at low , the relationship is more clearly illustrated in terms of the expected wait (Figure 2). The also explains a significant portion of the deviance in the real-world networks, as shown in Table 2. Setting did not produce consistent results in the real world networks. No nodes had high epidemic potential at this level, with the exception of the Amazon network in which all did. To control for this variability, is tuned such that nodes with high have epidemic potential approaching 100%. In the astrophysics collaboration network, this requires setting , reducing the model fit from explaining 53% (at ) to 47% of the deviance.
| SI model | SIS model | |||
| dev explained | p-value | dev explained | p-value | |
| Astrophysics | 47% | 1.10e-07 | 47% | |
| Enron | 38% | 9.95e-06 | 15% | 1.2 e-6 |
| Slashdot | 32% | 0.037 | 17% | 1.24 e-4 |
| Amazon | 65% | 0.0005 | 80% | |
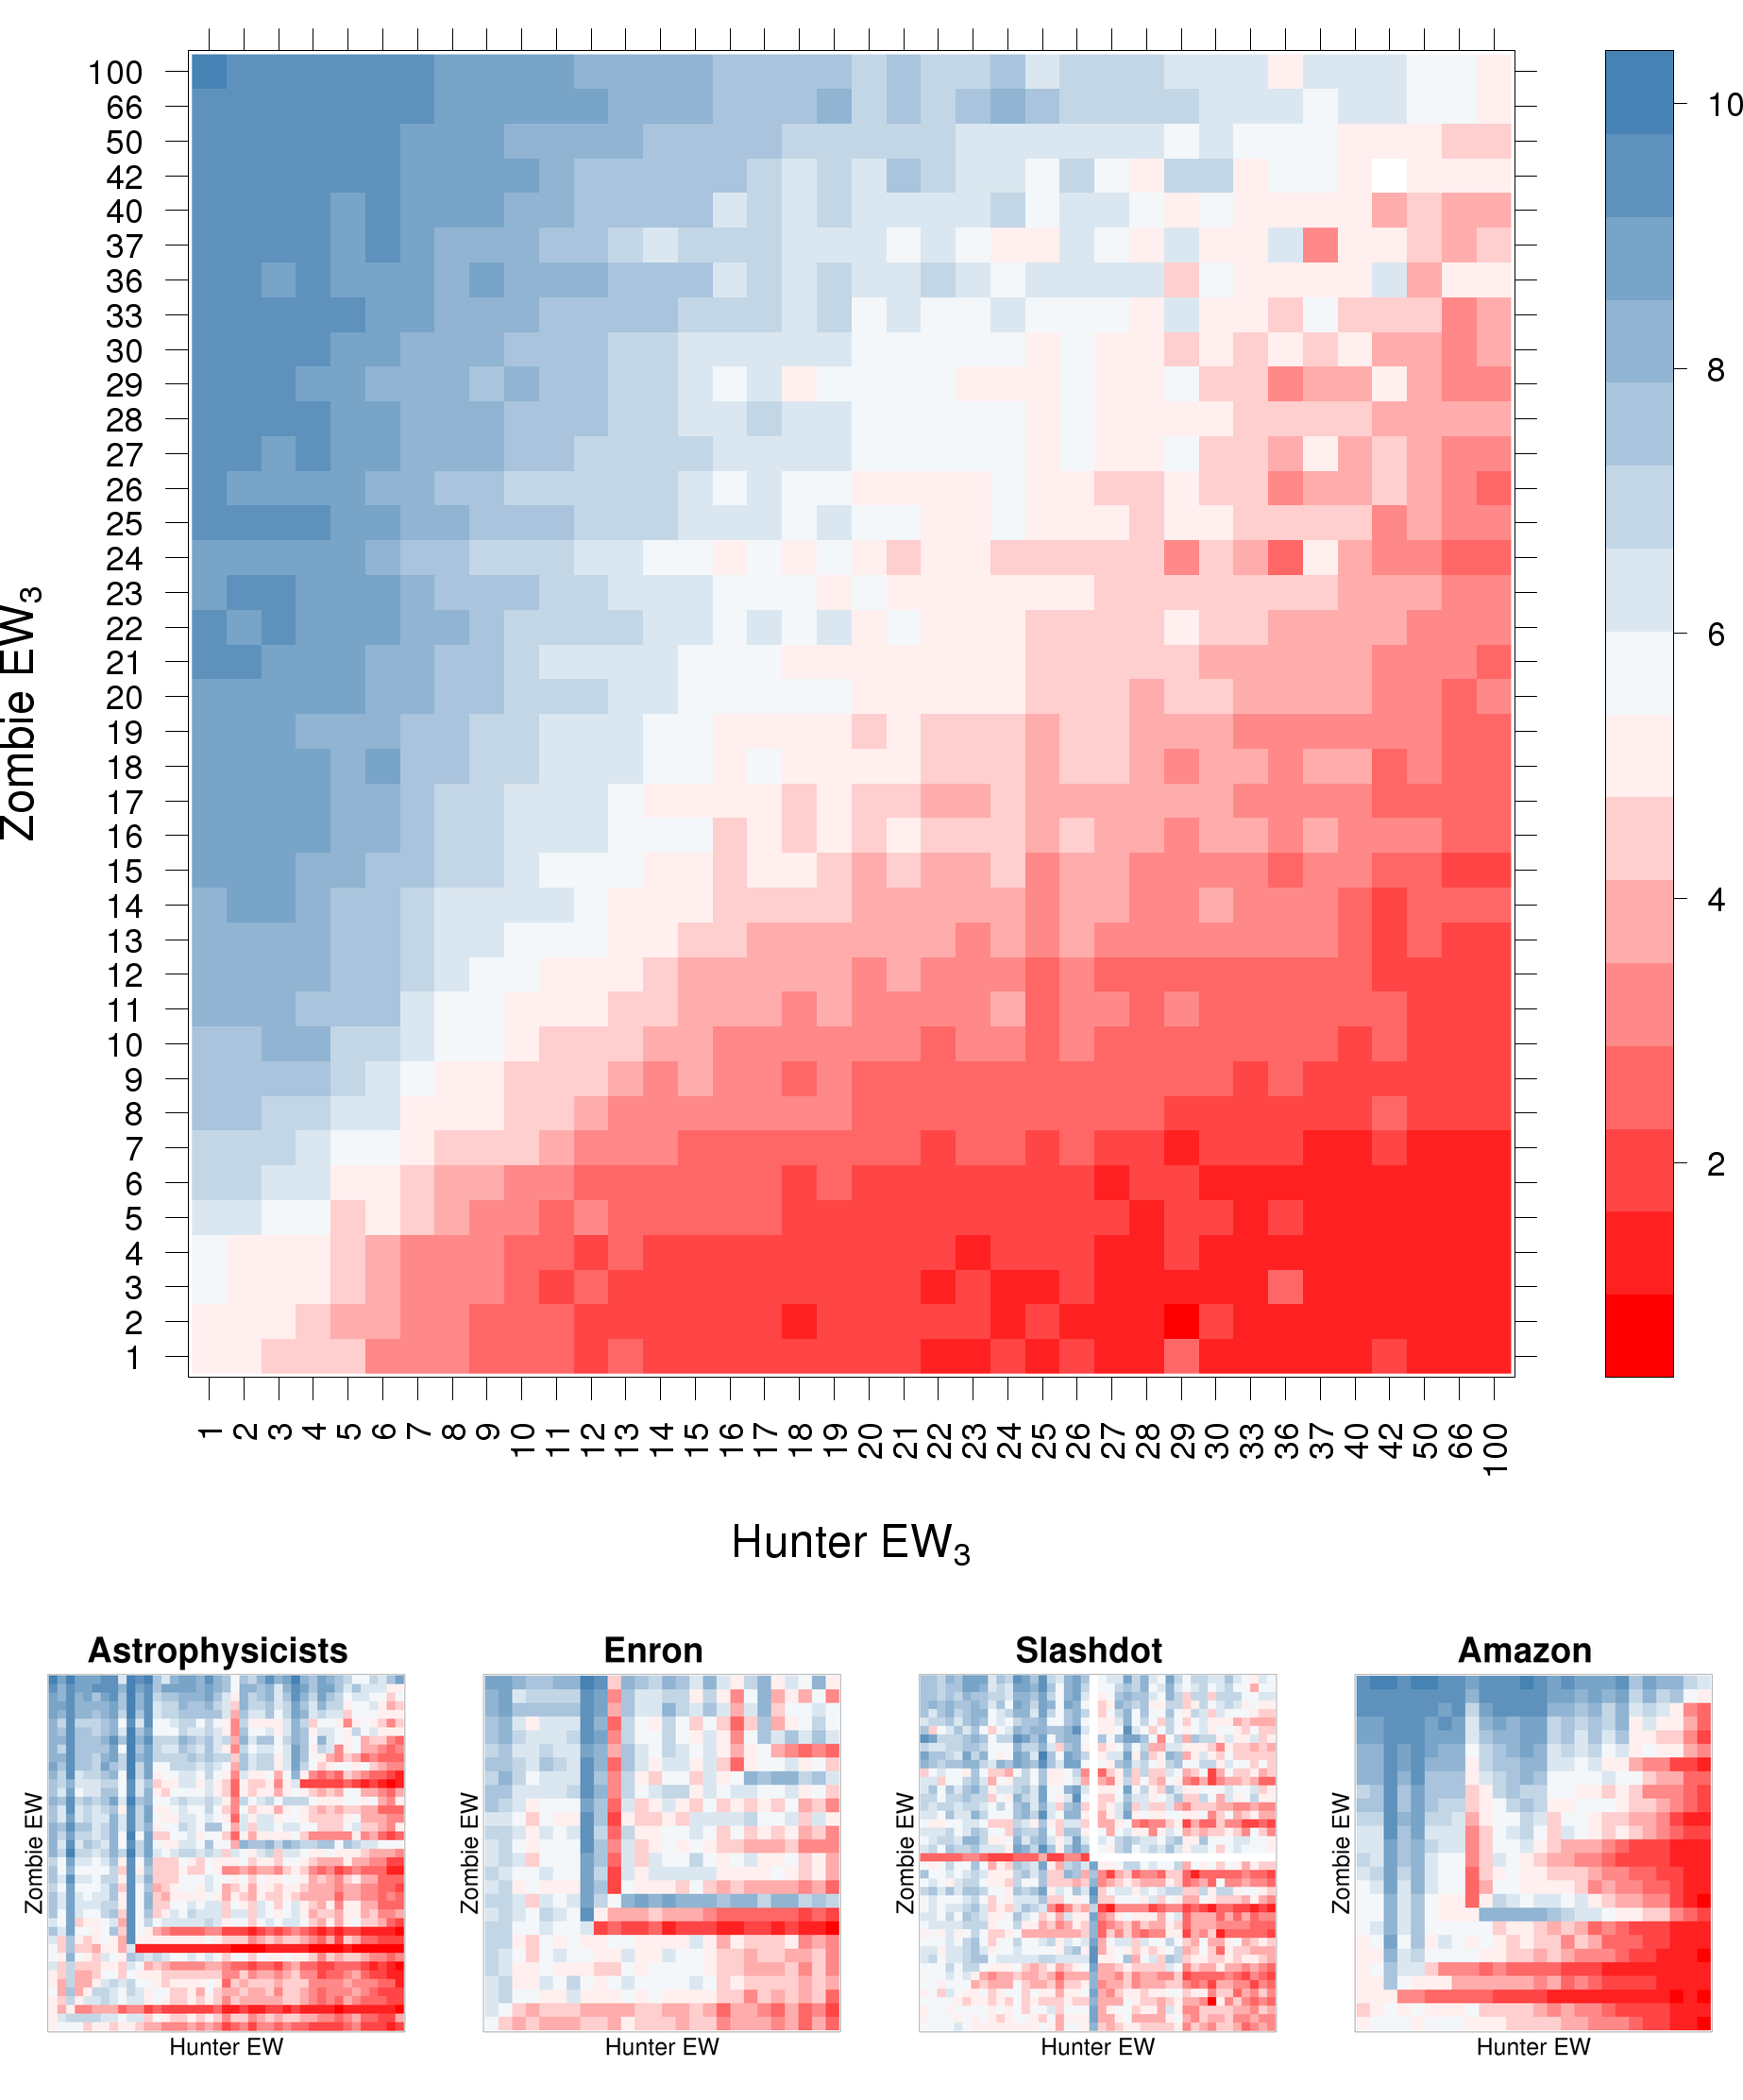
The expected reach predicts the outcome of a competitive spreading process simulated in continuous time. Here, we use a toy example of a zombie apocalypse met by concurrent spread of education in zombie hunting. Both zombies and hunters recruit from the susceptible population and mutually eliminate each other. For each network, a grid is formed for all possible pairings of observed values. Ten epidemics are simulated at each point in the grid with one initial zombie and one initial hunter chosen randomly from nodes with values corresponding to the grid point value. The apocalypse is simulated in continuous time with the base rate of zombification and of hunter training equal. The outcome measure is the number of times (out of ten) the humans win, averaged at each point of the grid over random networks. A analogous process is applied to the real-world networks. In the random networks, the spreading process with the lower expected waiting time wins at least 50% of the time. The larger the difference in , the greater the margin of victory. Results are similar, though less distinct, in the real world network (Figure 3.)
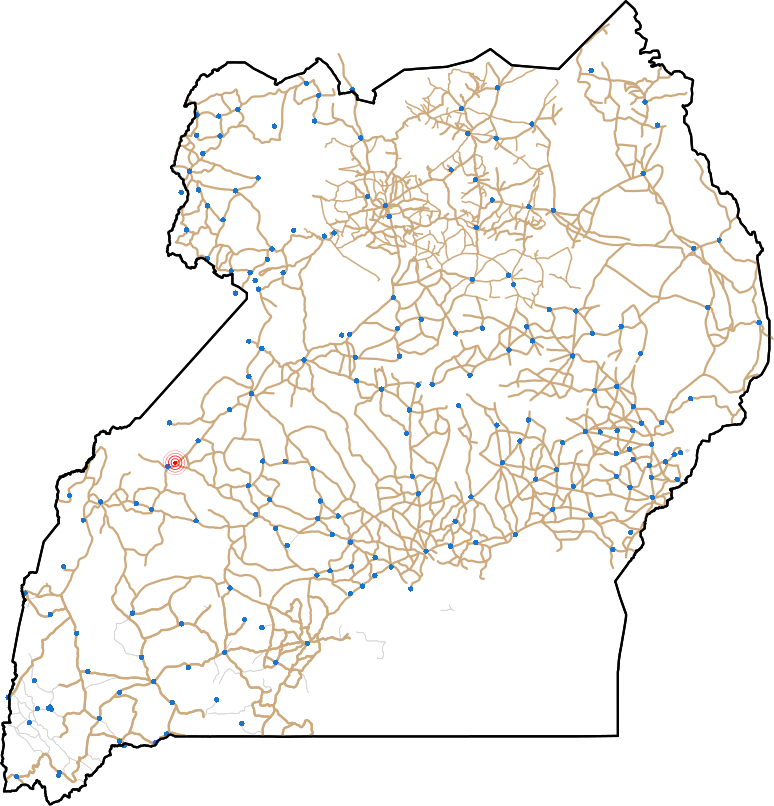
Finally, we turn our attention to the recent Ebola outbreak in Uganda. We make the simplifying assumption that the disease transmits between communities along the road network, and we regard this network as an unweighted, undirected graph with nodes at each road junction. Road data current as of 2009 is available from Humanitarian Response humres . The 2012 epidemic originated in the village of Kigadi which sits at the juncture of three roads (Figure 4). The of this juncture is 5.1, implying that it has limited spreading power. In fact, the majority of peripheral nodes have , suggesting that Elboa would have a hard time transitioning from a local to a national epidemic even with a less vigorous response from Medicine Sans Frontieres.
While is sufficient for predictive purposes, the expectation is not unproblematic. The distribution over which the expectation is taken is strongly bimodal. Most ( 80%) of the nodes analyzed here are three hops distant from a hub. The infection clusters which contain this hub have reach typically exceeding 300, while the clusters which do not have reach typically less than 100.
Computational expense is a concern, but generally not a problem in practice. The number of clusters grows factorially in the degree of nodes reachable from after hops. This problem is not severe, however, as the measure is designed for nodes where this degree is small, and is sufficient to determine the outcome, a result supported by the path counting literature Bauer2012 ; Klemm2012 . Running time for our non-optimized C++ code is comprable to that reported by Bauer et al. for counting all paths of length 4 under a SIR model Bauer2012 .
Arguements explaining that path counting is categorically different from degree or centrality based measures Travencolo2008 also apply to the expected cluster degree. In networks with heterogeneous degree distributions, node degree is generally not correlated with neighbours. Chained nodes with high betweenness centrality can lead to low expected reach. Expected cluster degree is also distict, though not categorically, from path counting in that it directly measures the expected number of infected-susceptible edges.
References
- (1) L. Danon, A. P. Ford, T. House, C. P. Jewell, M. J. Keeling, G. O. Roberts, J. V. Ross, and M. C. Vernon, Interdiscip Perspect Infect Dis 2011, 284909 (2011)
- (2) R. Albert and A.-L. Barabási, Reviews of Modern Physics 74, 47 (2002)
- (3) M. Kitsak, L. K. Gallos, S. Havlin, F. Liljeros, L. Muchnik, H. E. Stanley, and H. a. Makse, Nature Physics 6, 888 (Aug. 2010), ISSN 1745-2473
- (4) L. C. Freeman, Social Networks 1, 215 (1979)
- (5) N. Friedkin, American Journal of Sociology 96, 1478 (1991)
- (6) F. Bauer and J. Lizier, “Identifying influential spreaders and efficiently estimating the number of infections in epidemic models: a path counting approach,” (March 2012), http://arxiv.org/abs/1203.0502
- (7) K. Klemm, M. . Serrano, V. M. Egu luz, and M. S. Miguel, Sci Rep 2, 292 (2012)
- (8) L. H. Taylor, S. M. Latham, and M. E. Woolhouse, Philos Trans R Soc Lond B Biol Sci 356, 983 (Jul 2001)
- (9) L. A. Reperant, Vector Borne Zoonotic Dis 10, 105 (Mar 2010)
- (10) J. Xu, C. T. Davis, M. C. Christman, P. Rivailler, H. Zhong, R. O. Donis, and G. Lu, PLoS One 7, e38665 (2012)
- (11) M. Sikic, A. Lancic, N. Antulov-Fantulin, and H. Stefancic, “Epidemic centrality and the underestimated epidemic impact on network peripheral nodes,” ArXiV (October 2011), arXiv:1110.2558v1[physics.soc-ph]
- (12) B. Travençolo and L. da F. Costa, Physics Letters A 373, 89 (Dec. 2008), ISSN 03759601
- (13) M. Viana, J. a. Batista, and L. Costa, Physical Review E 85, 1 (Mar. 2012), ISSN 1539-3755
- (14) R. A. P. da Silva, M. P. Viana, and L. da Fontoura Costa, Journal of Statistical Physics(to appear 2012)
- (15) J. Kostka, Y. A. Oswald, and R. Wattenhofer, in 15th International Colloquium on Structural Information and Communication Complexity (SIROCCO), Villars-sur-Ollon, Switzerland (2008)
- (16) A. L. Lloyd and R. M. May, Science 292, 1316 (May 2001)
- (17) M. Barthélemy, A. Barrat, R. Pastor-Satorras, and A. Vespignani, J Theor Biol 235, 275 (Jul 2005)
- (18) N. Fountoulakis, K. Panagiotou, and T. Sauerwald, in Proceedings of the Twenty-Third Annual ACM-SIAM Symposium on Discrete Algorithms, SODA ’12 (SIAM, 2012) pp. 1642–1660
- (19) F. Chung and L. Lu, Annals of Combinatorics 6, 125 (2002)
- (20) J. Leskovec, J. M. Kleinberg, and C. Faloutsos, ACM Trans. Knowl. Discov. Data 1 (Mar. 2007), ISSN 1556-4681
- (21) J. Leskovec, K. J. Lang, A. Dasgupta, and M. W. Mahoney, Internet Mathematics 6, 29 (2009)
- (22) J. Leskovec, L. A. Adamic, and B. A. Huberman, ACM Trans. Web 1 (May 2007), ISSN 1559-1131
- (23) In 20620 runs, infections which go extinct usually (93%) do so in less than five iterations, and universally in less than 20.
- (24) H. Response, “Common and fundamental operational datasets registry,” web (August 2012), http://cod.humanitarianresponse.info/