Electronic structure of InAs quantum dots with GaAsSb strain reducing layer: localization of holes and its effect on the optical properties
Abstract
The electronic structure of InAs quantum dots covered with the strain reducing layer has been studied using the theory. We explain previous experimental observations of the red shift of the photoluminescence emission with increasing and its blue shift with increasing excitation power. For type-II dots are formed with holes localized in the GaAsSb close to the dot base; two segments at opposite sides of the dot, forming molecular-like states, result from the piezoelectric field. We also propose an experiment that could be used to identify the hole localization using a vertical electric field.
pacs:
73.21.La,78.55.Cr,78.67.HcInAs quantum dots (QDs) covered with the strain reducing layer (SRL) represent an efficient light source at the communication wavelengths of . Liu et al. (2006, 2005) The role of the SRL is to reduce the strain inside the QDs and to modify the confinement potential, both effects increasing the otherwise small emission wavelengths of the InAs QDs. Note that the capped QDs differ from the more conventional capped ones Mlinar and Peeters (2007); Chen et al. (2010) in several important aspects. The antimony atoms act as surfactant, helping to preserve the shape and the height of the QDs during the overgrowth. The resulting QDs are considerably higher than the -capped ones. Ulloa et al. (2007) Moreover, for , the formation of type-II dots with holes localized in the SRL was reported. Jin et al. (2007); Liu et al. (2006, 2005) The red shift of the emission energy with increasing from to has been found, Liu et al. (2005) more pronounced in the type-II confinement regime. A peculiarity of the type-II regime is a large blue shift (up to tens of meV) of the emission energy with the excitation power. Jin et al. (2007); Liu et al. (2005)
We have calculated the electronic structure of QDs capped by the SRL using a two-step approach. First, single particle states were obtained using the Nextnano++ solver Birner et al. (2007) based on the eight-band theory. Second, we calculated the energies of the excitons using the configuration interaction method with the basis set formed from the single particle states. Rodt et al. (2005) The values of the material constants are given in Ref. sup, . Based on published cross-section scanning tunneling micrographs (XSTM), Ulloa et al. (2007); Offermans et al. (2005) we assume a pyramidal shape of the model QD with the height of 8 nm and the base length of 22 nm. Both the shape and the dimensions were taken from Ref. Ulloa et al., 2007 without any changes. The results of Refs. Ulloa et al., 2007 and Offermans et al., 2005 also suggest that the QDs are composed of with a trumpet-like composition profile, with at the base of the pyramid (low In content) and at its top (maximum In content). Here we adopt this profile. The XSTM cannot determine the composition profile very reliably, Mlinar et al. (2009) thus we studied several other profiles and found only minor differences. sup The thickness of the SRL has been fixed at 5 nm and varied between 0.10 and 0.22.
Figure 1 shows the lowest transition energy as a function of . With increasing from 0.10 to 0.22, the energy red-shifts by 84 meV from 1055 meV to 971 meV, the origin being illustrated in the inset. This is in very good agreement with the optical data, Liu et al. (2005) where the energy shifts by 83 meV from 1050 meV to 967 meV. We emphasize that the red shift was reproduced without any modification of the shape and dimensions of the model QD. This is consistent with the observations of Ref. Ulloa et al., 2007 that the shape and size of the QDs are independent of . Recall that in the capped QDs, a large part of the red shift is caused by the increase of volume. Kuldová et al. (2006) For (), the probability of finding the hole inside the QD is larger than (smaller than ), which we call type-I (type-II) confinement in the following. We have found the type I to type II transition not to be abrupt, but rather to be a continuous process starting at low , accelerated in a certain range of ( for our dot), and finally saturating at high values of . sup Note that we found the type-II QDs for larger than usually reported. The redshift of the type-II confinement is faster because the bottom of the potential well shifts and not the barrier as in type I. Liu et al. (2006); Mlinar (2007); Klenovský et al. (2010)
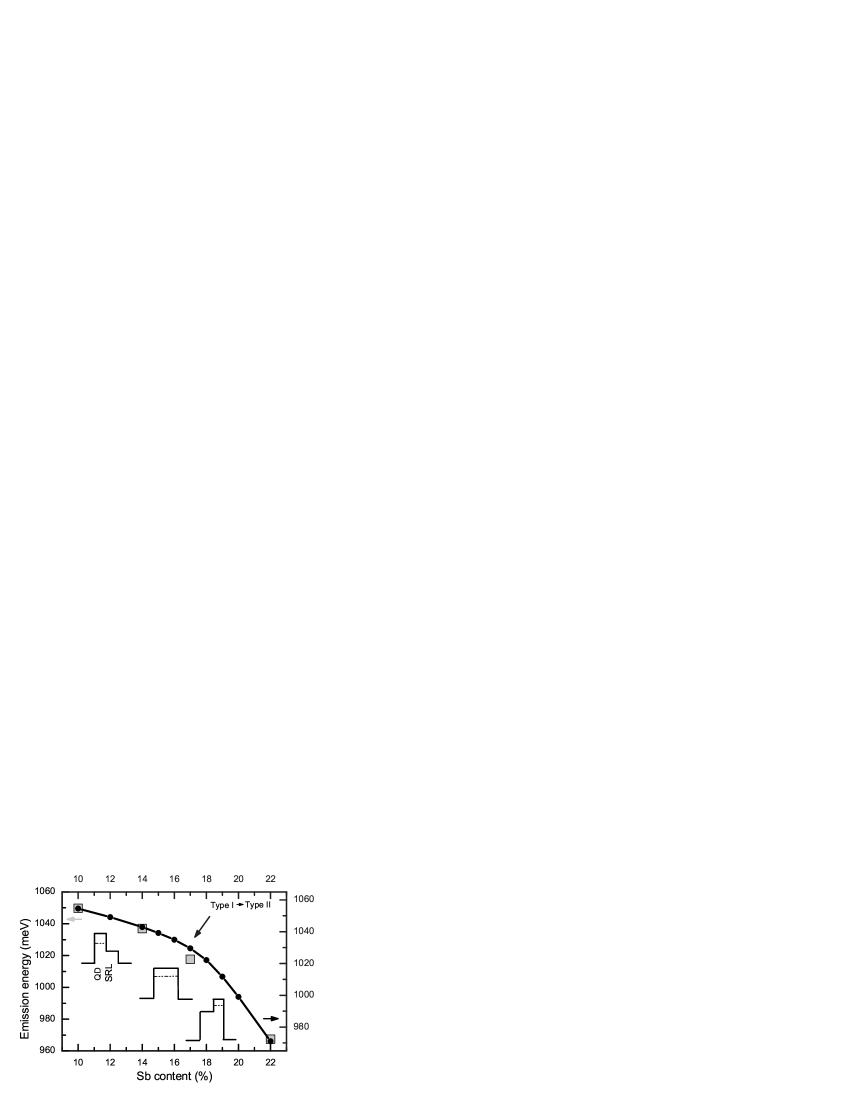
The type I to type II transition is associated with a reduction of the overlap of the electron and hole wave functions and the corresponding decrease of the Coulomb energy of the electron-hole pair from 26 meV at to 12 meV at . The biexciton emission energy calculated using the configuration interaction method Rodt et al. (2005) with 6 electron and 8 hole basis states is blue-shifted by 4 meV with respect to the exciton emission energy at , and blue-shifted by 18 meV at . While the multiexcitonic ordering in type-I QDs depends on structural properties of the QD Mlinar et al. (2009), the blue shift of the biexciton with respect to the exciton is a characteristic property of the type-II QDs. sup We suggest that the blue shift of the emission energy with the pumping intensity reported for type-II QDs Jin et al. (2007); Liu et al. (2005) is caused by the emission from the blue-shifted biexcitons emerging at high pumping powers. This could be verified by intensity-dependent micro-photoluminescence measurements. The biexciton energy could be used as the indicator of the type of the confinement.
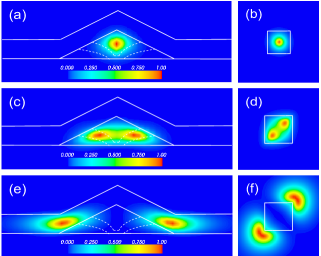
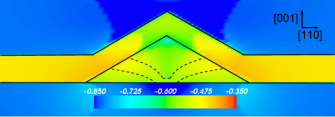
Next we address the wave functions. The probability densities of the lowest electron and hole states in the model QD are shown in Fig. 2 ( for electrons, and for holes). The electrons are localized in the In-rich region of the QD, the position of the maximum of their probability density being only weakly dependent on . For , the holes are localized inside the QD close to the base of the pyramid, in agreement with previously reported results for the type-I InAs QDs. Stier et al. (1999) For , the holes are located in the SRL. It has been assumed that they reside above the QD. Jin et al. (2007); Hospodková et al. (2010) We found them, however, to be located close to the base of the dot (see Figs. 2e, f). This is a consequence of the strain distribution. The shift of the heavy-hole band edge due to the biaxial strain is given by , where are the components of the strain tensor and is the biaxial deformation potential. Since is negative, the holes prefer the regions with large positive values of at the dot base as shown in Fig. 3.
If only the strain is included in the calculations, the maximum of the probability density of the hole ground state forms a ring surrounding the dot base. The piezoelectric field splits it into two segments located along the [110] direction. sup The wave functions resemble those of quantum dot molecules. Quantum dot molecules (QDM) are important for the quantum information processing as a potential tool for manipulating the qubits – a quantum gate. Burkard et al. (1999) Vertical QDMs can be easily manufactured and offer a strong coupling, but they cannot be scaled and suffer from the internal symmetry lowering induced by the strain field. Bester et al. (2005) On the other hand, lateral QDMs (LQDM) reported so far exhibit a weak coupling Beirne et al. (2006) and their properties cannot be tuned easily. The properties of the “molecules” under consideration are in many aspects superior. Most importantly, the distance between the segments and the tunneling energy can be easily tuned by the size of the QD and the Sb content in the SRL (the value of the tunneling energy corresponding to the QDs under consideration is 0.28 meV). The barrier between the segments is better defined. The clear disadvantage is the confinement of only one type of charge carriers, i.e., holes, ruling out applications in devices involving both electrons and holes. However, there exist promising proposals of devices which require only one type of charge carriers. Burkard et al. (1999) Our “molecules” represent an interesting alternative to the LQDMs discussed in this context.

In the following we propose an experiment that could be used to identify the localization of the holes, based on the Stark shift in the vertical electric field. Figure 4 shows the calculated transition energy and the vertical dipole moment as functions of the applied electric field. According to our calculations, the dipole moment of the exciton in zero field is small and oriented downwards (negative direction). The electron and the hole are both rather strongly confined and their vertical polarizability is low. As a consequence, only a weak Stark shift of the emission energy in a vertical electric field is predicted, positive when the field is oriented upwards (positive direction). For a sufficiently strong positive field, however, the hole state above the tip of the QD turns to be the ground state, sup the dipole moment of the exciton increases dramatically and changes its sign, and so does the Stark shift. The transition between the weak negative and large positive dipole moment is fairly steep and should be identifiable. For the hole ground state located above the tip of the QD, a similar transition would occur for a negative field. We note that this possibility could occur in real QDs due to, e.g., a higher antimony content in the SRL above the QD. Ulloa et al. (2010)
In conclusion, we have shown that the red shift of the emission energy with increasing Sb content in the SRL is mainly due to the modified confinement potential in the QD; there is no need to vary the structural parameters of the model dot with changing to reproduce the optical data. The blue shift of the emission with increasing pumping power is attributed to the increasing proportion of the biexcitons whose energy is considerably higher compared to the excitons. We have found that for the holes are localized in the SRL close to the base of the dot, rather than above it. An experiment involving external electric field has been proposed to verify this prediction.
The work was supported by the Institutional research program MSM 0021622410 and the GACR grant GA202/09/0676.
References
- Liu et al. (2006) H. Liu, M. Steer, T. Badcock, D. Mowbray, M. Skolnick, F. Suarez, J. Ng, M. Hopkinson, and J. David, J. Appl. Phys., 99, 046104 (2006).
- Liu et al. (2005) H. Liu, M. Steer, T. Badcock, D. Mowbray, M. Skolnick, P. Navaretti, K. Groom, M. Hopkinson, and R. Hogg, Appl. Phys. Lett., 86, 143108 (2005).
- Mlinar and Peeters (2007) V. Mlinar and F. M. Peeters, Appl. Phys. Lett., 91, 021910 (2007).
- Chen et al. (2010) J. F. Chen, R. C. C. Chen, C. H. Chiang, Y. F. Chen, Y. H. Wu, and L. Chang, Appl. Phys. Lett., 97, 092110 (2010).
- Ulloa et al. (2007) J. M. Ulloa, I. W. D. Drouzas, P. M. Koenraad, D. J. Mowbray, M. J. Steer, H. Y. Liu, and M. Hopkinson, Appl. Phys. Lett., 90, 213105 (2007).
- Jin et al. (2007) C. Y. Jin, H. Y. Liu, S. Y. Zhang, Q. Jiang, S. L. Liew, M. Hopkinson, T. J. Badcock, E. Nabavi, and D. J. Mowbray, Appl. Phys. Lett., 91, 021102 (2007).
- Birner et al. (2007) S. Birner, T. Zibold, T. Andlauer, T. Kubis, M. Sabathil, A. Trellakis, and P. Vogl, IEEE Trans. El. Dev., 54, 2137 (2007).
- Rodt et al. (2005) S. Rodt, A. Schliwa, K. Potschke, F. Guffarth, and D. Bimberg, Phys. Rev. B, 71, 155325 (2005).
- (9) See section B of the supplementary material at [URL will be inserted by AIP].
- Offermans et al. (2005) P. Offermans, P. Koenraad, J. Wolter, K. Pierz, M. Roy, and P. Maksym, Phys. Rev. B, 72, 165332 (2005).
- Mlinar et al. (2009) V. Mlinar, M. Bozkurt, J. M. Ulloa, M. Ediger, G. Bester, A. Badolato, P. M. Koenraad, R. J. Warburton, and A. Zunger, Phys. Rev. B, 80, 165425 (2009).
- (12) See section C of the supplementary material at [URL will be inserted by AIP].
- Kuldová et al. (2006) K. Kuldová, V. Křápek, A. Hospodková, J. Oswald, J. Pangrác, K. Melichar, E. Hulicius, M. Potemski, and J. Humlíček, phys. stat. sol. c, 3, 3811 (2006).
- (14) See section D of the supplementary material at [URL will be inserted by AIP].
- Mlinar (2007) V. Mlinar, Ph.D. thesis, Universiteit Antwerpen (2007).
- Klenovský et al. (2010) P. Klenovský, V. Křápek, D. Munzar, and J. Humlíček, J. Phys.: Conf. Series, 245, 012086 (2010).
- (17) See section E of the supplementary material at [URL will be inserted by AIP].
- Stier et al. (1999) O. Stier, M. Grundmann, and D. Bimberg, Phys. Rev. B, 59, 5688 (1999).
- Hospodková et al. (2010) A. Hospodková, E. Hulicius, J. Pangrác, J. Oswald, J. Vyskočil, K. Kuldová, T. Šimeček, P. Hazdra, and O. Caha, J. Cryst. Growth, 312, 1383 (2010).
- Burkard et al. (1999) G. Burkard, D. Loss, and D. DiVincenzo, Phys. Rev. B, 59, 2070 (1999).
- Bester et al. (2005) G. Bester, A. Zunger, and J. Shumway, Phys. Rev. B, 71, 075325 (2005).
- Beirne et al. (2006) G. Beirne, C. Hermannstadter, L. Wang, A. Rastelli, O. Schmidt, and P. Michler, Phys. Rev. Lett., 96, 137401 (2006).
- (23) See section F of the supplementary material at [URL will be inserted by AIP].
- Ulloa et al. (2010) J. M. Ulloa, R. Gargallo-Caballero, M. Bozkurt, M. del Moral, A. Guzman, P. M. Koenraad, and A. Hierro, Phys. Rev. B, 81, 165305 (2010).