The Challenge of the Largest Structures in the Universe to Cosmology
Abstract
Large galaxy redshift surveys have long been used to constrain cosmological models and structure formation scenarios. In particular, the largest structures discovered observationally are thought to carry critical information on the amplitude of large-scale density fluctuations or homogeneity of the universe, and have often challenged the standard cosmological framework. The Sloan Great Wall (SGW) recently found in the Sloan Digital Sky Survey (SDSS) region casts doubt on the concordance cosmological model with a cosmological constant (i.e. the flat CDM model). Here we show that the existence of the SGW is perfectly consistent with the CDM model, a result that only our very large cosmological -body simulation (the Horizon Run 2, HR2) could supply. In addition, we report on the discovery of a void complex in the SDSS much larger than the SGW, and show that such size of the largest void is also predicted in the CDM paradigm. Our results demonstrate that an initially homogeneous isotropic universe with primordial Gaussian random phase density fluctuations growing in accordance with the General Relativity, can explain the richness and size of the observed large-scale structures in the SDSS. Using the HR2 simulation we predict that a future galaxy redshift survey about four times deeper or with 3 magnitude fainter limit than the SDSS should reveal a largest structure of bright galaxies about twice as big as the SGW.
Subject headings:
cosmology: large-scale structure of the universe – cosmology: observations – galaxies: statistics – methods: numerical – methods: observational1. Introduction
The SGW (Gott et al. 2005) found in the SDSS (Aihara et al. 2011) is a thick filamentary structure of galaxies located at a distance of about from the Earth. Its densest part spans about , and the whole filament projected on a slice appears to be contiguous over the scale of more than . It is likely to be longer than the survey size since the structure is cut by the survey boundaries. The SGW is reminiscent of the CfA Great Wall (Geller & Huchra 1989), that triggered an intense dispute against the ‘Standard’ Cold Dark Matter (SCDM) model (White et al. 1987) or even the whole class of the gravitational instability models of structure formation (Park 1990 and references therein). The cosmological principle of homogeneity and isotropy of the universe was also doubted since structures as big as the survey size were always found as the survey size was increased.
The skepticism was relieved when Park (1990) demonstrated that large-scale structures (LSS’s) with size up to can appear in the standard CDM cosmological model in surveys like the CfA survey. About 20 years later the SGW revived the doubt on the cosmological principle and the current standard model (CDM model) since it is even larger than the CfA Wall and comparable with the survey size again (Sheth & Diaferio 2011).
In this paper we ask whether or not the existence of the LSS’s observed in the SDSS is consistent with the CDM model that adopts a homogeneous isotropic universe with primordial Gaussian random phase density fluctuations as predicted by inflation and a reasonably successful galaxy assignment scheme. The comparison of real superclusters with simulated ones has been made in several previous studies (Einasto et al. 2006; Einasto et al. 2007b; Einasto et al. 2007c; Araya-Melo et al. 2009). We also make predictions on the properties of the LSS’s to be observed in the future deeper surveys. Hubble constant of 72 km s is used in this paper.
2. The SDSS Sample
To identify the LSS’s in the observational sample we use the SDSS Main galaxy sample (Strauss et al. 2002), which is currently the largest three-dimensional sample of galaxies with a high sampling density. A volume-limited subsample of galaxies with absolute -band magnitude brighter than is generated from the KIAS value-added catalog (Choi et al. 2010a) , which supplements the bright galaxies missing in the SDSS sample. The magnitude limit is about magnitude brighter than the critical magnitude of the SDSS Main galaxy sample (Choi et al. 2007), and corresponds to the sample depth of . The mean separation between galaxies is . The sample is large enough to reduce the cosmic variance for the number of SGW-like structures, and yet the galaxy number density is high enough to trace major LSS’s. We calculate the comoving distances of galaxies using the WMAP 5 year cosmological parameters (Komatsu et al. 2009), and the Cartesian coordinates are calculated as in Park et al. (2007),
| (1) |
where and are the SDSS survey coordinates.
3. Identification of the Large-Scale Structures
Superclusters of galaxies have been identified by many previous studies, which typically use the smoothed luminosity density of galaxies and apply a threshold level to define structures (Basilakos, Plionis, & Rowan-Robinson 2001; Einasto et al. 2007a; Luparello et al. 2011; Liivamagi et al. 2012). Here we adopt the Friend-of-Friend (FoF) algorithm to identify the high-density LSS’s by connecting close galaxies because the results convey the visual impression well and the method uses effectively only one free parameter.
Before we search for structures in a sample of galaxies, we apply the FoF algorithm with the linking length of to the sample to find massive groups. The dispersion of each group along the line of sight is forced to be equal to that across the line of sight if the former is larger than the latter. We then search for LSS’s by connecting galaxies separated by less than the connection length . A very small results in no LSS’s and a very large gives just one LSS connecting all galaxies. We choose to use the critical linking length that results in the maximum number of structures (Basilakos 2003). In the case of our volume-limited sample we find the critical linking length of when the minimum number of member galaxies is set to .
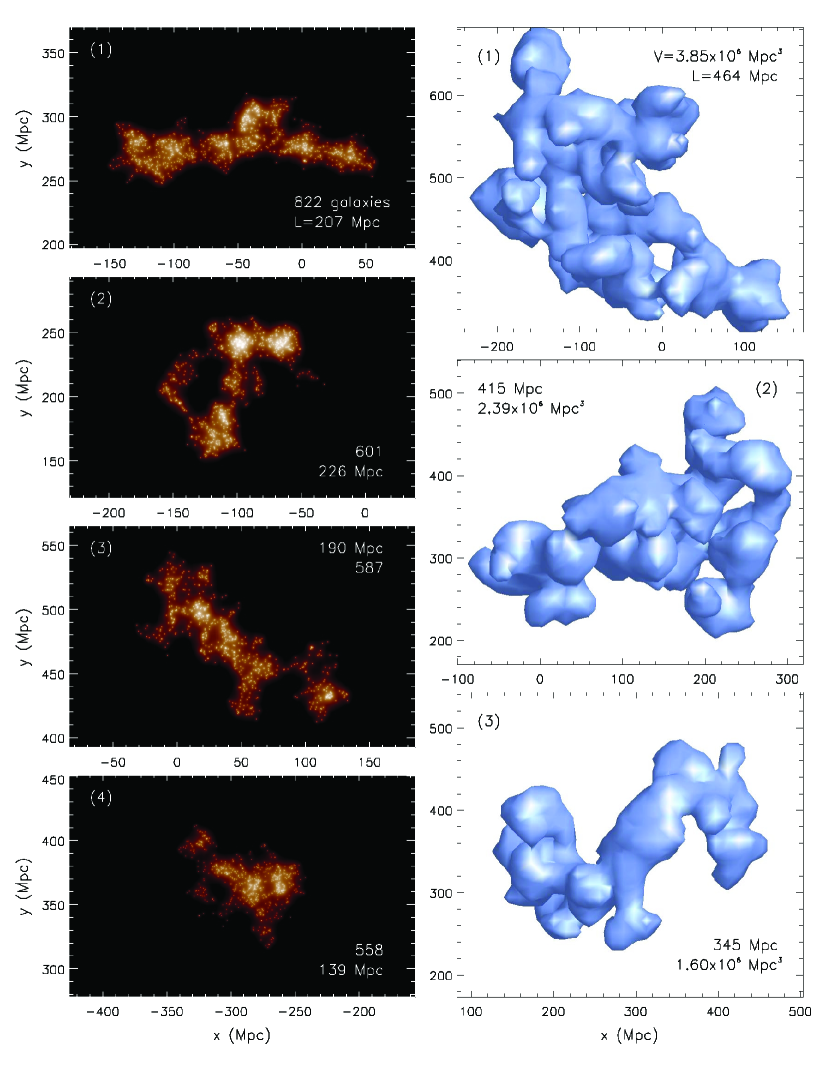
The left column of Fig. 1 shows the four richest high-density LSS’s found in the SDSS sample using the FoF method. The richest one among all structures discovered within our sample is a dense part of the SGW containing 822 bright galaxies (the top left panel). However, the largest one is the second richest structure with the maximum extent of containing 601 galaxies. The part of the SGW identified by our FoF method is long. The richest structures are typically filamentary, and filaments are often looping. Also occasionally found are superclusters attaching a few spreading filaments. The relatively poor structures are usually single superclusters or doubles connected by a thin filament. Each high-density LSSs contains a few superclusters found by several previous studies (Einasto et al. 2011a; Einasto et al. 2011b; Liivamagi et al. 2012).
The low-density LSS’s are found in a similar fashion. We tessellate the SDSS region with cubic pixels, and then mark the void core pixels from which there is no or only one galaxy within a radius of . Note that the high-density structures are regions where a ball with a radius of contains two or more galaxies. Therefore, our definition for void core pixels is consistent with and complementary to the definition of the high-density structures. To identify voids these void pixels contacting their faces are grouped together by using the FoF algorithm. We then expand each void out to the distance of - to account for the buffer region with high-density structures, where is the linking length used to identify the high-density structures. We adopt the critical that results in the maximum number of independent voids with volume of the core pixel region larger than .
On the right of Fig. 1 the three largest-volume void complexes found in our SDSS sample are shown. The largest one among the 385 voids found is located just behind and above (in and directions) the SGW (the top right panel, see also Einasto et al. 2011c, 2012 for a large void at similar location). Its total volume is as big as and its maximum extent is , more than twice larger than the dense part of the SGW. The largest few void complexes have very complicated topology showing many voids multiply connected by tunnels. The relatively smaller low-density structures are usually single voids.
4. -body Cosmological Simulation
Our main concern is to know how often these largest structures are expected to be observed in the currently popular model of the universe. Taking one more step further we ask if the whole distribution of richness or size of the observed LSS’s is consistent with the prediction of the standard model.
We use a very large cosmological N-body simulation, Horizon Run 2 (HR2) (Kim et al. 2011), for the comparison. The simulation evolved particles in a box with a side length of Gpc to calculate the gravitational evolution of primordial density fluctuations generated in accordance with a CDM model (Komatsu et al. 2009). The matter, baryon, and cosmological constant density parameters are set to , , and , respectively (see Kim et al. 2011). The minimum mass of dark matter subhalos identified in the simulation is M⊙, and the mean subhalo separation is , equal to that of our SDSS galaxy sample. We assume that each dark matter subhalo above the minimum mass contains one galaxy. This subhalo-galaxy one-to-one correspondence (sHGC) model has been proved to work well in terms of one-point function and its local density dependence (Kim et al. 2008), two-point function (Kim et al. 2009), and also topology (Gott et al. 2009; Choi et al. 2010b). Using this galaxy assignment scheme and the idea of abundance matching we assume that the subhalos with mass above M⊙ compare with our SDSS galaxies brighter than .
The total volume of our SDSS sample is effectively. Our Horizon Run 2 simulation, about 16 times larger in linear size, is for the first time large enough to capture the large scale power actually present in the standard model of cosmology and at the same time has a mass resolution high enough to simulate the SDSS Main Galaxy Sample. This uniqueness of the simulation enables us to estimate the statistical likelihood of the LSS’s found in the observations.
5. Comparison between the observations and the CDM model
We make 200 SDSS-like surveys of the ‘galaxies’ in the simulation at the present epoch, and analyze the mock survey samples in exactly the same way the observational data is analyzed.
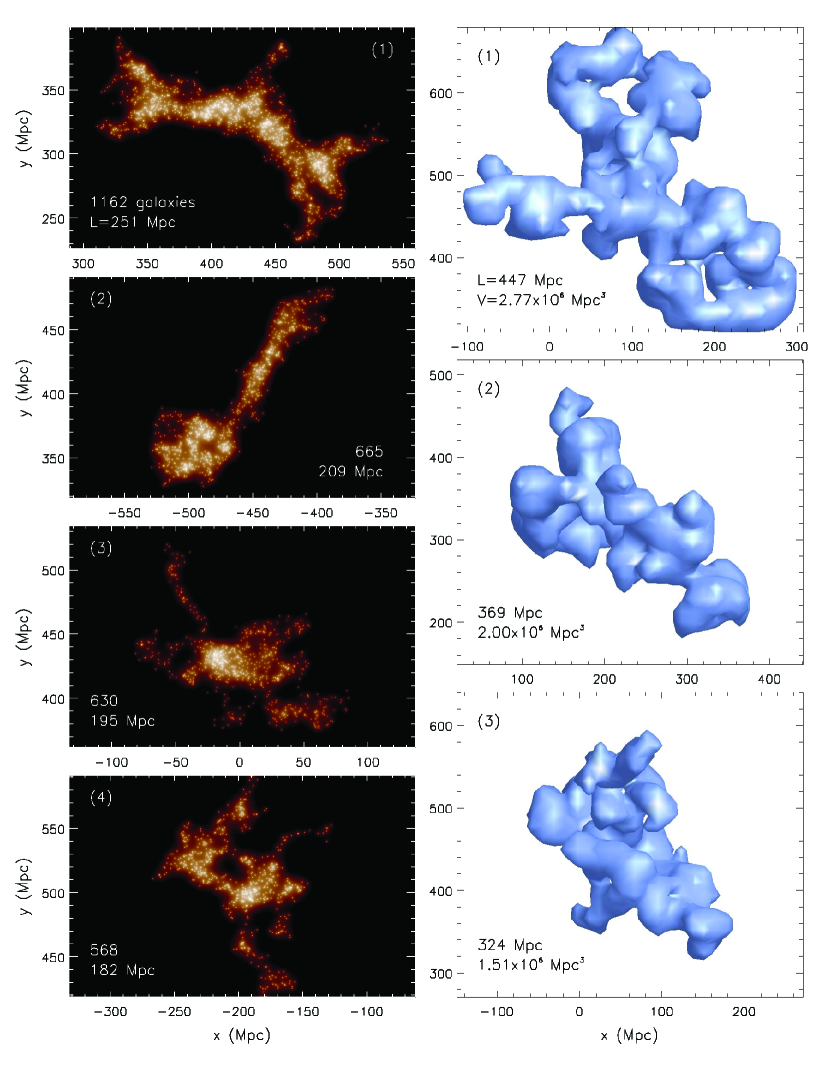
For each mock sample the fingers-of-god are identified and compressed, and the critical linking length giving the maximum number of LSS’s is found. We find that the mean and standard deviation of the linking lengths from the 200 mock SDSS samples are , quite close to that of the observational sample. Fig. 2 shows the four largest typical high-density LSS’s and three largest typical low-density structures selected from the 200 mock samples. For example, the largest one in the figure is the structure having the approximately median maximum extent and also the median richness (or volume in the case of low-density structures) among the 200 largest structures found in the 200 mock samples. And the second largest one is the median structure selected from the 200 second largest ones.
Out of the 200 mocks 137 samples contain a high-density structure richer than the SGW. We also find that the largest high-density structure is longer than the SGW identified in the same way in 155 cases. Therefore, we conclude that structures like the SGW can be easily found in surveys like the SDSS in the CDM universe even though the LSS’s grew from primordial Gaussian fluctuations in a homogeneous isotropic background. On the other hand, none of the mock samples has the 6-th richest or largest structure richer or larger than the SGW. This means that even though the SGW-like structures can be found quite often in a SDSS-like survey, such large structures are always one of the top six richest and largest structures. The SGW is indeed a rare object, and was able to be found because of the large survey volume of the SDSS.
Our conclusion is opposite to that of Sheth & Diaferio (2011), who used the extreme value statistics to estimate the likelihood of finding a SGW-like object in the SDSS. They claimed that the existence of the SGW is a event in the flat CDM universe with the r.m.s. amplitude of density fluctuation in a radius sphere of , and is difficult to reconcile with the model.
To further inspect the consistency between the observations and the CDM model we calculate the distribution functions of the richness and size of the LSS’s. Fig. 3 shows the distributions of the number of structures with member galaxies more than (open circles in the top panel) and with a maximum extent larger than (open circles in the bottom panel). The -axis is the number of structures per unit SDSS volume. The mean and standard deviation of the cumulative histograms from 200 mock surveys are shown as lower solid lines and error bars. It can be seen that the observed richness and size distributions agree astonishingly well with the simulation.
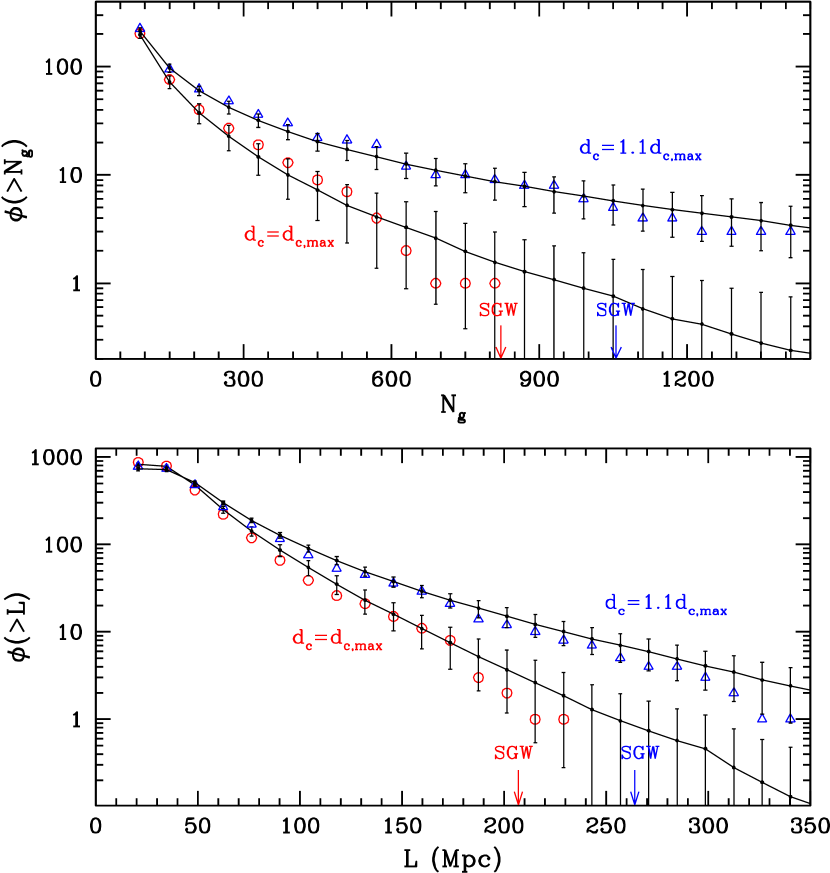
Our CDM simulation tells us that on average the richest high-density LSS in the flat CDM universe in a SDSS volume is expected to contain 957 galaxies brighter than when the linking length is , and that the typical size of the largest structure is . These values compare with 822 galaxies and for the SDSS sample. Therefore, the largest structures in the observations are actually a little smaller than the CDM expectations both in the richness and size . The triangles and upper solid lines are the cumulative histograms for the observation and the simulation when the linking length is increased by 10% above the critical value. The plots demonstrate that the agreement does not depend on the choice of the linking length.
Springel et al. (2006) claimed that a SGW-like object was found in their Millennium Simulation to support their view that LSS does not provide the strongest challenge to CDM. However, considering the fact that the matter fluctuation power spectrum of their simulation deviated largely from the CDM theory near the simulation box scales due to incorrect normalization and statistical fluctuations (Springel et al. 2005) and also having only one simulation whose volume is roughly equal to SDSS, it would be difficult to draw such a conclusion on the prevalence of a SGW-like structure in the SDSS-like surveys in the CDM universe. Our HR2 is about times larger than the volume of the SDSS sample with the fundamental mode more than 15 larger than the depth of SDSS, and accurate statistical comparisons as presented here are possible.
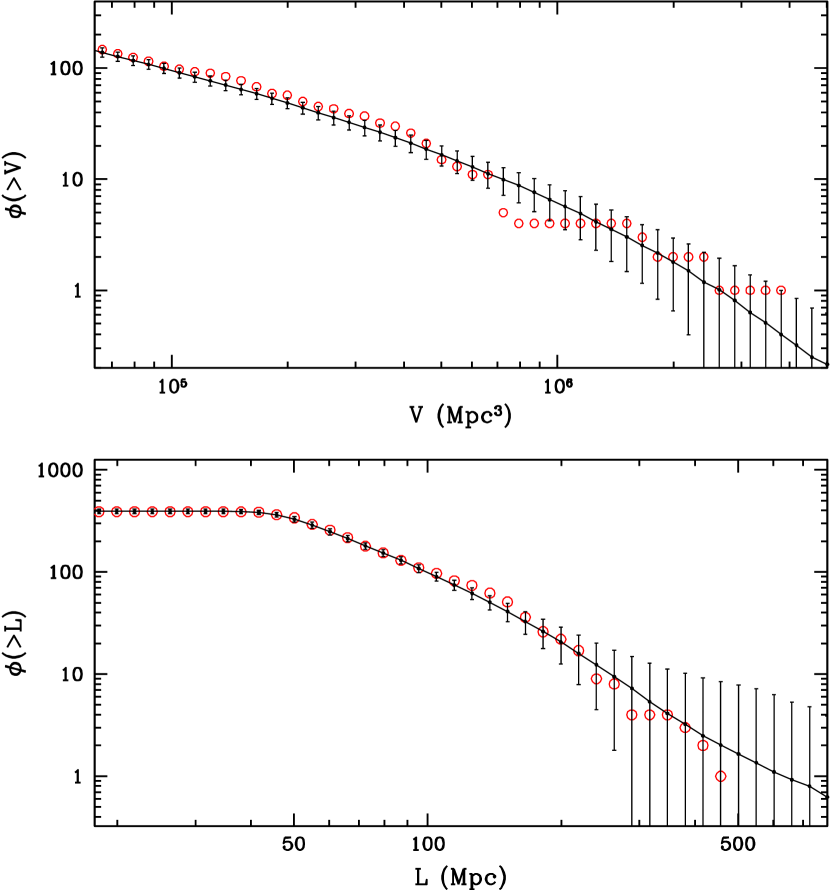
The impressive agreement between the observations and the CDM model is also found for the volume and size of void complexes. Fig. 4 shows the number of the void complexes in the SDSS sample with volume larger than (open circles in the upper panel) and that with the maximum extent larger than (open circles in the bottom panel). The cumulative distribution functions agree very well with the mean of the 200 mock surveys in the HR2 (solid lines with error bars).
To find how the size of the largest LSS scales as the survey size increases we made 27 non-overlapping mock surveys in the HR2 simulation having the SDSS angular mask but with the outer boundary located at or redshift . These surveys are about 4 times deeper or 3 magnitude fainter than the SDSS. We use these mock surveys to correctly account for the survey boundary effects on the scaling of the LSS. We find that the largest LSS typically has the mean number of galaxies of and the maximum extent of . Therefore, the maximum richness and size will increase by a factor of only about 3 and 1.7, respectively, and the universe will look more homogeneous over the scale of the survey size.
6. Conclusions
We identify high-density and low-density LSS’s in the SDSS to test whether or not the current standard CDM model of the universe can explain the observed structures of bright galaxies (Choi et al. 2010b). The LSS’s used in this comparison are those when the characteristic connection lengths result in the maximum number of structures. It is found that the richest high-density structure is the dense part of the SGW, which is also the second largest structure. The low-density LSS’s are typically much larger than the high-density counter parts, and the largest one is found to be long.
The Horizon Run 2 simulation of the CDM universe is used to make a set of mock SDSS surveys. Galaxies are assigned to dark matter subhalos assuming that each halo contains one galaxy and adopting the abundance matching (Kim et al. 2008). LSS’s are identified in the exactly same way that the SDSS data is analyzed. We find that the structures with richness and size similar to the SGW are usually one of the richest and/or the largest structures in the mock samples. To estimate the statistical significance of the largest observed LSS’s and to check the consistency of the properties of the observed LSS’s with those of the structures found in CDM we measure the distribution functions of richness and maximum extent of LSS’s identified in the SDSS and the mock samples. It is found that the observed distribution functions agree with those of the simulation astonishingly well. We conclude that both observed high-density and low-density LSS’s have the richness/volume and size distributions consistent with the CDM universe. This agreement between the observations and the theoretical predictions should be considered as one of the great successes of the CDM cosmological model.
Einasto et al. (2006, 2007b, 2007c) compared properties of 2dFGRS and SDSS superclusters with those of superclusters identified from the Millennium Run mock galaxy catalogue. They showed that the geometric properties of real superclusters such as the size, the degree of asymmetry and compactness, and the mass of the richest superclusters are similar to those of simulated ones (see also Araya-Melo et al. 2009). It was found that the fraction of such extremely massive and richest superclusters is too small in the simulated samples when compared to the observed samples, and the morphology of the richest supercluster in the SGW is not recovered in simulation (see also Einasto et al. 2011b). Richness and luminosity function of LSS’s depend sensitively on three things: first, the initial conditions such as the primordial power spectrum, second, the galaxy (and their luminosity) assignment scheme, and third, the LSS identification method. Therefore, for a fair comparison between observations and simulations, it is very important to use the same mass objects and to identify the LSS’s using the same criteria. Whether or not the largest LSS’s of the CDM universe have properties different from the observed ones remains to be studied further.
We note in this study that the properties of LSS’s depend sensitively on the initial power spectrum and the growth of structures and can be a powerful tool to discriminate among cosmological models and galaxy formation scenarios. We plan to further explore the usefulness of using the LSS properties in cosmology in the future studies.
References
- Aihara et al. (2011) Aihara, H., Allende Prieto, C., An, D., et al. 2011, ApJS, 193, 29
- Basilakos et al. (2001) Basilakos, S., Plionis, M., & Rowan-Robinson, M. 2001, MNRAS, 323, 47
- Basilakos (2003) Basilakos, S. 2003, MNRAS, 344, 602
- Choi et al. (2010a) Choi, Y.-Y., Han, D.-H. & Kim, S. S. 2010a, JKAS, 43, 191
- Choi et al. (2007) Choi, Y.-Y., Park, C. & Vogeley, M. S. 2007, ApJ, 658, 884
- Choi et al. (2010b) Choi, Y.-Y., Park, C., Kim, J., Gott, J. R., Weinberg, D. H., Vogeley, M. S., & Kim, S. S. 2010b, ApJS, 190, 181
- Einasto et al. (2006) Einasto, J., Einasto, M., Saar, E., et al. 2006, A&A, 459, L1
- Einasto et al. (2007a) Einasto, J., Einasto, M., Saar, E., et al. 2007a, A&A, 462, 811
- Einasto et al. (2007b) Einasto, J., Einasto, M., Saar, E., et al. 2007b, A&A, 462, 397
- Einasto et al. (2007c) Einasto, J., M., Saar, E., Liivamagi, L. J., et al. 2007c, A&A, 476, 697
- Einasto et al. (2011a) Einasto, M., Liivam¨agi, L. J., Tago, E., et al. 2011a, A&A, 532, 5
- Einasto et al. (2011b) Einasto, M., Liivam¨agi, L. J., Tempel, E., et al. 2011b, ApJ, 736, 51
- Einasto et al. (2011c) Einasto, J., Suhhonenko, I., H¨utsi, G., et al. 2011c, A&A, 534, 128
- Einasto et al. (2012) Einasto, M., Liivam¨agi, L. J., Tempel, E., et al. 2012, A&A, 542, 36
- Geller & Huchra (1989) Geller, M. J., & Huchra, J. P. 1989, Science, 246, 897
- Gott et al. (2005) Gott, J. R., et al. 2005, ApJ, 624, 463
- Gott et al. (2009) Gott, J. R., Choi, Y.-Y., Park, C. & Kim, J. 2009, ApJ, 695, L45
- Kim et al. (2008) Kim, J., Park, C., & Choi, Y. Y. 2008, ApJ, 683, 123
- Kim et al. (2009) Kim, J., Park, C., Gott, J. R.& J. Dubinski, J. 2009, ApJ, 701, 1547
- Kim et al. (2011) Kim, J., Park, C., Rossi, G., Lee, S. M. & Gott, J. R. 2011, JKAS, 44, 217
- Komatsu et al. (2009) Komatsu, E., et al. 2009, ApJS, 180, 330
- Liivamagi et al. (2012) Liivamagi, L. J., Tempel, E. & Saar, E. 2012, A&A, 539, 80
- Luparello et al. (2011) Luparello, H., Lares, M., Lambas, D. G. & Padilla, M. D. 2011, MNRAS, 415, 964
- Park (1990) Park, C. 1990, MNRAS, 242, 59
- Park et al. (2007) Park, C., Choi, Y.-Y., Vogeley, M. S., Gott, J. R., & Blanton, M. R. 2007, ApJ, 658, 898
- Sheth & Diaferio (2011) Sheth, R. K. & Diaferio, A. 2011, MNRAS, 417, 2983
- Springel et al. (2006) Springel, V., Frenk, C. S. & White, S. D. M. 2006, Nature, 440, 1137
- Springel et al. (2005) Springel, V., et al. 2005, Nature, 435, 629
- Strauss et al. (2002) Strauss, M. A., et al. 2002, ApJ, 124, 1810
- White et al. (1987) White, S. D. M., Frenk, C. S., Davis, M., & Efstathiou, G. 1987, ApJ, 313, 505